Raw materials
Whole green lentil flour was provided by the Canadian International Grains Institute (Winnipeg, MB, Canada). Spray-dried egg yolk powder was obtained from Canadian Inovatech Inc. (Winnipeg, MB, Canada). The following gums were kindly provided by Tic Gums (Belcamp, MD, USA): xanthan gum (TIC Pretested® Ticaxan® Xanthan Powder), gum arabic (TIC Pretested® Gum Arabic FT Powder), PGA (TICA-algin® PGA LV powder), guar gum (TIC Pretested® Guar gum 8/24 powder), pectin (TIC Pretested® pectin HM Slow Set Powder). Potassium sorbate was provided by Nealanders International Inc. (Mississauga, ON, Canada). All other ingredients used in the preparation of the salad dressings were purchased from a local supermarket. All other chemicals used were of analytical grade.
Salad dressing sample preparation
Salad dressings were prepared using different combinations of oil (7.5%-35.0%) and gums (0.2%-0.5%) as described in section 2.7. The five different types and combinations (ratios) of gums used were XG; XG: GA=0.5:1; XG: PGA= 0.5:1; XG: PE=1:1; XG: GG=1:1. The specific ratios were selected based on the work reported previously.20-22 The other ingredients in the recipe were as follows (expressed as a percentage [w/w]): whole green lentil flour 3.5%, vinegar 7.0% (with 5% acetic acid), lemon juice 5.0%, salt 1.0%, and sugar 3.5%. The gums, or combinations of them with appropriate concentrations (0.2%, 0.35%, and 0.5%), and sugar were prepared in advance by mixing the desired amount of dry sample with deionized water while continuously dispersing the gum and sugar solution with a magnetic stirrer at ambient temperature for 2 h. The resulting dispersions were stored overnight to ensure complete hydration prior to adding other ingredients. All other ingredients except oil were then added and mixed until homogeneous. Potassium sorbate (0.02 wt %) was added as an antimicrobial agent. Lastly, canola oil was added and emulsification was achieved using an Ultra-Turrax homogenizer (Model T25, Janke& Kunkel, Ika-Labortechnik, Staufen, Germany) equipped with a S25-18G dispersing tool at 13,800 rpm for 3 min. All measurements were performed the day the samples were prepared.
Texture analysis
Texture analysis was performed with a TA-XT2 texture analyser (Stable Micro System, UK). Salad dressing samples were placed in cylindrical bottles (60 mm diameter × 10 mm height) and were punctured with a cylindrical probe (25 mm diameter × 35 mm height) in a 5000 g load cell at a crosshead speed of 1.0 mm/s. Firmness values were measured and were taken as the height of the peak force during the first compression.
Rheological measurements
Rheological measurements were performed with an AR 1000 rheometer (TA Instruments, New Castle, DE, USA) equipped with a plate/cone system. Steady-state flow tests and dynamic oscillatory tests were conducted using a stainless steel parallel plate with a diameter of 4 cm. The gap setting was 1 mm. One tablespoon of sample was placed at the center of the circular plate, and excess sample was removed from the edges of the plate. The steady-state flow tests were performed at increasing shear rates (0.02 to 300 s-1). Experimental flow curves were fitted using the power law:
wheren is the flow behavior index (dimensionless), η is the shear viscosity (Pa.s), m is the consistency coefficient (Pa.sn), and
is the shear rate (s-1). Dynamic oscillatory tests were then performed within the LVE range at 0.1% strain with angular frequency increasing from 0.1 to 100 rad/s. Storage modulus (G′) and loss modulus (G″) vs. angular frequency were measured for all samples.
Color measurements
The color of the salad dressing samples was measured with the L*, a*, b* tristimulus system using a Minolta CM-503c spectrophotometer (Minolta Co. Ltd., Osaka, Japan). A fixed amount of salad dressing was poured into the measuring cup, which was then surrounded with a black paper strip. In this color system, L* is a measure of lightness to darkness (0=black and 100=white), a* is a measure of redness (+ve) to greenness (−ve), and b* is a measure of yellowness (+ve) to blueness (-ve). The data were also characterized in terms of chroma (C) and color difference (ΔE) to highlight differences between the samples:
where ΔL, Δa, Δb are the color differences when compared with the color parameters of milk.
Droplet size distribution
The particle size of the salad dressings was analyzed by laser light-scattering using the Mastersizer 2000 MU particle size analyzer (Malvern Instruments Ltd, Worcestershire, UK) with the Hydro 2000MU accessory using distilled water as a dispersant at the speed of 2000 rpm. In keeping with the procedure described by Worrasinchai et al.23 the results were reported as the specific weighted mean diameter (or Sauter mean diameter D[3,2]) and the volume-weighted mean diameter (D[4,3]), respectively,
,
Where ni is the number of droplets of diameter di. The specific surface area (m2/ml) was also calculated using the following equations:
Statistical analysis
Response surface methodology (RSM) was used to study the main effect of the component variables on the physical properties of lentil flour-supplemented salad dressings prepared with XG, XG-GA, XG-PGA, XG-PE, and XG-GG. A RSM Miscellaneous experimental design with 32 full factorials and 5 center runs was used with two independent variables (x1, oil concentration: 7.5%, 21.25%, 35%; x2, gum concentration: 0.2%, 0.85%, 1.5%) at three coded levels (-1, 0, +1) and five replicates at the center point(oil concentration, 21.25wt%; gum concentration, 0.85wt%). A complete design consisted of 14 experimental runs for dressings formulated with each gum.
The effect of the two independent variables on the following responses was modeled and optimized using RSM: firmness (Y1), flow behavior index n (Y2), consistency coefficient m(Y3), apparent viscosity ηap (Y4), plateau modulus (Y5), L* value (Y6), a* value (Y7), b* value (Y8), ΔE (Y9), chroma (Y10), D[3,2] (Y11), D[4,3] (Y12), and specific surface area (Y13). All the response surface plots were generated by keeping one variable constant at the center point and varying the other two variables within the experimental range. The regression model selected for predicting individual Y variables is given by the following equation:
Where Y is the predicted response, β0 is the constant, βi, βii, βij are the regression coefficients, and xi, xjare the levels of independent variables.24 One-way analysis of variance (ANOVA) was used to evaluate the significant terms in the model for each response. The adequacy of models was ensured by removing the non-significant terms (P>0.05) using a step-wise “backward” multiple reduction algorithm.
The overall optimization was carried out within the range of experimental conditions. The responses obtained for five types of pourable commercial salad dressing were used as the target values to predict the optimal formulation during optimization procedure. The optimal levels of the two independent variables leading to the desired properties were obtained for each gum or combination of gums. Design Expert, version 7 (Stat-Ease Inc., Minneapolis, MN, USA), was used to design the experiments, generate the response surfaces and optimize the variables.
The associated R2 and adjusted R2 for selected responses for the 14 × 5 experiments carried out using the Miscellaneous experimental design as described in section 2.7were computed. Coefficients for the linear, quadratic, and interaction terms of each model were calculated and tabulated for this response in Table 1. Some responses could not be fitted satisfactorily to mathematical models due to lack of fit or poor fit with low R2 or adjusted R2 values. The discussion therefore only addresses responses which exhibited statistically significant predicted models (P<0.05) with non-significant lack of fit (P>0.05).
Regression models of firmness
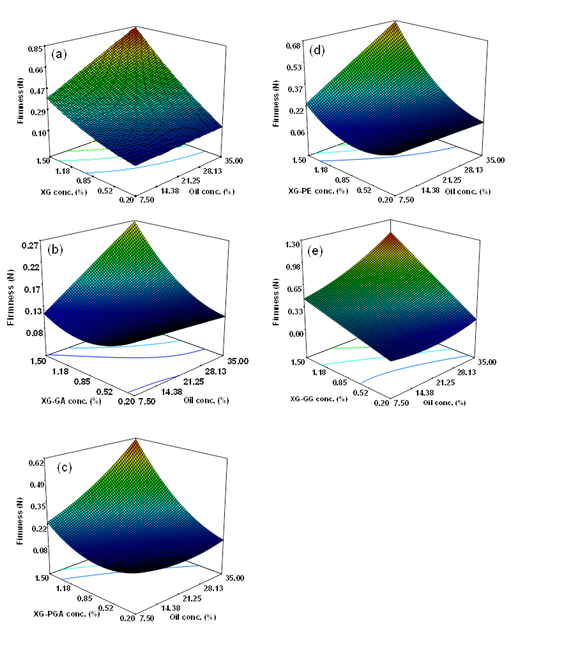
Figure 1 Response surface plots of firmness (N) for dressings prepared with (A) xanthan gum (XG), (B) xanthan gum-gum Arabic (XG-GA), (C) xanthan gum-propylene glycol alginate (XG-PGA), (D) xanthan gum-pectin (XG-PE), and (E) xanthan gum-guar gum (XG-GG).
Figure 1 shows the response surfaces of firmness for the dressing emulsions prepared with different gums as a function of the component variables (x1, oil; x2, gum). As shown, firmness (Y1) for all gums and combinations thereof exhibited a similar increasing trend in response to increasing oil concentrations (x1) at higher gum content. For dressings prepared with XG-GA, XG-PGA, and XG-PE (Figure 1B-1D), an increase in the gum concentrations (x2) yielded higher firmness (Y1) values at higher oil content (x1), whereas dressings with XG and XG-GG showed an increasing trend in Y1 with an increase in gum content (x2) at all oil concentrations within the experimental range studied (Figure 1A & 1E). The results are consistent with those of Raymundo et al.25 which showed that firmness increased with increasing protein, xanthan gum, and oil concentrations in a low-fat oil-in-water emulsion reportedly.
The significant second-order regression models with R2 of 0.982, 0.849, 0.987, 0.956, and 0.974 for dressings prepared with XG, XG-GA, XG-PGA, XG-PE, and XG-GG are presented in Eq. 1, 2, 3, 4, 5, respectively.
(Eq. 1)
(Eq. 2)
(Eq. 3)
(Eq. 4)
(Eq. 5)
Regression models of rheological parameters
The regression models for responses, including flow behavior index (n value), consistency coefficient (m value), apparent viscosity (ηap), and plateau modulus (
), are discussed below.
Regression model of the flow behavior index (n value): The flow behavior index (n) obtained using the power law model was less than 1 (0.1 to 0.7) for all the salad dressings indicative of pseudoplastic behavior. An acceptable food emulsion with high viscosity and good mouth feel should have a low n value as gum solutions with high n value tend to be slimy in the mouth.26
The multiple regression equations for dressings prepared with XG, XG-PGA, XG-PE, and XG-GG (R2values of 0.9668, 0.755, 0.651, and 0.963, respectively) are presented in Eq. 6, 7, 8, and 9, respectively.
(Eq. 6)
(Eq. 7)
(Eq. 8)
(Eq. 9)
From the above equations, it is evident that for dressings prepared with XG-PGA or XG-PE, the flow behavior index (Y2) was dependent (P<0.05) solely on gum concentration (x2) (Eq. 7, 8). Quadratic equations (Eq. 6, 9) were obtained for dressings prepared with XG and mixed XG-GG.
As shown in Figure 2, the statistical surface representing Y2was dependent on oil (x1) and gum content (x2) for dressings formulated with XG and XG-GG (Figure 2A & 2D). As predicted by the statistical model, n value was dependent only on gum concentration (x2) for XG-PGA and XG-PE (Figure 2B & 2C). In general, for all dressings, an increase in the concentration of x2was accompanied by an increase in pseudoplasticity, as evidenced by a decrease in the values of the flow behavior index. This suggests that the magnitude of change in apparent viscosity corresponding to the change in shear rate tended to increase as the gum concentration increased in the continuous phase of the emulsion. For the dressing with XG alone, the tendency for the n value to decrease was less pronounced when the gum concentration was between 1.18% and 1.50%, which suggests that the pseudoplastic behavior remained quite stable above a threshold XG concentration in the salad dressing system.
In a dressing system, gums may interact with proteins from egg yolk and pulses, with starch from pulses, as well as with each another. The extent of these interactions, which is dependent on the gum concentration, polysaccharide molecular weight and the presence of functional groups of polysaccharides, may explain the differences in the rheological behavior of the dressing systems prepared with different gums.
Regression models of the consistency coefficient (m value): The secondary-order polynomial models fitted to the m value (Y3) are presented in Eq. 10, 11, 12, 13, and 14 for dressings prepared with XG, XG-GA, XG-PGA, XG-PE, and XG-GG (R2 values of 0.995, 0.977, 0.989, 0.986, and 0.993, respectively.
(Eq. 10)
(Eq. 11)
(Eq. 12)
(Eq. 13)
(Eq. 14)
All the dressings had similar response surface plots for them value (Y3) as that shown in Figure 3(A). A synergistic effect between gum(s) and oil can be observed in the response plots, with maximum mvalues achieved at the highest combination level for the two variables. This behavior was most pronounced for dressings prepared with XG and XG-GG. This observation is supported by earlier reports on hydrocolloids solutions indicating that the magnitude of the consistency coefficient increased with an increase in the concentration of the GA-GG combination, as well as the GA-XG combination.6 Marcotte et al.27 also reported that m value increased with increasing gum content for carrageenan, pectin, gelatin, starch and xanthan gum. The increase in the viscous nature of the salad dressings (m value) with increasing oil content, especially at high gum concentration(s), is suggestive of the formation of a more compact network structure. Overall, the magnitude of the consistency coefficient (Y3) was highest for dressings prepared with XG-GG and XG and lowest for XG-GA within the range of concentrations studied. The dressings prepared with XG-PE and XG-PGA had intermediate values.
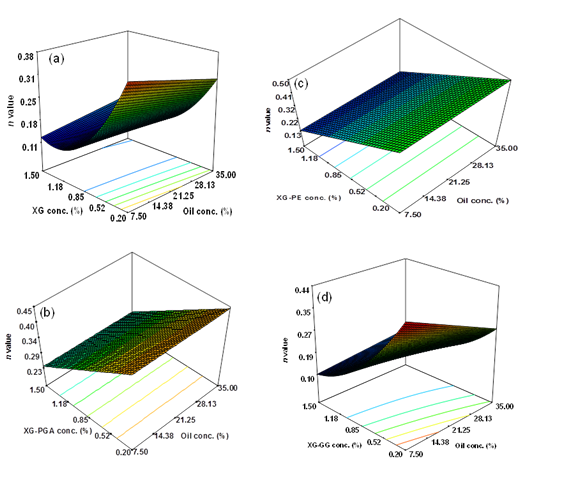
Figure 2 Response surface plots of power law model flow behavior index (n value) for dressings prepared with
- Xanthan gum (XG),
- Xanthan gum-propylene glycol alginate (XG-PGA),
- Xanthan gum-pectin (XG-PE), and
- Xanthan gum-guar gum (XG-GG).
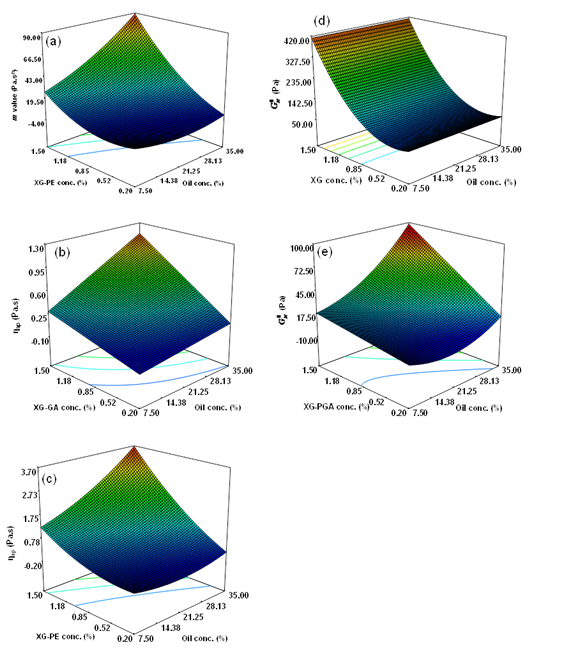
Figure 3 Response surface plots of
- Power law model consistency coefficient (m value) for dressings prepared with xanthan gum-pectin (XG-PE).
- Power law model apparent viscosity (ηap) obtained at shear rate of 46.16s-1 for dressings prepared xanthan gum-gum Arabic (XG-GA).
- Power law model ηap for dressings prepared xanthan gum-pectin (XG-PE).
- Plateau modulus (
) obtained during dynamic oscillatory testing for dressings prepared with xanthan gum (XG), (e)
for dressings prepared with xanthan gum-propylene glycol alginate (XG-PGA).
Regression models of the apparent viscosity (ηap): The apparent viscosity (ηap) at a shear rate of 46.16s-1, which as reported is based on the shear rate of the perceived in-mouth thickness of normal fluids, was calculated according to the power law model.28 Multiple regression equations with R2of 0.995, 0.855, 0.931, 0.994, and 0.998 for dressings prepared with XG, XG-GA, XG-PGA, XG-PE, and XG-GG are presented in Eq. 15, 16, 17, 18, and 19, respectively.
(Eq. 15)
(Eq. 16)
(Eq. 17)
(Eq. 18)
(Eq. 19)
All the response surface plots were similar to that shown in Figure 3B & Figure 3C, with an increase in gum(s) content and oil components yielding a linear (Figure 3B) or non-linear increase (Figure 3C) in ηap (Y4). The results indicate that the perceived mouth feel thickness (i.e., ηap at 46.16s-1) increased with increasing fat and hydrocolloid concentrations. The effect of oil on ηap (Y4) is in good agreement with the findings reported by Wendin et al.29 specifically that an increase in fat content increased perceived thickness, fattiness, and toughness during sensory analysis. The flow behavior of emulsions is determined by the colloidal nature of the continuous phase as well as by the average particle size distribution.30 An increase in oil (x1) and hydrocolloid content (x2) can lead to an increased degree of chain entanglement (i.e., hydrogen bonding with hydroxyl groups) and the distortion in the velocity pattern of the liquid by hydrated molecules of the solute in the emulsion system.31,32 It is, thus, likely that as the gum concentration increased, larger numbers of high molecular weight molecules formed in the emulsion, increasing the resistance to flow and, therefore, the apparent viscosity of the emulsion.
Regression models of the plateau modulus (
): Both the storage modulus (G′) and the loss modulus (G″), as measured during the dynamic oscillatory tests, were frequency-dependent and they both increased with increasing frequency (results not shown). G′ was significantly greater than G″ across the tested frequency range for all samples indicative of a predominantly elastic character. A plateau region observed in the oscillation curves at high frequencies may reflect a gel-like structure of a flocculated emulsion with the development of an entangled network.25,33 The statistically significant second-order polynomial models with R2 of 0.931 and 0.903 for dressings prepared with XG or XG-PGA are presented in Eq. 20 and 21, respectively.
(Eq. 20)
(Eq. 21)
Figure 3D & 3E shows the three-dimensional response surface plots for the independent variables and their interactions with the predictive model for the plateau modulus (
).
(Y5) increased with an increase in gum content, especially for XG (Figure 3D) which showed significant increases at all oil concentrations within the experimental range studied. For the dressings prepared with XG-PGA, higher oil concentrations resulted in higher increases in
(Figure 3E).
is a measure of the intensity of the entangled network that develops between the adsorbed and non-adsorbed protein molecules.33 The results are supported by the study of Raymundo et al.25 & Gallegos et al.34 who found that the
values of mayonnaise increased with increasing xanthan gum and oil content in commercial mayonnaise and low-fat oil-in-water emulsions based on different formulations, due to an increase in both viscoelastic functions (i.e., G′ and G″).
Regression models of color parameters (L*, a*, and b* values) : The appearance of salad dressings is very important for consumer acceptability and color has a major impact on perceived appearance. The multiple regression models applied to the L* value (Y6) with R2 of 0.645, 0.696, 0.887, 0.866, and 0.980for dressings prepared with XG, XG-GA, XG-PGA, XG-PE, and XG-GG, respectively, are given by the following equations:
(Eq. 22)
(Eq. 23)
(Eq. 24)
(Eq. 25)
(Eq. 26)
In general, the dressings prepared with XG, XG-PGA, and XG-PE yielded response surface plots similar to that shown in Figure 4A for dressings with XG-GA. The positive coefficients for the two independent variables (x1, x2) in the equation (Eq. 22-25) indicate that the response variable Y6 (L* value) increased with an increase in both variables (oil, x1; and gum, x2). In the case of dressings prepared with XG-GG, as observed in Eq. 26, both the oil (x1) and gum (x2) concentrations individually and the quadratic terms of x1, as well as the interaction terms of x1 and x2,significantly influenced the lightness of the lentil supplemented dressings which explains the difference in the response surface plot (Figure 4B).
Figure 4C-G and Eq. (27-31) present the response surfaces and statistical models of a* values (Y7) for dressings prepared with XG, XG-GA, XG-PGA, XG-PE, and XG-GG, respectively.
(Eq. 27)
(Eq. 28)
(Eq. 29)
(Eq. 30)
(Eq. 31)
In general, the a* value (Y7) increased with oil concentration for dressings with XG (Figure 4C), XG-GA (Figure 4D), XG-PE (Figure 4F), and XG-GG (Figure 4G). The effect of oil on Y7 for the dressing with XG-PGA was quite different (Figure 4E) (i.e., the a* value increased with an increase in oil up to an oil content of 24.7% but decreased afterwards).
The effects of the oil and gum concentrations on b* values (Y8) are shown in Figure 5A & B. The multiple regression equations for dressings prepared with XG-PE and XG-GG are presented below (Eq. 32, and 33, respectively).
(Eq. 32)
(Eq. 33)
The regression equations and the three-dimensional plots for ΔE values (Y9) for dressings prepared with XG-PGA and XG-GG are presented in Eq. (34, 35) and Figure 5C & D respectively.
(Eq. 34)
(Eq. 35)
An increase in oil/gum concentration resulted in higher b* (Y8) values at lower gum/oil content for dressings prepared with XG-PE (Figure 5A). The Y8 values increased with an increase in oil up to an oil content of 21.25% but decreased afterwards for dressings prepared with XG-GG (Figure 5B). An increase in oil content generally yielded greater ΔE value (Y9) for dressings with XG-PGA and XG-GG (Figure 5C & D).
Chroma, which represents the color intensity of samples, gives a better description of the spatial position of the measured color. Figure 5E-H and Eq. (36-39) present the response surfaces and multiple regression equations for chroma (Y10) for dressings prepared with XG-GA, XG-PGA, XG-PE, and XG-GG, respectively.
(Eq. 36)
(Eq. 37)
(Eq. 38)
(Eq. 39)
As can be observed in Figure 5F,G chroma (Y10) increased with oil (x1) and gum (x2) concentrations for dressings with XG-PE and XG-PGA, whereas for dressings prepared with XG-GA the response was solely dependent on oil content (Figure 5E). For dressings with XG-GG (Figure 5H), the effect of oil on chroma (Y10) was different; it increased up to an oil content of 21.25% and then decreased.
Thus, the effect of the gums was complex and varied for different gums and combinations thereof. The color characteristics of an emulsion are the result of interactions between light waves and the emulsion. Color is generally governed by the unique composition and structure of food emulsions, and can be modified by the presence of droplets or other particulate matter.35,36 As reported previously,35,36 the blueness and greenness of an emulsion system are closely related to the droplet size and the droplet concentration of the emulsion system. Due to the interactions that occur between mixed gums and other ingredients, the conformation that the mixed gums adopt will depend on the particular environmental conditions. This may explain the variation observed in the generated three-dimensional plots and the regression models of color parameters for the dressings prepared with different gums.
Regression models of particle size parameters: The significant mathematical models (R2 of 0.935, 0.736, 0.816 and 0.941)of D[3, 2] for dressings prepared with XG, XG-GA, XG-PE, as well as XG-GG, are presented in Eq. 40, 41, 42, and 43, respectively.
(Eq. 40)
(Eq. 41)
(Eq. 42)
(Eq. 43)
The response surface plots (Figure 6) show that an increase in gum concentration generally led to an increase in the Sauter mean diameter D[3,2] (Y11), especially at lower oil concentrations for XG-GA, XG-PE, and XG-GG (Figure 6B-D). Thus, larger droplets formed in response to increased gum concentrations at lower oil contents. A possible explanation for the observed trends is that the increased viscosity induced by the higher gum concentrations may have reduced the efficiency of the homogenization process and led to the formation of larger oil droplets. An increase in oil occurring at a higher gum content yielded lower values of D[3,2]for XG-GA, XG-PE, and XG-GG (Figure 6B-D), while an increased tendency of droplet size with oil content was observed at lower gum concentrations for dressings prepared with XG-PE (Figure 6C). The dressings prepared with XG showed a slightly increased D[3,2] (Y11) with increasing oil concentration particular at higher gum contents, as shown in Figure 6A.
Figure 7A-E and Eq. (44-48) present the three-dimensional plots and multiple regression equations for the volume-weighted mean diameter D[4,3] (Y12), with R2 of 0.828, 0.745, 0.692, 0.952 and 0.819 for dressings prepared with XG, XG-GA, XG-PGA, XG-PE, and XG-GG, respectively.
(Eq. 44)
(Eq. 45)
(Eq. 46)
(Eq. 47)
(Eq. 48)
In general, an increase in oil concentration led to a decrease in D[4,3](Y12), except in the case of the dressing prepared with XG-GG (Figure 7E), which was dependent only on gum content, as evidenced by the single variable regression found between gum concentration (x2) and the response Y12 (Eq. 48).An increasing trend in D[4,3] (Y12) in response to increased gum content, especially at lower oil concentrations for XG-GA, XG-PGA, XG-PE was also observed in Figure 7.
The regression models generated for specific surface area (Y13) with R2 of 0.991, 0.988, 0.972, 0.988, and 0.839 for dressings prepared with XG, XG-GA, XG-PGA, XG-PE, XG-GG are presented in Eq. 49, 50, 51, 52, 53, respectively.
(Eq. 49)
(Eq. 50)
(Eq. 51)
(Eq. 52)
(Eq. 53)
The response surface plots (not shown)for all five dressings showed an increase in response (Y13) with increasing oil (x1) concentration, as well as an increased trend in Y13 with gum content (x2) particularly at higher oil concentrations (x1).
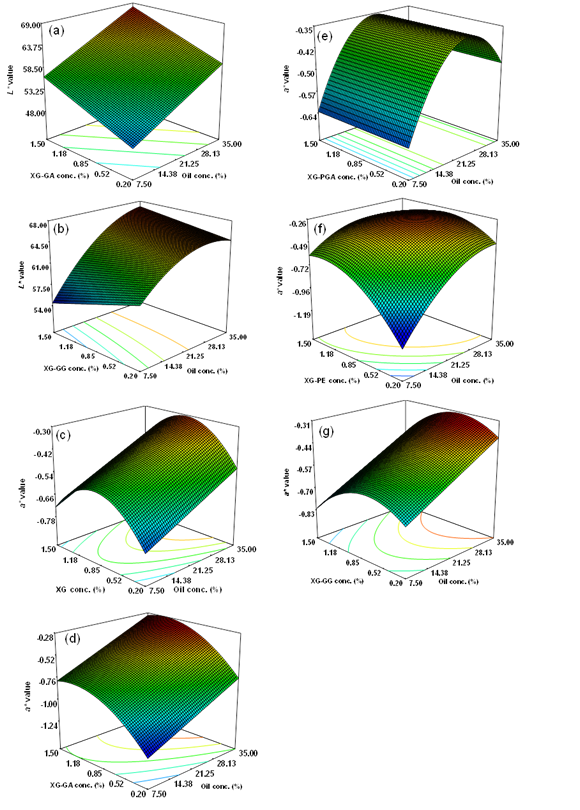
Figure 4 Response surface plots of
- L* value for dressings prepared with xanthan gum-propylene glycol alginate (XG-PGA).
- L* value for dressings prepared with xanthan gum-guar gum (XG-GG).
- a* value for dressings prepared with xanthan gum (XG).
- a* value for dressings prepared with xanthan gum-gum Arabic (XG-GA).
- a* value for dressings prepared with xanthan gum-propylene glycol alginate (XG-PGA).
- a* value for dressings prepared with xanthan gum-pectin (XG-PE).
- a* value for dressings prepared with xanthan gum-guar gum (XG-GG).
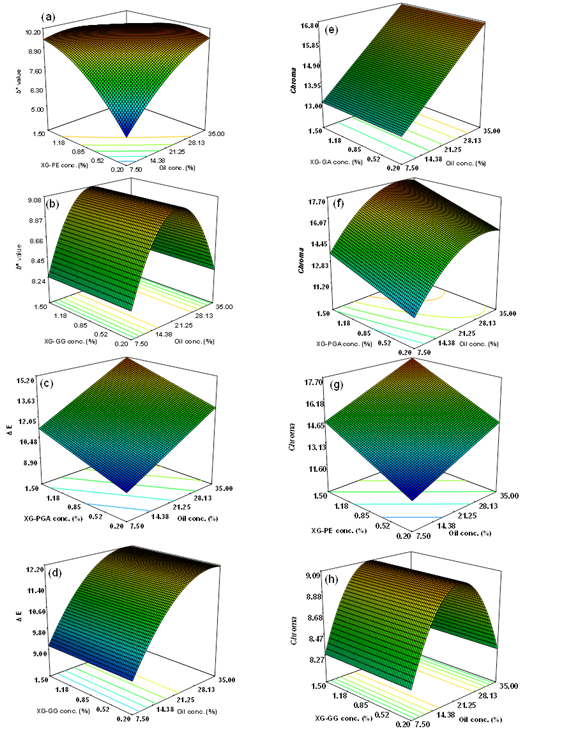
Figure 5 Response surface plots of
- b* value for dressings prepared with xanthan gum-pectin (XG-PE).
- b* value for dressings prepared with xanthan gum-guar gum (XG-GG).
- ΔE value for dressings prepared with xanthan gum-propylene glycol alginate (XG-PGA).
- ΔE value for dressings prepared with xanthan gum-guar gum (XG-GG).
- chroma for dressings prepared with xanthan gum-gum Arabic (XG-GA).
- chroma for dressings prepared with xanthan gum-propylene glycol alginate (XG-PGA).
- chroma for dressings prepared with xanthan gum-pectin (XG-PE).
- chroma for dressings prepared with xanthan gum-guar gum (XG-GG).
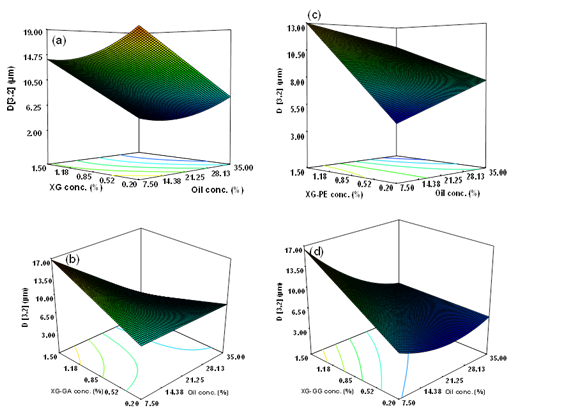
Figure 6 Response surface plots of Sauter diameter D[3,2] for dressings prepared with
- Xanthan gum (XG).
- Xanthan gum-gum Arabic (XG-GA).
- Xanthan gum-pectin (XG-PE).
- Xanthan gum-guar gum (XG-GG).
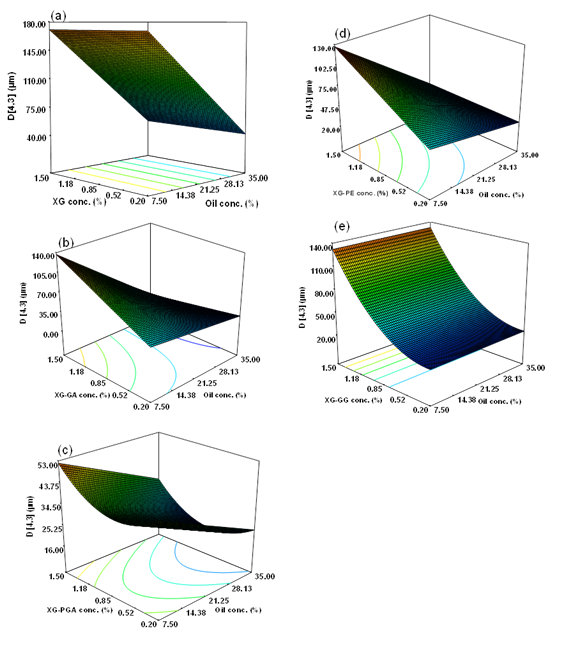
Figure 7 Response surface plots of volume-weighted mean diameter D[4,3] for dressings prepared with
- Xanthan gum (XG).
- Xanthan gum-gum Arabic (XG-GA).
- Xanthan gum-propylene glycol alginate (XG-PGA).
- Xanthan gum-pectin (XG-PE).
- Xanthan gum-guar gum (XG-GG).
Comparison of different gums and gum combinations
Figure 8 compares the responses obtained at the center point of the experimental design (i.e., 21.25% oil and 0.85% gum). As can be seen in Figure 8A, the dressings prepared with XG and XG-GG exhibited the significantly highest m value (viscous nature), followed by XG-PE, and XG-PGA; the lowest m value was obtained for dressings prepared with XG-GA. The observation of the high viscous properties of XG and XG-GG were in accordance with their high pseudoplasticity, as discussed earlier. A previous study37 on pure solutions of the hydrocolloids also reported that XG and GG showed the highest viscous properties (η΄) in a concentration-dependent manner. The synergistic effect of the two polysaccharides (GG and XG) has been reported extensively in earlier studies. Guar gum can change the helix-coil equilibrium of xanthan gum to a more flexible conformation for efficient binding.19 The highly extensive molecular structure and mechanical inflexibility of PGA, as well as potential entanglement with XG, may explain the relatively high viscosity of dressing emulsions formulated with XG-PGA observed in this study.
The dressing prepared with XG showed the highest (P<0.05) volume-weighted mean diameter (D[4,3]), whereas the XG-PGA combination had the lowest D[4,3]value (Figure 8A). For color, no major differences were observed for dressings prepared with the different gum combinations (Figure 8A) except for dressings prepared with XG-PGA and XG-PE which exhibited significantly higher a* value, indicative of a less greener hue (Figure 8B).
Dressings prepared with XG-GA and XG-PGA gave the highest flow behavior index (n) values (P<0.05), indicating that they had the lowest pseudoplasticity. In contrast, the dressings prepared with XG and XG-GG had the lowest n values (Figure 8B). This observation is in agreement with the findings of Pettitt et al.21 & Ahmed et al.6 who reported that the addition of GA and PGA to fixed levels of XG decreased pseudoplasticity, as evidenced by a significantly increased flow index (n). In terms of firmness (Figure 8B), dressings prepared with XG-GG gave the highest (P<0.05) values, followed by dressings with XG, while dressings formulated with XG-GA and XG-PGA had the lowest values (P<0.05). The dressing prepared with XG-PE had an intermediate value.
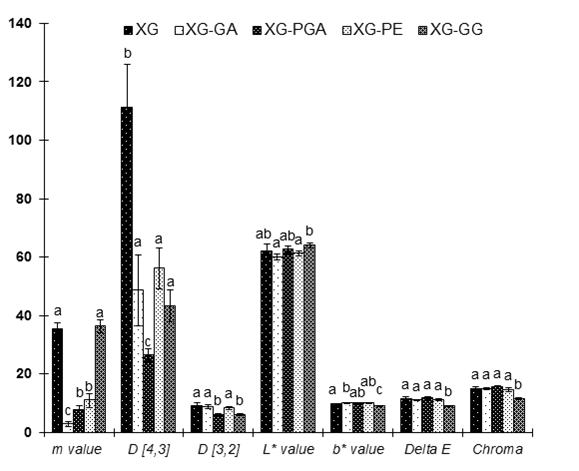
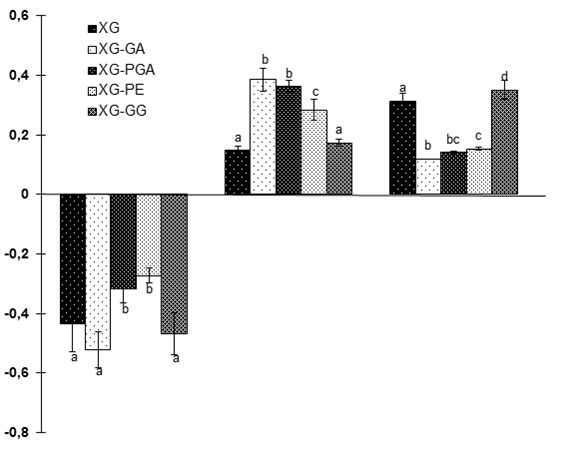
Figure 8 The variation of different responses including
- consistency coefficient (m value), D[4,3], D[3,2], L* value, b* value, Delta E, Chroma, and
- a*value, the flow behavior index (n value), firmness for dressings prepared with different gums based on the combination at the center point of the experimental design (21.25% of oil and 0.85% of gum). The results were the average values of six replications. For each parameter, mean values bearing different letters are significantly different (P<0.05) as per Tukey's multiple comparison test. In the graphic, XG: xanthan gum; XG-GA: xanthan gum-gum Arabic; XG-PGA: xanthan gum-propylene glycol alginate; XG-PE: xanthan gum-pectin; XG-GG: xanthan gum-guar gum.
Optimization and validation tests
A multiple-response optimization was applied within the experimental range of the independent variables studied (x1 and x2). For each response (Y) the mean values for tested commercial dressings were used as “target” as shown in Table 2. An optimum formulation for the composition of lentil supplemented dressing was obtained by superimposing all contour plots with the predicted equations of each response to yield the mean values for each independent variable (x) and the predicted values for each dependent variable (Y). A set of combinations of oil (x1) and gum (x2) concentrations was obtained as presented in Table 2.
Dressings were prepared using the optimized formulations and the responses for these were tested. The adequacy of the response surface models was evaluated by comparing the responses for the predicted values and the experimental values. As can be seen in Table 2, the response values obtained from the validation tests were quite similar to the predicted values for dressing with each gum, except for the experimental values for D[3,2] and D[4,3]which were generally higher than the predicted values. In addition, for dressings prepared with XG-PE, the consistency coefficients (m value) obtained in the validation tests were different from the predicted ones; however, they were very similar to the targeted values. In general, the results showed that the regression models employed to predict the physical properties of the lentil-supplemented salad dressing emulsions were adequate.


