MOJ
eISSN: 2381-182X


Research Article Volume 6 Issue 3
1Department of Biochemistry, Imo State University, Nigeria
2Department of Medical Biochemistry, Imo State University, Nigeria
Correspondence: Paul C Chikezie, Department of Biochemistry, Imo State University, Owerri, Nigeria, Tel 2350000000000
Received: June 18, 2018 | Published: June 25, 2018
Citation: Chikezie PC, Ezeocha BC, Nwankpa P. Changes in hepato-renal tissues biomarkers of alloxan-induced diabetic Wistar rats co-administered monosodium glutamate and ascorbic acid. MOJ Food Process Technol. 2018;6(3):312-317. DOI: 10.15406/mojfpt.2018.06.00181
The present study investigated the capacity of combined administration of monosodium glutamate (MSG) and ascorbic acid to reverse altered hepatorenal functions in Type 1 diabetes mellitus (DM) Wistar rats. Single intra–peritoneal (i.p.) injection of 90 mg/kg body weight (b.w.) of alloxan monohydrate in phosphate buffered saline (pH=7.4) was used to induce DM in the rats. Standard spectrophotometric methods were used to measure hepatorenal biomarkers; namely, serum alanine transaminase (ALT), aspartate transaminase (AST) and alkaline phosphatase (ALP) activities as well as serum total bilirubin, urea and creatinine concentrations. Serum ratios of ALT to AST activities of the experimental rat groups were greater than 1unit and within the range of 1.26–2.69units. Serum ALP activities of the experimental rat groups were within the range of 84.08±12.73–393.33±35.67IU/L. Pattern of lowered serum bilirubin concentrations in treated DM rat groups were in a dose dependent manner. Serum urea concentrations of DM rats co–administered MSG and ascorbic acid greater than 200mg/kg b.w. were significantly lower (p<0.05) than those of other experimental rat groups. The present study showed that co–administration of MSG and ascorbic acid at doses greater than 200mg/kg b.w. ameliorated hepatorenal dysfunction. However, indications showed that the DM rats did not obtained full therapeutic benefits.
Keywords: ascorbic acid, diabetes mellitus, hepatorenal, monosodium glutamate
The liver is the largest visceral organ of homeostasis in vertebrates. The hepatocytes exhibit broad capacity to metabolize diverse biomolecules and inorganic substances as well as carry out storage, immunological and detoxification capabilities. Hepatic enzymes are released into systemic circulation following liver necrosis and therefore, are used as diagnostic indicators for tissue damage.1 Accordingly, elevations in plasma activities of alanine aminotransferase (ALT), aspartate aminotransferase (AST), and alkaline phosphatase (ALP), referred to as non–functional plasma enzymes are diagnostic of hepatic dysfunction.2,3 In addition, several metabolites such as bilirubin, which are of hepatic origin, are useful biomarkers of chronic and acute hepatic diseases.4,5 The kidneys, which are located in the posterior abdominal wall and whose functional units are the nephrons, are physiologically concerned with the removal of toxic metabolites, waste substances and plasma low threshold substances from systemic circulation. Elevation in plasma levels of plasma low threshold substances such as urea and creatinine are indications of compromised renal function.6,7 Studies have shown that good metabolic control is imperative in impeding the progression of diabetic complications like nephropathy and nephritis, which are engendered by prolonged hyperglycemia.8
Diabetes mellitus (DM) is clinically referred to a large group of diseases resulting in hyperglycemia and related metabolic disorders elicited by overwhelming oxidative stress.8,9 Etiological considerations are often used for the classification DM as well as approach to treatment and management schemes for the disease. DM is broadly classified into two groups; insulin dependent DM (Type1DM) and non–insulin dependent DM (Type2DM). The Type1DM is elicited by insulin insufficiency in plasma, whereas Type2DM is as a result of peripheral tissue resistance to insulin action.10 Clinical investigations showed that Type1DM arise from viral or autoimmune destruction of the β–cells of the islet of Langerhans.11 Accordingly, Type1DM patients show presence of auto–antibodies to islet cells in their blood samples or evidence of viral–induced carcinoma following pancreatic biopsy. Type1DM and Type2DM are characterized by low glucose uptake by peripheral tissues, especially the muscle and adipose tissues.11 Epidemiological survey showed that patients suffering from autoimmune mediated DM accounts for about 10–15% of all DM population.8 Current estimates showed that 25% of world population suffers from DM and projection revealed that this statistics will double by 2030.12,13 Genetic causes are, for the most part, implicated in hyperinsulinemia in individuals with obesity and Type2DM.14,15 In the course of time, Type2DM suffers exhibit increased insulin deficiency in plasma, mediated by glucosamine and lipid toxicities to the β–cells of the islets, which often recourse to management strategy of insulin replacement therapy.8 Epidemiological studies revealed that the incidence of DM is on the rise worldwide, in spite of remarkable progress in treatment and preventive strategies against the disease.8 Micro–vascular and macro–vascular complications; namely, retinopathy, nephropathy, neuropathy as well as atherosclerosis and cardiovascular disease are major causes of DM mortality and morbidity.13,16–20 Among several environmental factors associated with DM pathogenesis, adjustments in dietary habits such as increase intake of pro–oxidants containing food substances have been linked to the cause of rapid rising prevalence of DM.
Monosodium glutamate (MSG) is a food additive used as flavour enhancer for variety of Nigerian meals as well as delicacies from other parts of the world. Different market brands of MSG serve to improve the palatability of meals and as such stimulate and enhance appetite.6 Despite reports on toxic outcomes in animal models exposed to MSG and MSG–containing diets,6,21–24 the Food and Drug Administration (FDA) of the United States still consider MSG as safe and as such component of food Generally Recognized as Safe (GRAS).6,22 Accordingly, MSG is permitted as a safe food additive, which is often consumed without specific requisite upper limit to average daily intake.25 It is common knowledge that DM individuals consume variety of delicacies containing MSG, which may also contain multitudes of other food components like ascorbic acids–hydrophilic antioxidant. Alloxan–induced DM rats represent an experimental prototype for Type1DM. The present study investigated the capacity of combined administration of MSG and ascorbic acid to reverse altered hepatorenal functions, using standard biomarkers; serum alanine transaminase (ALT) and aspartate transaminase (AST), alkaline phosphatase (ALP) activities as well as serum total bilirubin, urea and creatinine concentrations, in Type1DM Wister rat models.
Collection and preparation of branded MSG cubes and ascorbic acid tablets
Branded MSG cubes (MSGX17) were purchased from a grocery store located at Relief Market, Owerri, Owerri North Local Government Area (LGA), Imo State, Nigeria. Branded Ascorbic acid tablets (ASCAX17) were purchase from Cympok Pharmacy, Owerri North LGA, Imo State, Nigeria. Separate pulverized samples of MSGX17 and ASCAX17 were prepared using ceramic mortar and pestle.
Portions of the ground samples of MSGX17 and ASCAX17 were mixed in a petri dish in a ratio of 4:1w/w. The mixture was dissolved in phosphate buffered saline (PBS), osmotically equivalent to 100g/L PBS (90.0g NaCI, 17.0 Na2HPO4.2H2O and 2.43g NaH2PO4.2H2O). Appropriate combined doses of MSGX17 and ASCAX17; namely, 50mg/kg, 100mg/kg, 200mg/kg, 400mg/kg, 600mg/kg, 800mg/kg and 1000mg/kg in PBS were prepared and subsequently administered to the rats.
Animal environment, handling and ethics
Thirty six (36) male Wistar rats of body weights (b.w.) between the range of 165.55 and 182.35g were purchased from a commercial animal house in Owerri–North LGA, Imo State, Nigeria. The rats were kept in stainless–steel cages in a well–ventilated room of temperature 28±2°C and relative humidity of 55–65% with a diurnal 12 h light cycle. The rats had access to water and pelletized standard guinea feed (PSGF) (United Africa Company Nigeria Plc., Jos, Nigeria) ad libitum. A period of 2weeks was allowed for acclimatization of the rats to environmental conditions. The present study was approved by the Ethical Committee on the use of animals for research, Department of Biochemistry, Imo State University, Owerri, Nigeria. Handling of the rats was in agreement with the standard guidelines of laboratory animal care of the United States National Institutes of Health (NIH, 1978).
Induction of DM and study design
Experimental model of DM rats was induced by single intra–peritoneal (i.p.) injection of alloxan monohydrate (Sigma, St. Louis, USA) in PBS (pH=7.4) (dose:90mg/kg b.w.). The rats of fasting plasma glucose concentration (FPGC) greater than 5.71mmol/L, measured using Accu–Check Sensor Comfort glucometer (Roche, Mexico City), for 5 consecutive days were considered DM–rats and selected for the study.
The thirty six (36) male Wistar rats were divided into six (6) groups of six (6) rats each. Prior to commencement of treatment, the animals were deprived of PSGF and water for 16h based on previous report.26 The rat groups were grouped according to the treatments received by oral gavage on daily basis for 21days as previously described:27
Collection and preparation of blood samples
At the end of the treatment period of 21days, blood volumes of 3.0mL were drawn from orbital sinus of the rat groups after being deprived of PSGF and water for 12h.28 The blood samples were allowed to clot, after which serum from corresponding rat groups were measured for hepatorenal tissues biomarkers, namely, serum AST, ALT and ALP activities, as well as serum total bilirubin, urea and creatinine concentrations.
Serum AST/ALT
Serum ALT and AST activities were measured using BioMerieux kits (BioMerieux test kits, USA) according to manufacturer’s instructions as previously reported.24
Serum ALP
Measurement of Serum ALP activity was according to the methods of Tietz et al.,29 using Teco Diagnostics Kits (Teco Diagnostics Kits, USA), as previously reported.30
Serum total bilirubin
Serum total bilirubin concentration was measured using bilirubin assay kit (Sigma–Aldrich, Inc., USA) according to manufacturer’s instructions and the principles previously described.4
Serum urea
Serum urea concentration was measured using the methods described by Fawcett & Scott.31
Serum creatinine
Serum creatinine concentration was measured by the methods previously described.32
Statistical analyses
The data collected were analyzed by the analysis of variance procedure while treatment means were separated by the least significance difference (LSD) incorporated in the statistical analysis system (SAS) package of 9.1 version (2006).
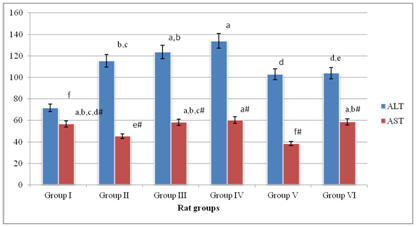
Serum ALT activity of Group II was 1.61 fold greater than that of Group I; p<0.05 (Figure 1). Additionally, serum ALT activity of Group III was not significantly different (p>0.05) from those of Groups (III–VI). Group VI gave serum ALT activities that were significantly lower (p<0.05) than that of Group II. However, Group I gave the lowest serum ALT activity and was significantly lower (p<0.05) than those of Groups (II–VI).
Figure 1 showed that serum AST activity of Group I was not significantly different (p>0.05) from those of Group III, Group IV and Group VI. Furthermore, Group V gave the lowest serum AST activity compared with other experimental rat groups; p<0.05.

Figure 1 Serum AST/ALT activities of experimental rat groups.
Means on the bars with the same letter are not significantly different at p>0.05 according to LSD. Superscripts with # are with respect to serum ALT activity of experimental rat groups
Generally, Table 1 showed that the ratios of serum ALT to AST activities of the experimental rat groups were greater than 1unit and within the range of 1.26–2.69units. Additionally, serum ALT/AST activity of Group I gave the lowest ratio, whereas that of Group V gave the highest value of 2.69units. Also, Table 1 showed that serum ALT to AST activities of the experimental rat groups were in the order: Group V>Group II>Group IV>Group III>Group VI>Group I.
Groups |
Group I |
Group II |
Group III |
Group IV |
Group V |
Group VI |
Ratio: ALT/AST |
1.26 |
2.54 |
2.12 |
2.22 |
2.69 |
1.77 |
Table 1 Ratios of serum ALT to AST activities of experimental rat groups
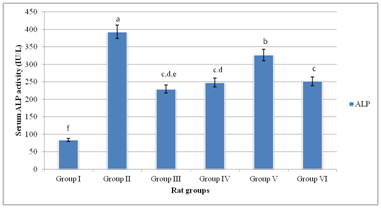
Figure 2 showed that serum ALP activity of the experimental rat groups were within the range of 84.08±12.73–393.33±35.67IU/L. Group II gave the highest serum ALP activity, which was significantly different (p<0.05) from other experimental rat groups. Conversely, Group I gave the lowest serum ALP activity. Serum ALP activities of Groups (III–VI) were significantly higher (p<0.05) than that of Group I. Finally, serum ALP activities of Group III, Group IV and Group VI were comparable; p>0.05.

Figure 2 Serum ALP activity of experimental rat groups.
Means on the bars with the same letter are not significantly different at p>0.05 according to LSD
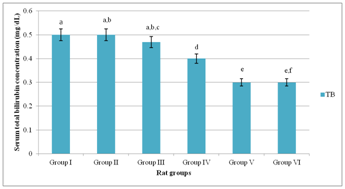
Figure 3 showed that serum total bilirubin concentrations of Groups (I–III) were comparable; p>0.05. Conversely, serum total bilirubin concentrations Groups (IV–VI) were significantly lower (p<0.05) than those of Groups (I–III). Serum total bilirubin concentration of Group V was not significantly lower (p<0.05) than that of Group VI.
Serum urea concentrations of Group I, Group II and Group IV showed no significant difference; p>0.05 (Figure 4). However, serum urea concentration of Group III was significantly higher (p<0.05) than those of Group I and Group II. Similarly, serum urea concentration of Group V was significantly lower (p<0.05) than that of Group II. An overview of Figure 3 showed that lowered serum bilirubin concentrations in Groups (III–VI) were in a dose dependent manner.

Figure 3 Serum total bilirubin concentration of experimental rat groups.
Means on the bars with the same letter are not significantly different at p>0.05 according to LSD
Figure 4 showed that serum creatinine concentrations of Group I and Groups (IV–VI) exhibited no significant difference; p>0.05. Conversely, serum creatinine concentration of Group III was significantly lower (p<0.05) than those of other experimental rat groups. Serum urea concentrations of Group V and Group VI were significantly lower (p<0.05) than those of Groups (I–IV).
Previous studies showed that MSG induced oxidative stress, hepatotoxicity and impaired insulin secretion by islet cells of normal and obese animal models.2,33 Specifically, chronic administration of MSG up to 4g/kg b.w. induced oxidative stress in experimental animals due to metabolic shifting and hepatic and cardiac tissues are for the most part adversely affected.34–36 Additionally, evidence from previous studies showed that MSG altered serum lipid profile, and therefore elicited metabolic syndromes in experimental animals.37,38 Conversely, antioxidant actions of ascorbic acid have been severally reported elsewhere.39,40 In conformity with previous reports, elevated hepatic biomarker enzymes, in which level of serum ALT activity was greater than that of serum AST activity was an obvious indication of hepatotoxic outcomes in the DM rats.2,3,7,24 The present study showed that co–administration of relatively low doses (50mg/kg b.w. and 100mg/kg b.w.) of MSG and ascorbic acid did not ameliorate hepatotoxicity. Rather, assessment in serum of hepatic marker enzymes revealed that co–administration of relatively low doses of MSG and ascorbic acid exacerbated hepatotoxicity, which was indicative of serum ALT to AST activities ratios greater than 2.00 units in Group III and Group IV as previously described.7,41–43 Conversely, co–administration of relatively high doses (>200mg/kg b.w.) of MSG and ascorbic acid ameliorated hepatotoxicity as typified by comparatively lowered levels of serum AST/ALT activities of Group V and Group VI. Specifically, serum AST/ALT activity ratio of Group VI, which was less than 2.00 units, was indicative of reversal of hepatotoxicity in the experimental rat group.7,24 Because MSG–induced toxicity is associated with generation of overwhelming levels of reactive oxygen species (ROS) with corresponding reduction in cellular antioxidant activities,2 the findings of the present study appeared to suggest that co–administration of relatively high dose of ascorbic acid with MSG neutralized the toxic outcomes associated with MSG intake in DM rats. Likewise, reduction in levels of serum ALP activities of DM rat groups following co–administration of relatively high doses of MSG and ascorbic acid corroborated the ameliorative action of ascorbic acid against hepatic injuries induced by MSG in DM rats.6 In a related study, serum ALP activity was used as indicator for assessing modulatory potentials of aqueous stem bark extract of Mangifera indica to reverse hepatic injuries in carbon tetrachloride–induced hepatotoxicity in rats.30
The present study showed no evidence of hyperbilirubinemia in DM rat groups co–administered MSG and ascorbic acid. Serum total bilirubin concentration greater than 1.0mg/dL is diagnostic of hyperbilirubinemia.5,44
Hyperbilirubinemia is, for the most part, elicited by rapid haemolysis with or without hepatobiliary obstruction, in which the rate of hepatic production of bilirubin far exceeds the capacity of the hepatocytes to conjugate bilirubin with resultant interference in excretion of bilirubin in the bile.5 The present findings indicated that co–administration of MSG and ascorbic acid caused reduction in serum total bilirubin concentration in a dose dependent manner in DM rats. By implication, reduction in serum total bilirubin concentration in DM rats co–administered MSG and ascorbic acid was as a result of dose dependent antioxidant property of ascorbic acid, which protected the erythrocyte against exacerbated MSG–induced oxidative haemolysis. The pattern of serum urea and creatinine concentrations of DM rats, within the 21days treatment period, showed no evidence that intake of MSG and ascorbic acid caused substantial renal dysfunction in the experimental rat groups.
Generally, the findings of the present study were comparable to previous reports of Seiva et al.,45 in which they noted that administration of MSG–quercetin combination ameliorated glucose and lipid metabolic disorders in post–natal MSG–induced metabolic altered rats. The polyphenolic flavonoid–quercetin was implicated, by virtue of its antioxidant property,46 to be responsible for the reversal of toxic effects of MSG on the experimental rats.
The present findings appeared to suggest that intake of ascorbic acid with MSG minimized dysfunctional status of hepatorenal tissues in Type1DM. Precisely, the present study showed that co–administration of MSG and ascorbic acid at doses greater than 200mg/kg b.w. ameliorated hepatorenal dysfunction. However, indications showed that the DM rats did not obtained full therapeutic benefits.
None
The authors hereby, declare that there is no conflict of interest in publishing this article.

©2018 Chikezie, et al. This is an open access article distributed under the terms of the, which permits unrestricted use, distribution, and build upon your work non-commercially.