Journal of
eISSN: 2373-4310


Research Article Volume 8 Issue 2
University of Guelph, Canada
Correspondence: HJ Swatland, Designation Professor Emeritus, University of Guelph, 33 Robinson Ave, Guelph, Ontario N1H 2Y8, Canada, Tel 519-821-7513
Received: August 23, 2017 | Published: March 14, 2018
Citation: Swatland H. Iridescence in cooked venison – an optical phenomenon. J Nutr Health Food Eng. 2018;8(2):105 – 108. DOI: 10.15406/jnhfe.2018.08.00264
Iridescence in single myofibers from roast venison resembled multilayer interference in having multiple spectral peaks that were easily visible under water. The relationship of iridescence to light scattering in roast venison was explored using the weighted-ordinate method of colorimetry. In iridescent myofibers, a reflectance ratio (400/700 nm) showing wavelength-dependent light scattering was correlated with CIE (Commission International de l’Éclairage) Y%, a measure of overall paleness (r=0.48, P< 0.01). Hence, meat iridescence is an optical phenomenon. The underlying mechanism, subsurface multilayer interference, may be important for meat colorimetry.
Keywords: venison, iridescence, interference, reflectance, meat color
Iridescence is an enigmatic aspect of meat color with some practical importance for consumers concerned about green colors in meat.1–4 The iridescent colors of meat look very much like interference colors but what causes the interference? Perhaps iridescence originates from refraction due to the different refractive indices of water and fat at the surface;5 or perhaps it is caused by surface diffraction from myofibrillar serrations;6 or even pigments.7 The diffraction theory seems to be the most widely accepted explanation of meat iridescence, judging from current Wikipedia entries and internet authors, but can soft myofibrillar serrations still act as diffraction gratings when tightly compressed by a packaging film? A critical test of the surface diffraction hypothesis of meat iridescence may be gained from reading the classic work that started the whole field of microscopy, Robert Hooke’s Micrographia published in 1665.8 Hooke discovered that the iridescent colors of peacock feathers were caused surface diffraction and, thus, disappeared when feathers were wetted and examined under water. But Hooke also discovered that the iridescence of minerals such as muscovite (then called Muscovy glass) caused by subsurface multilayer interference, persisted under water. If the surface diffraction hypothesis of meat iridescence is correct then iridescence should be lost under water, but if meat iridescence persists under water then this would favor subsurface multilayer interference as the cause.
The multilayer interference of meat might originate from sarcomeres reflecting incident light at refractive index boundaries (A-band > I-band), with light reflected from lower sarcomeres having a longer light path than light reflected from upper sarcomeres. Thus, light waves following long light paths would be out of phase with waves following short paths, so creating destructive and constructive interference. The optical basis of multilayer interference in iridescent minerals has been known for many, but there has been little interest in interference colorimetry – measuring our perception of iridescence. White chalk illuminated with sunlight reflects a broad spectrum of wavelengths which our tristimulus color vision interprets as white. But a white area on your computer screen is really an area of three balanced pixel hues that have tricked your eyes to appear white; and when we perceive interference colors, complex interference spectra trick our eyes again. As the order of interference increases, the colors appear to change from metallic sheens to misty pastels, but the hues are repeated in a regular sequence. What can the weighted ordinate method of colorimetry tell us about iridescence and light scattering in cooked meat using venison as the example?
Apparatus
A Zeiss Universal microscope (Carl Zeiss, D-7082 Oberkochen, Germany) was fitted with accessories identified here by a Zeiss part number. The microscope was operated from a type MPC 64 control module (Zeiss 477469) on a bus (IEEE 488). The photomultiplier was a side-window Hamamatsu (1126 Ichino-Cho, Hamamatsu City, Japan) HTV R 928 with S-20 characteristics operated as described in Zeiss bulletin G-41-9000.1/ll-e. A grating monochromator (Zeiss 474345) with stray-light filters (Zeiss 477215) was mounted under the photomultiplier and scanned from 400 to 700 nm in steps of 10 nm with a 10 nm band-pass. Illumination was from a 100 W halogen source with a stabilized power supply (Hewlett-Packard 6642A) directed through a solenoid shutter and into a vertical illuminator (Zeiss II-C with H-PL-POL beam splitter). The photometer head was a type 03 (Zeiss 477304). The microscope objectives were long-distance Epiplan for reflected light (no cover slip) . To allow for a depth of water over samples, the objective was × 4, NA 0.01 (Figures 1–3). Other measurements were made with × 16, NA 0.30 (Figure 4) (Figure 5). The system was standardized on Teflon tape (polytetrafluoroethylene; Weidner & Hsia, 1981) at fractions of the dynamic range of the photomultiplier, knowing that constructive interference might exceed Teflon reflectance.
Samples
Sirloin samples from whitetail deer (Odocoileus virginianus) was roasted to a well done state (perimysium gelatinized) and 2-mm sections of gluteus medius were cut across the grain with a scalpel blade. Sarcomere length was 1.45±0.14 μm, n = 100. Measurements were made by microscopy on several iridescent muscle fasciculi macerated in distilled water using a blender.
Colorimetry
Color measurement by the CIE system (Commission International de l’Éclairage or International Commission on Illumination) is tightly controlled by aperture size, angle of illumination, and the emission spectrum of the illuminat. But the CIE system may still use the basic principle of the weighted ordinate method, which is to weight each wavelength in a spectrum by its response in the human eye, as first determined in 1931. The CIE system has continued to evolve, mainly in response to the difficulty of measuring white paper and ceramics under the white light of evolving emission sources, with manufacturers adding various fluorescent substances to enhance whiteness. But the basic 1931 weighted-ordinate method is still applicable to other applications, such as microscopy, although the resulting chromaticity coordinates may differ slightly from those made with a controlled aperture size, viewing angle and emission spectrum illumination.
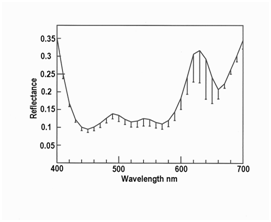
The iridescence of cooked venison myofibers was visible under water (Figure 1), thus favoring subsurface multilayer interference as the cause, not surface diffraction.
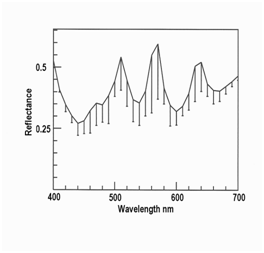
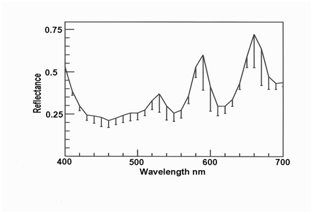
Figure 2–4 show orange, green and yellow iridescence in myofibers in roast venison measured at a higher magnification than before (where low magnification was required to allow water over samples). The reflectance of violet light at 400 nm was high in all three cases because light scattering in meat is a function of wavelength, such that light at 400 nm is highly scattered back to the illuminated surface, while red light at 700 nm tends to penetrate deeply into the meat and becomes trapped. Hence, with transmitted light, transmittance through meat is low at 400 nm while transmittance at 700 nm is high. But with reflected light, as measured here, reflectance at 400 nm was high because of high scattering. The other shared feature in Figures 2–4 is the presence of three peaks, averaging at 510, 580 and 660 nm, as shown for the pooled data in Figure 5 (10 orange myofibers + 10 green myofiberss + 10 yellow myofibers). The error bars are misleading because the peaks in the source data were not all at the same wavelengths, nor were the peaks for individual colors. In other words, two myofibers might be judged as orange myofibers, but might have peaks at slightly different wavelengths. The reason to show Figure 5 is to make the point that this spectrum is nothing like an interference spectrum created using polarized light, where the peaks are close together at a low wavelength.

Figure 1 Orange iridescence in myofibers of roast venison still visible under water (n = 5 myoibers for each line (only different at 670 nm, P < 0.001, 2 tailed t-test, with wet > dry).

Figure 1 Orange iridescence in myofibers of roast venison still visible under water (n = 5 myoibers for each line (only different at 670 nm, P < 0.001, 2 tailed t-test, with wet > dry).

Figure 3 Green iridescence in myofibers of roast venison (mean, n = 10, with standard deviations as error bars).

Figure 4 Yellow iridescence in myofibers of roast venison (mean, n = 10, with standard deviations as error bars).
Chromaticity coordinates for the three colors of iridescence in single myofibers are shown in Table 1, where reference to a CIE color chart will show all three colours were nearing the equal energy white area near the center of the chart, in other words, all three had a high level of scattering as shown by the 400/700 nm ratio in Table 1. For the pooled data (Figure 5), the 400/700 nm ratio was correlated with Y%, r = 0.48 (P< 0.01, with n = 30 and 2 tails). Thus, with high wavelength-dependent scattering (high 400/700 nm ratio), the overall measure of reflectance intensity (CIE Y%) was high to give a positive correlation coefficient. In other words, a relationship between iridescence and scattering was detected
Iridescence |
CIE x |
CIE y |
CIE Y% |
400/700 nm |
Orange |
0.402±0.015 |
0.332±0.006 |
14.76 ±1.83 |
1.02±0.05 |
Green |
0.347±0.018 |
0.370±0.019 |
42.82±4.82 |
1.13±0.07 |
Yellow |
0.385±0.007 |
0.364±0.005 |
35.63±6.45 |
1.21±0.07 |
Table 1 Chromaticity coordinates for three colors of iridescent myofibers
To function effectively as reflective boundaries within a myofiber, it is necessary for individual myofibrils to be in register across the myofiber, that is, with all the A bands level across the myofiber. When an animal is slaughtered and living muscle is converted to meat, the development of rigor mortis may vary from myofiber to myofiber. Some histochemical myofiber types are loaded with glycogen, while others have very little, thus leading to different patterns of post-mortem glycolysis.9 Myofibers with low glycogen are the first to develop rigor mortis, which is usually accompanied by a weak contraction that disrupts the alignment of adjacent myofibers which are then kinked, thus losing reflective A band alignment. The sporadic occurrence of iridescence in meat may depend upon simultaneous development of rigor mortis in a group of myofibers so that they maintain their original a band register. In living muscle, the alignment of A bands within a myofiber, and often between adjacent myofibers is maintained by the cytoskeleton but sarcomere alignment may be disrupted by the development of rigor mortis.10,11
Color changes in roast meat are quite complex. At the surface of the roast, several dark pigments derived from myoglobin may be created, such as denatured globin nicotinamide hemichromes,12 denatured myoglobin,13 Maillard reaction products,14 metmyochromogen15 and haematin di-imadazole complexes,16 probably depending on the atmosphere within the oven, with gas ovens creating a far more complex atmosphere than electric ovens. But deep within a roast, the primary change is an increase in light scattering caused by denaturation of sarcoplasmic proteins, much as transparent egg albumin turns white when cooked. A and I bands withstand heating quite well and retain their birefringence,17 so there is no reason to suspect they lose their reflectivity, thus giving rise to iridescence under certain conditions.
It is possible that interference from a band reflectance is a major cause of light scattering along myofibers, remembering that meat is optically anisotropic with different properties along versus across myofibers. Interference along myofibers may explain why reflectance is sometimes correlated with sarcomere length.18 Thus, iridescence may be a special case of light scattering in the long axis of myofibers. The practical importance of longitudinal scattering is that it may frustrate attempts to predict meat tenderness from optical measurements. On one hand, low pH may increase light scattering in tender meat while, on the other hand, short sarcomeres in tough meat may also increase light scattering. In samples with a similar pH, high scattering from short sarcomeres may predict toughness, but in samples with similar sarcomere lengths low scattering may predict toughness. Dealing with optical anisotropy in meat may be the key to making optical predictions of meat toughness more reliable in samples with a range in both pH and sarcomere length.
Author declares no acknowledgment.
None – unfunded research prompted by scientific curiosity.

©2018 Swatland. This is an open access article distributed under the terms of the, which permits unrestricted use, distribution, and build upon your work non-commercially.