Journal of
eISSN: 2373-4310


Research Article Volume 8 Issue 5
Masters of Science in Food and Nutrition, Dhaka University, Bangladesh
Correspondence: Refat Mahtarin, Masters of Science in Food and Nutrition, Home Economics College, Dhaka University, Bangladesh
Received: August 30, 2018 | Published: September 5, 2018
Citation: Mahtarin R, Ahmed N, Anmona W. Fatty foods and calorie intake of cardiovascular patients. J Nutr Health Food Eng. 2018;8(5):330-333. DOI: 10.15406/jnhfe.2018.08.00290
Background: Cardiovascular diseases are rapidly spreading almost all parts of the planet. Faulty food habit, high calorie intake and sedentary life style are responsible for this gloomy picture.
Objective: To observe the effect of fatty foods and calorie intake on cardiovascular patients was aim of this study.
Material and methods: This cross-sectional observational study was undertaken among 100 cardiovascular patients of 25-79years old in different selected areas in the Dhaka city during the period of August 2015 to January 2016.
Results: About 15.7% respondents removed visible fat of meat and 84.3% didn’t remove visible fat. Moreover 47.1% respondents consumed oily foods about 2-3 times a day. Data shows 19.8% were in best LDL range, 41.6% were in near optimal range, 28.7% were in borderline high range, 8.9% were in high range and 1% were in very high range. Result shows 13.9% were in desirable TG range, 48.5% were in borderline high range, 37.6% were in high range. About 7% had taken below 1200 kcal followed by 1200-1499 kcal 24.8%, 1500-1799 kcal 29.7% and 1800-2099kcal 16.8%.
Conclusion: LDL and TG intake are still high among study subjects. Health awareness programme can be constituted immediately.
Keywords: fatty foods, calorie intake, cardiovascular patients
Death due to cardiovascular diseases (CVDs) is high (80%) in low and middle-income countries.1 Food habit, food system and policy solution are changing globally.1 Besides diet is considered as major factor in order to rising tendency of non-communicable diseases particularly CVD components.2 Poor quality diets are high in refined grains and added sugars, salt, unhealthy fats and animal-source foods; and low in whole grains, fruits, vegetables, legumes, fish and nuts. They are often high in processed food products – typically packaged and often ready to consume – and light on whole foods and freshly-prepared dishes. According to the American Heart Association one adult should consume a low-fat diet of 55% of total calories from carbohydrates, 30% from fat, and 15% from protein, with cholesterol restricted to <300mg/day to prevent cardiovascular diseases risk.3 This paper is an attempt to explore fatty foods and calorie consumption among cardiovascular patients.
It was a cross sectional observational study carried out among 100 cardiovascular patients of 25-79 years old in different selected areas in the Dhaka city during the period of August 2015 to January 2016. The study subjects were from National Institute of Cardiovascular Diseases and Shaheed Suhrawardy Medical College Hospital after approval of institutional heads.
Development of tools
Development of the questionnaire: A semi-structured questionnaire was developed to collect data through face-to-face interview with the respondents. This questionnaire was developed to obtain the recent information regarding the personal information, household information, socio-economic information.
Assessment of fat and calorie rich dietary intake
Data verification: Questionnaires were checked each day after interviewing and again these were carefully checked after completion of all data collection and coded before entering into the computer. The data was edited if there was any discrepancy (double entry, wrong entry etc).
Statistical analysis: All of the statistical analysis and other data processing were done by using SPSS 20 Windows Program. For tabular, charts and graphical representation Microsoft Word and Microsoft Excel were used.
Ethical implication: No data or any information was collected without permission of the patient. Participation in this research was fully voluntary. The respondents were remained entirely free to withdraw their participation at any stage or at any time of the study. Written informed consent was taken from each patient. Prior to consent they were explained the aim and purpose of the research. Confidentiality was assured and anonymity was maintained; no participants were identified in any report or publication under this study.
(Table 1-6) and (Figures 1-8)
Age group (Years) |
Frequency |
Percentage |
25-29 |
7 |
7 |
30-45 |
32 |
32 |
46-65 |
51 |
51 |
66-80 |
10 |
10 |
Total |
100 |
100 |
Table 1 Age distribution of the study population (n=100)
It shows that half of the respondents belonged to 46-65years of age followed by 32% from 30-45years, 10% from 66-80years and 7% from 25-29years.
Category |
Frequency |
Percentage |
Male |
87 |
87 |
Female |
13 |
13 |
Total |
100 |
100 |
Table 2 Distribution of the population by gender (n=100)
It shows that 87% of the respondents were male and 13% were female.
Category |
Frequency |
Percentage |
Labor |
25 |
25 |
Business |
15 |
15 |
Garments worker |
4 |
4 |
Retired |
8 |
8 |
Service holder |
18 |
18 |
Housewife |
13 |
13 |
Teacher |
14 |
14 |
Student |
3 |
3 |
Total |
100 |
100 |
Table 3 Distribution of the population by occupation (n=100)
Table 3 shows that labor, service holder, business, teacher and housewife were 25%, 18%, 15%, 14% and 13% respectively.
Category |
Frequency |
Percentage |
Below SSC |
23 |
23 |
SSC |
21 |
21 |
HSC |
17 |
17 |
Graduate |
20 |
20 |
Post-graduate |
19 |
19 |
Total |
100 |
100 |
Table 4 Distribution of the population by educational qualification (n=100)
This table shows the educational qualification of the respondents. It was found that 23% of the study population had educational qualification below SSC followed by 21% SSC, 17% HSC, 20% Graduate and 19% post-graduate.
Category in BDT |
Frequency |
Percentage |
<10000 |
15 |
15 |
10000-20000 |
33 |
33 |
21000-35000 |
40 |
40 |
>36000 |
12 |
12 |
Total |
100 |
100 |
Table 5 Distribution of the population by income (n=100)
The table 5 shows that 15% respondents had monthly income below 10000 BDT followed by 33% had 10000-20000 BDT, 40% had 21000-35000 BDT and 12% had >36000 BDT as well.
Fat consumption range (%) |
Frequency |
No. of people suffering from heart disease |
Percentage of people suffering from heart disease |
≥30 |
56 |
31 |
54.36 |
<30 |
44 |
24 |
50.54 |
Table 6 Fatty foods intake and heart diseases
About 54.36% consumed ≥30 percent fat and suffered from heart diseases whereas ≤ 30 percent consumed fat respondents had 50.54 percent Heart Diseases.
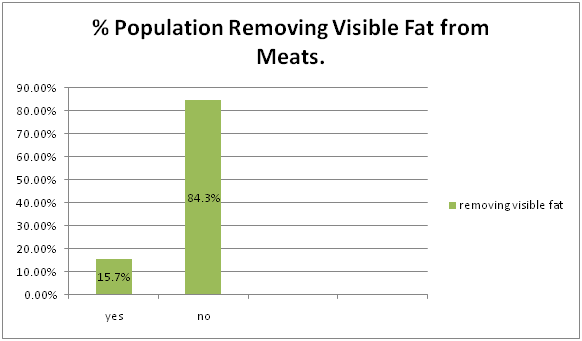
Figure 1 Distribution of participants by removing visible fat of meat or chicken (n=100).
Figure shows 15.7% respondents removed visible fat of meat and 84.3% didn’t remove visible fat.
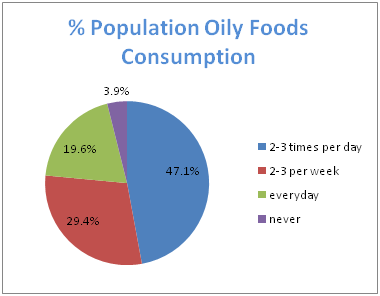
Figure 2 Distribution of participants by consuming oily foods (n=100).
This pie chart shows 47.1% respondents consumed oily foods about 2-3 times a day, 29.4% consumed 2-3 times per week, 19.6% consumed every day and 3.9% never consumed.
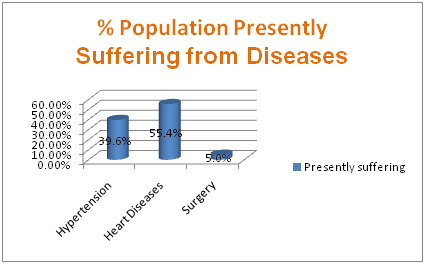
Figure 3 Distribution of participants by suffering from what presently (n=100).
Data represented in above figure shows 39.6% respondents suffered from hypertension, 55.4% heart diseases and 5.0% surgical procedure.
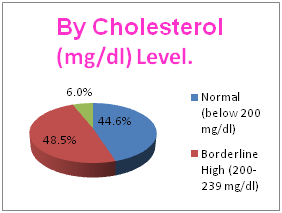
Figure 4 Distribution of participants by Cholesterol (n=100).
Figure shows 44.6% respondents were in normal cholesterol range, 48.5% were in borderline high cholesterol range and 6% were in high cholesterol range.
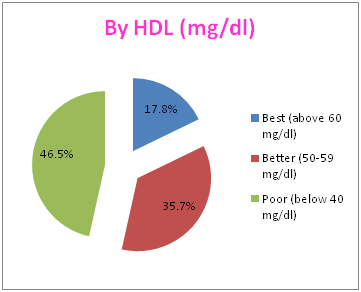
Figure 5 Distribution of participants by HDL (n=100).
Data represented in above figure shows 17.8% respondents were in best HDL range, 35.7% were in better HDL range and 46.5% were in poor range.
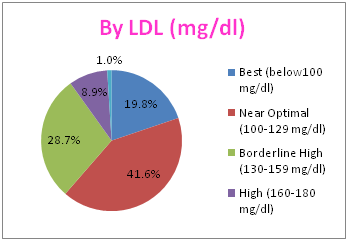
Figure 6 Distribution of participants by LDL (n=100).
Data represented in above figure shows 19.8% were in best LDL range, 41.6% were in near optimal range, 8.7% were in borderline high range, 8.9% were in high range and 1% were in very high range.
The way people eat has changed greatly across the globe; moreover the tendency of change in is quickening in low and middle-income countries. Bangladesh is not escaped from this changing pattern which results full of bed occupancy in cardiovascular hospitals. Evidence suggests that snacking and snack foods have grown in frequency and number;4–9 eating frequency has increased; away-from-home-eating in restaurants, in fast food outlets, and from take-out meals is increasing dramatically in low and middle-income countries; both at home and away-from-home-eating increasingly involve fried and processed food;10 and the overall proportion of highly processed food in diets has grown.11,12 In our day to day life we observe this scenario. Technology dependent life style makes this situation more vivid and complex. The present study found that about one-sixth respondents removed visible fat of meat whereas nearly half of the respondents consumed oily foods about 2-3 times a day. LDL and TG intake are still high among study subjects. Research shows that at very low levels of intake animal food consumption may not induce harm, providing high quality protein and iron, whereas excess animal food intake in high income countries may be linked to adverse health outcomes, particularly from processed meats.13 Meat consumption has increased considerably worldwide.14 But what about in our country; needs up-to-date data. It is evident based that high consumption of vegetables (leafy and non-leafy) and fruits reduces chronic heart diseases as well as stroke.15 We know that vegetable oils appear to reduce chronic heart disease risk. If we replace saturated fat with monounsaturated or polyunsaturated fat which in turn reduces low-density lipoprotein cholesterol and preserves high-density lipoprotein cholesterol.16 Trans-fatty acids increase CHD risk compared with other macronutrients, with strong evidence of adverse effects of small amounts of trans-fats on lipids and CVD risk.17–19
Intake of low-density lipoprotein and triglyceride is still high among study subjects. Health awareness programme can be constituted immediately to prevent fatty foods and calorie intake related risk factors of cardiovascular diseases.
None.
The author declares that there is no conflict of interest.

©2018 Mahtarin, et al. This is an open access article distributed under the terms of the, which permits unrestricted use, distribution, and build upon your work non-commercially.