Journal of
eISSN: 2373-633X


Research Article Volume 5 Issue 6
Department of Public Health, California State University, USA
Correspondence: Jaymin Kwon, Department of Public Health, California State University, Fresno, 2345 San Ramon Ave, MS MH30, Fresno California, USA, Tel 559-278-5169, Fax 559-278-4014
Received: September 01, 2016 | Published: September 27, 2016
Citation: Kwon J. Assessment of inhalation exposures to traffic related air pollutants in public transportation and cancer risk.J Cancer Prev Curr Res. 2016;5(6):360‒365. DOI: 10.15406/jcpcr.2016.05.00182
Personal exposures to air pollutants are significantly influenced by indoor and transportation environments. This study measured personal exposures to volatile organic compounds (VOCs), fine particulate matter (PM2.5), and ultrafine particles (UFP) in residential, work, and in-vehicle air along with GPS tracking of vehicle rides, in the Houston area. A three-hour period of concurrent measurements in the three microenvironments was repeated twice a day for five consecutive weekdays in May 2010. The investigator carried sampling devices on buses for three consecutive trips of approximately 1hour each between a suburban Park and Ride stop and the centrally-located Texas Medical Center (TMC). VOCs were collected both actively and passively, then analyzed using GC-MS. PM2.5 mass concentrations were measured with portable real-time monitors (TSI Inc.) for three hour periods, and gravimetric methods for cumulative sampling periods of 30hours. The VOC concentrations in work indoor air were significantly lower than the levels measured in-vehicle, except for toluene and n-pentane. The VOCs with significantly (p<0.05) higher in-vehicle than work indoor air concentrations were 1,3-butadiene, chloroform, trichloroethylene, tetrachloroethylene, p-dichlorobenzene, and eleven additional target VOCs, but not benzene. Benzene levels were not significantly different by location. Cumulative cancer risks (CCRs) estimated from the subset of carcinogenic VOCs for in-vehicle exposures was highest compared to CCRs estimated for residential or work indoor levels. In-vehicle exposures were higher than indoor levels in home or work for PM2.5. UFP levels were elevated significantly when combustion occurred in the home and near congested traffic or diesel vehicles.
Keywords: inhalation exposure, volatile organic compounds, cancer risk, microenvironment, traffic
CCRs, cumulative cancer risks; ETs, environmental tobacco smoking; Haps, hazardous air pollutants; HEATS, Houston exposure to air toxics study; OVM, organic vapor monitor (3M™); PAHs, polycyclic aromatic hydrocarbons; PM2.5, particles less than 2.5micrometers in diameter, fine particulate matter; RIOPA, relationship among indoor, outdoor, and personal air study; TEAM Study, total exposure assessment methodology study; UFP, ultrafine particles, PM0.1; VOCs, volatile organic compounds
Exposure to mixture of air pollutants is unavoidable in daily life in modern urban areas for most of general population. Massive use of fossil fuels for energy generation and transportation increases individual exposure to volatile organic compounds (VOCs) that evaporated from the gasoline and other primary pollutants directly emitted from the traffic such as PM2.5, black carbon, elemental carbons, and polycyclic aromatic hydrocarbons (PAHs), which often included in smaller proportion of particles, ultrafine particles (UFP, PM0.1).1–4 Due to the adverse health effects including leukemia and other cancers, and irritation of mucous membranes and allergy, many VOCs are listed as hazardous air pollutants (HAPS) in Clean Air Act of United States.5–8 Exposure assessment studies on general population conducted in U.S. identified emission sources of VOCs and PM2.5 in indoor and ambient air in different microenvironments and contributing personal activities.9–11 The Total Exposure Assessment Methodology (TEAM) study found personal exposures are more attributable to small source close to people, commonly found in doors such as environmental tobacco smoke (ETS), incomplete combustion from fireplaces, cooking, and showers.11 Relationship among indoor, outdoor, and personal air (RIOPA) study explored indoor and outdoor source contributions to personal exposure using residential air exchange in three U.S. urban areas, Elizabeth New Jersey, Houston Texas, and Los Angeles County California. The RIOPA study found the indoor and outdoor contribution varied by chemical species and seasonal variation of areas due to regional differences in the air exchange rates.12–14 RIOPA study reported majority of gasoline derived VOCs and traffic emitted PM2.5 components, such as elemental carbon and particle bound PAHs are contributed by ambient emission sources especially close proximity to such emission increase the residential outdoor concentrations significantly higher, 2 to 80 fold higher compared to urban background levels while the residential concentrations are modified by meteorological conditions.4,15–17 The Houston Exposure to Air Toxics Study (HEATS) compared personal exposure in two socioeconomically similar areas In Houston Texas, with different in number of industrial emission sources, found the fixed monitoring site concentrations could not predict residential concentrations and resulting personal exposure to air toxics.18 The major objective of this study was to evaluate the exposures to in-vehicle air of the Houston METRO public transportation system during commuting by sampling air pollutants and comparing the measurements with exposures in other indoor microenvironments. Potential target occupational groups were public transportation vehicle operators, taxi drivers, office workers, and housewives. The following hypotheses were addressed in this study: 1. The concentrations of air pollutants measured in-vehicle are significantly different than the concentrations measured in either residential or work indoor environments. 2. The composition of VOCs and PM2.5 components in-vehicle are significantly different than the compositions measured in either residential or work indoor environments. The descriptive analyses focus on identifying the compounds in higher concentrations by microenvironments, and the estimation of relative health risk associated with exposure to air toxics.
Sampling design
All types of samples were concurrently collected from indoor air in the Park and Ride Commuter buses, the investigator’s residence, and an academic institution office in the Houston area for three-hour periods in the morning (6AM-9AM) and afternoon (3PM-6PM) for 5 consecutive weekdays. The investigator carried sampling devices on buses for three consecutive trips of approximately 1hour each between a suburban Park and Ride stop (Addicks, Houston) and the centrally-located Texas Medical Center (TMC). The route of the ride and the relative location of the sampling area are illustrated in Figure 1. In bus, indoor home, and work concentrations were sampled simultaneously on the same day and time. Due to the limitation of resources, in car sample was conducted following week on the same route of the bus sample.
VOCs and PM2.5 measurement
A suite of VOCs were actively sampled using adsorbent tubes packed with Carbopack X. PM2.5 mass concentrations were continuously measured with Dust Trak and Side Pak personal aerosol monitors (TSI Inc.). Passive samples of VOCs using 3M OVMs (Organic Vapor Monitor) were collected for 24hours daily in the residence and office for quality assurance comparisons with the active 3-hour samples, while gravimetric sampling of PM2.5 for cumulative 30hour periods was also conducted to provide composition profiles and mass concentration comparisons with the TSI instruments. Ultrafine particle number concentrations were measured with a portable condensation particle counter (P-trak, TSI Inc.) in buses during the rides and in the residence. HOBO sensors logged the temperature, humidity, and light intensity in each microenvironment. Time and location of commuting routes were logged using two different GPS travel data loggers (Garmin eTrex and iGotU). A week later, in-vehicle samples for VOCs, PM2.5 and UFP were sampled in a car for two days for the same time periods and routes.
Chemical and data analysis
Adsorbent tubes were analyzed using GC-MS with a thermal desorption system. Passive samples were analyzed using GC-MS after solvent extraction. The elements and metal species deposited on Teflon filters were analyzed by ICP-MS after high temperature (200°C) high pressure (200 psig) digestion with a mixture of acids (HF, HNO3, and H3BO3). More details on the chemical analysis methods on VOCs and elements are available elsewhere.18,19 In order to compare the distribution of the concentrations measured in two different microenvironments, using SPSS. Nonparametric Mann-Whitney test (p<0.05) was used because the concentrations were log-normally distributed. The 70-year lifetime cancer risk is estimated from the VOC concentrations of four compounds that have unit risk values from California Environmental Protection Agency, Office of Environmental Health Hazard Assessment according to Equation 1:
CR =C × UR (1)
Where CR is 70-year lifetime cancer risk, C is VOC concentration in microenvironment (μg/m3), UR is inhalable unit risk (μg/m3)-1.The unit risk is listed in Table 1.
|
VOC |
Unit Risk, (μg/m3)-1 |
|
1,3-Butadiene |
1.70E-04 |
|
Benzene |
2.90E-05 |
|
p-Dichlorobenzene |
1.10E-05 |
|
Ethylbenzene |
2.50E-06 |
Table 1 VOCs and unit risk applied for cumulative cancer risk estimation.
Unit Risk Source: Cal EPA, OEHHA
VOCs concentrations by microenvironments
The comparison of VOC concentration distribution by microenvironments is shown in the box-whisker plots (Figure 2 & 3). RIOPA study and HEATS data are provided as reference lines for comparison across the studies and different microenvironments.14,18
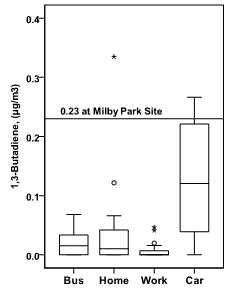
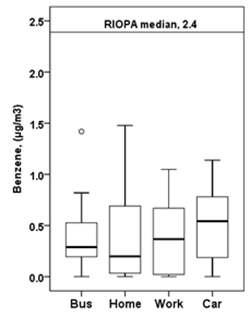
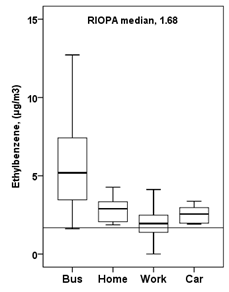
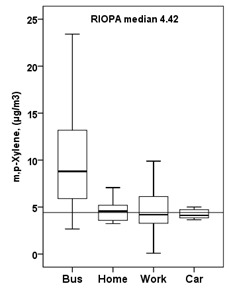
Figure 2 Traffic and gasoline VOC concentrations by microenvironments; Bus, home, work, and car. In bus, home, and work concentrations were sampled simultaneously. In car sample was conducted following week on the same route of the bus sample. Reference lines are from RIOPA study, or HEATS data for comparison.14-18
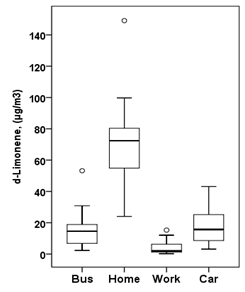
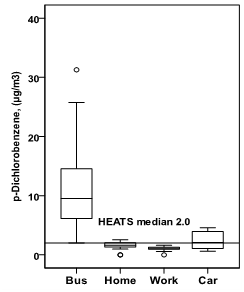
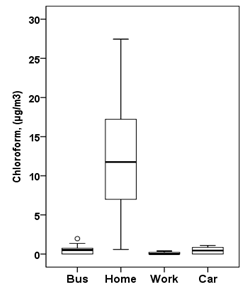
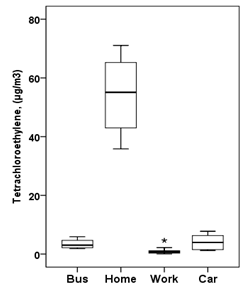
Figure 3 VOC concentrations that have common household sources by microenvironments; Bus, home, work, and car. In bus, home, and work concentrations were sampled simultaneously. In car sample was conducted following week on the same route of the bus sample. Reference lines are from RIOPA study, or HEATS data for comparison.14,18
VOCs derived from traffic and gasoline
1,3-butadiene and benzene are the two most carcinogenic compounds among the measured VOCs. In all four microenvironments, the median levels of 1,3-butadiene were lower than 0.23μg/m3 reported from Mil by Park fixed monitoring site in HEATS. In home and in bus concentrations were not statistically significantly different for 1,3-butadiene, while the in car concentrations were significantly higher than in bus concentrations and in bus concentrations were significantly higher than in work concentrations. It is unclear why in car concentration of 1,3-butadiene was significantly higher than other. The potential causes may be because it was sampled on different day, and the passenger car may have more sensitive to the on-road conditions due to the closer to the surface of the highway, or it had more self pollution than bus. Unlike 1,3-butadiene, benzene concentrations were not varied significantly by microenvironments, although the in car concentrations were slightly higher than work, bus, and home. The median concentrations observed lower than 1μg/m3 in this study, which were less than 50% of the concentration observed in the RIOPA study, 2.4μg/m3 in 1999 and 2000.14 The lower than RIOPA concentrations are the evidence that the removal of benzene in recent reformulated gasoline lowered background level of benzene a decade later. Consistent decrease in benzene concentration in the background urban air was also observed in the HEATS.18 Other VOCs derived from evaporation of gasoline, i.e., ethylbenzene and m,p-xylene were found significantly higher in-bus air than any other microenvironments (Figure 2). The median concentrations of ethylbenzene were higher than 1.68μg/m3, the median concentration observed in the RIOPA study in the residential ambient air in Houston area. The distribution of the concentration of hexane, nonane, decane, dimethylpentane, and ethyl methyl benzene were also statistically significantly higher in bus air than home or work, and car (Table 1). When the concentration of traffic and gasoline derived VOCs in home and work were compared, home were mostly higher than work because the home had attached garage in use and the work was an office on the sixth floor of public building.
VOCs emitted from household use
Many VOCs can be found in significant amount in indoor air of home and office buildings because VOCs are emitted from fragrance of detergent, deodorizing agent, cleaning agent, building materials, paints, and any indoor combustion such as ETS or cooking. Figure 3 illustrates the distribution of concentrations of d-limonene, p-dichlorobenzene, chloroform, and tetrachloroethylene by microenvironments. As expected, elevated concentrations were observed in home than other microenvironments for d-limonene, chloroform, and tetrachloroethylene. Styrene, trichloroethylene, and α-pinene were also statistically significantly higher in home air than the concentrations measured in bus and in work air (Table 2), except that p-dichlorobenzene concentration was significantly elevated in bus than any other microenvironments. It is indicating the deodorizing agent; p-dichlorobenzene may have been included in cleaning agent of the public transportation vehicles. The elevated concentration of d-limonene in home must be contributed from fragrance in detergents and other household products such as cleaning agents. Chloroform can be emitted from chlorinated tap water when hot water is used in house such as shower, use of cloth washer or dishwater, and boiling water. Elevated tetrachloroethylene was observed in home in this study. Tetrachloroethylene is degreasing agent that was commonly included in dry cleaning agent. The home had dry cleaned sweaters stored close to the air monitors. Indoor air in work contained the least amount of these VOCs derived from household cleaning agents and hot water use.
VOC |
Bus vs. Home |
Bus vs. Work |
Home vs. Work |
Bus vs. Car |
1,3-Butadiene |
n.d. |
Bus |
Home |
Car |
Benzene |
n.d. |
n.d. |
n.d. |
n.d. |
Toluene |
Home |
Work |
n.d. |
n.d. |
Ethylbenzene |
Bus |
Bus |
Home |
Bus |
m,p-Xylene |
Bus |
Bus |
n.d. |
Bus |
Pentane |
Home |
Work |
Home |
n.d. |
Hexane |
n.d. |
Bus |
Home |
n.d. |
Nonane |
Bus |
Bus |
Home |
Bus |
Decane |
Bus |
Bus |
Work |
Bus |
Dimethylpentane |
Bus |
Bus |
Home |
Bus |
Ethylmethylbezene |
Bus |
Bus |
Work |
n.d. |
Styrene |
Home |
Bus |
Home |
n.d. |
Chloroform |
Home |
Bus |
Home |
n.d. |
Trichloroethylene |
Home |
Bus |
Home |
n.d. |
Tetrachloroethylene |
Home |
Bus |
Home |
n.d. |
d-Limonene |
Home |
Bus |
Home |
n.d. |
α-Pinene |
Home |
Bus |
Home |
n.d. |
p-Dichlorobenzene |
Bus |
Bus |
Home |
Bus |
Table 2 Indoor locations that had statistically significantly higher VOC concentrations (p<0.05) based on the results of Mann-Whitney test
n.d: Two group were not statistically significantly different
Cancer risks
The 70-year lifetime cancer risk is estimated based on the measured VOC concentrations of four compounds that have unit risk values from California Environmental Protection Agency, Office of Environmental Health Hazard Assessment (Table 2). The VOCs that were used for cumulative cancer risk (CCR) were; 1,3-butadiene, benzene, p-dichlorobenzene, and ethylbenzene. The CCR estimated based on the exposure level in bus air was the greatest than CCR based on the level in car, home, and work in order of magnitude (Figure 4).The median CCRs from the residence (36×10-6) or work (26×10-6) indoor environments were lower than the HEATS home median CCR (66×10-6). However, the median CCR estimated from the in-vehicle exposure in the park and ride commuter bus (131×10-6) was significantly higher than HEATS CCR median, indicating the in-vehicle exposure to the VOCs can be greater risk compared than living near industrial sources of those VOCs. The cumulative cancer risk reported in this study is only estimated based on short-term sampling with limited number of the samples, therefore interpretation and extrapolation of results should be carefully considered.
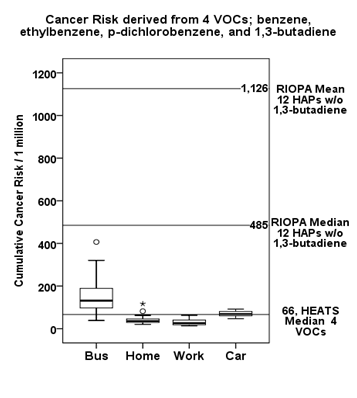
Figure 4 Cumulative cancer risk derived from the subset of VOCs with unit cancer risk (Table 2). The compounds were benzene, ethylbenzene, p-dichlorobenzene, and 1,3-butadiene. The references lines are derived from the other study data collected in Houston residential areas. RIOPA study was sampled from 1999 to 2001. HEATS data were collected from 2008 to 2009. 1,3-butadiene was not quantitated for both RIOPA study and HEATS.
PM2.5 and UFP
Descriptive statistics of PM2.5 mass (μg/m3) and PM2.5 aerosol monitor concentrations (μg/m3) are listed with ultrafine particle number concentrations (particle number/cc) in Table 3. The PM2.5 mass and aerosol monitor concentrations in-vehicle of park and ride commuter bus was significantly higher than those concentrations in indoor air at home. Mean PM2.5 mass measured in work was the lowest, 10.5μg/m3. In-vehicle PM2.5 concentrations were more influenced by the immediate emissions exist on road at the front of the moving direction of the bus. The mean ultrafine particles number concentration was higher in home than in-vehicle. However, the maximum of the ultrafine particles were reached to the upper limit of the particle counter (P-trak) in the in-vehicle samples. When the real-time UFP readings are compared with the activities in home (Figure 5) and location of the vehicle at the sampling time (Figure 6) as examples, in home readings may influenced by moisture contents in the air. Therefore, the cooking methods such as boiling, or steam of iron also contributed the UFP particle counts. It is notable that vehicles in front were immediately influenced to the in-vehicle UFP exposure when driving a passenger vehicle (Figure 6 & 7). UFP particle concentrations rapidly increased significant amount near combustion such as idling buses, fleet of school buses and diesel trucks near shipping area. Indoor combustion such as grilling, frying also contributed to UFP concentrations at home. It is very challenging to chemical speciation of UFPs due to the small mass and potential chemical reaction that can rapidly influence particle composition.
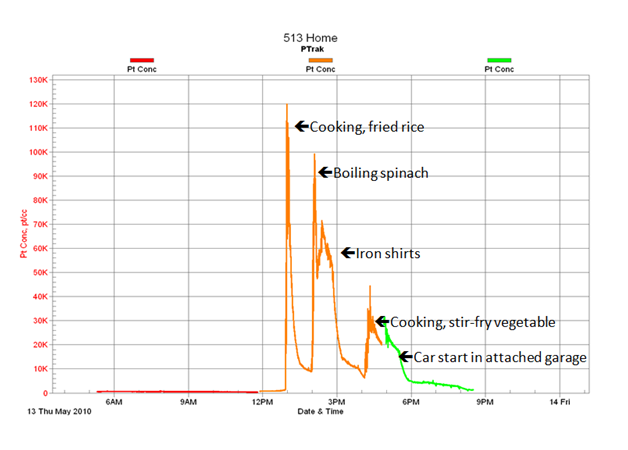
Figure 5 UFP particle count concentrations for a sampling day at residence with associated activities.
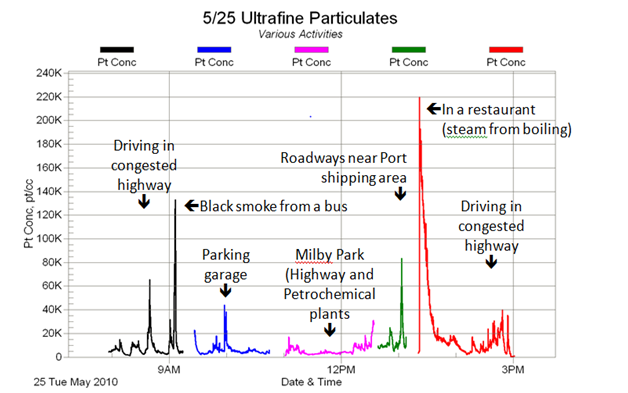
Figure 6 UFP particle count concentrations for a sampling day in vehicle readings at various locations.
|
|
Bus |
Home |
Work |
||||||
|
Mean |
Std. Dev. |
Max |
Mean |
Std. Dev. |
Max |
Mean |
Std. Dev. |
Max |
|
|
PM2.5, µg/m3 |
38.1 |
4.9 |
41.5 |
12.6 |
1.4 |
13.6 |
10.5 |
3.9 |
13.3 |
|
(Filter) |
|||||||||
|
PM2.5, µg/m3 |
26.3 |
153.6 |
15,425 |
22.5 |
22.7 |
244 |
NA |
NA |
NA |
|
(Counter) |
|||||||||
|
Ultrafine PM, |
6,215 |
8,653 |
500,000 |
6,497 |
14,017 |
161,000 |
NA |
NA |
NA |
|
particle/cc |
|||||||||
Table 3 Comparison of PM2.5 filter mass concentration, PM2.5 monitor reading mass concentration, and ultrafine particle counts by locations
NA, not available
In-vehicle exposures were higher than indoor levels at home or work for the VOCs emitted from gasoline evaporation and end-of-tailpipe exhaust. Home indoor levels were higher than at-work or in-vehicle levels for VOCs from household cleaning agents, hot tap water use, or dry cleaning agents. The VOC concentrations in work indoor air were significantly lower than the levels measured in-vehicle, except for toluene and n-pentane. The VOCs with significantly (p<0.05) higher in-vehicle than work indoor air concentrations were 1,3-butadiene, chloroform, trichloroethylene, tetrachloroethylene, p-dichlorobenzene, and eleven additional target VOCs, but not benzene. Benzene levels were not significantly different by location. When Cumulative Cancer Risk (CCR) was derived from a subset of VOCs (1,3-butadiene, benzene, p-dichlorobenzene, and ethylbenzene), CCR from exposure to in-vehicle air was higher than for indoor levels at home or work. The CCRs from the residence or work indoors environments were lower than the HEATS home median CCR. In-vehicle exposures (bus or car) were higher than indoor levels in home or work for PM2.5. Ultrafine particle levels were elevated significantly when there were indoor combustion such as cook stove use or hot water use occurred in the home. Ultrafine particle levels were also elevated near congested traffic or diesel vehicles, and in the presence of smokers in the bus. To reduce the cancer risk caused by the traffic emission, there needs cleaner technology to remove the carbon based pollutants from the gasoline and diesel engines and also expands renewable energy use.
NIOSH traffic Pilot Project Research Training Program 2009/2010, Southwest Center for Occupational and Environmental Health (SWCOEH), Dr. Shankararaman Chellam, Civil Engineering University of Houston; Chief Arturo Blanco, City of Houston; Darrin Hall, Houston Mayor’s office; Mr. T. Jassien, A. Skabowski, and operators at Houston METRO
Author declares that there are no conflicts of interest.

©2016 Kwon. This is an open access article distributed under the terms of the, which permits unrestricted use, distribution, and build upon your work non-commercially.