eISSN: 2576-4470


Research Article Volume 5 Issue 1
Pontifical Catholic University of Minas Gerais, Brazil
Correspondence: João Francisco de Abreu (Ph.D), Pontifical Catholic University of Minas Gerais (PUC Minas), Brazil
Received: September 15, 2020 | Published: February 19, 2021
Citation: Abreu JFD, Faria AHPD, Alves DFC. Spatial analysis applied to crime study: An exploratory approach applied to a Brazilian city. Sociol Int J. 2021;5(1):13-17 DOI: 10.15406/sij.2021.05.00248
The article is a product of an exploratory study on the dynamics of urban violence in Belo Horizonte.(Minas Gerais, Brazil) The data refers to crimes of robbery registered in Belo Horizonte from 2007 to 2013. Statistical techniques of spatial analysis were used. The data shows the dynamics of the processes and the socio-spatial environment of crime in Belo Horizonte, especially that of the robbery. The results demonstrate that there is a pattern in the concentration of crimes in the hyper center of the capital, indicating the spatial correlation with commercial activities, a main crime attractor.
Keywords: geography of Crime, robbery, crime attractors, belo horizonte, Minas Gerais, brazil
The issue of violent crime in urban space has been addressed by two agendas: one path dealing with public security and its implications in social disintegration and disorder, as well as the discussions of urban spaces and their limits of exclusion and marginality. The other concern approaches urban planning and the challenges to overcome this phenomenon, increasingly treated as "typical" of the city environment.
Indicators of crime and violence in urban centers show widespread growth, but crime is concentrated in certain locations. In Brazil, according to Beato et al.1 based on data from the 2000 Census, the Unified Health System and the Center for Studies on Crime and Public Security, metropolitan regions as Rio de Janeiro and São Paulo concentrate 40% of the homicides committed in the country (although these two cities represent 18 % of the country’s population). In addition, about 20% of violent deaths occur in less than 2% of the geographical area of urban centers. In Belo Horizonte, city of southeastern Brazil, capital of Minas Gerais state, it is not different. 48% of the area concentrates 90% of crimes (Figure 1).2
Studies point out that delinquent behavior is greatly influenced by the places visited in the daily life of the offenders. Routine exposure to sites without effective supervision, especially of young people, allows unstructured socialization within groups that generate favorable conditions that can lead to delinquency.3
When there is convergence of facilities that attract many people, there is the greatest potential to create configurations of criminal convergence - a class of behavioral settings that host a wide range of crime opportunities. These places have the capacity to turn into regional crime problems.4
Efforts to identify facilities with a particularly high crime rate typically adopt a geographical approach. Many different techniques have already been applied to isolate sites with stable and high levels of crime, including crime rates,5 kernel density estimation,6 locational quotients,7–9 combined time series (Spelman, 1995), prediction algorithms10 and trajectory analysis.11 Recognizing the significant contributions of these approaches, the interdependent nature of crime in places requires the continued exploration of analytical tools.
St. Jean (2009) has shown that crime hot spots are often located close to economic nodes that involve money circulation: micro establishments with specific functions such as bars, fast food restaurants, pawn shops, places that bring people together (often in large numbers), and people who carry cash(some of whom are distracted and vulnerable). In environmental criminology, these places were labeled as criminal attractors and crime generators.7 Previous studies have docmented high crime levels in and around these types of facilities.12–15 Stucky and Ottensmann16 provide a perceptive review of the literature on the effects of land use on crime.
According to Stucky and Ottensmann,16 the relationship between land use and crime has a long history in criminological research, dating back at least to early studies at the Chicago School.17 Land uses are discussed in several lines of research that include the early work of Jacobs18 and Newman (1971) on urban landscapes and crime, Brantingham and Brantingham's7 crime pattern theory, theories of activity / opportunity,19 and research on critical crime points.20,21
Crime generators and crime attractors are similar concepts that are used to explain the spatial concentrations of criminal activity.5,7 Crime generators are places that are easily accessible to the public. They can become critical points of crime because a presence of large groups of people creates occasions for crime. Typical examples are shopping centers, secondary schools and public transport stations. Some places are very specific opportunities and become attractors for crimes. These are places that do not necessarily bring together large groups of people at the same time, but their function makes them well suited for offenders motivated to find appealing and poorly guarded victims or targets.22–24
With the exception of an early study in the field (Heitgerd and Bursik, 1987), in criminology, recognition of the importance of spatial interdependence has emerged only in the last two decades. Since the turn of the century, many studies have addressed the issue of spatial interdependence and applied statistical methods and techniques to deal with it.13,25–27
Proximity of a place to a crime generator can increase the amount of crime in that place because it is located in the paths leading to and from the crime generator. For example, if a subway station attracts passengers, many of these passengers go to the streets. From the exit of the station they travel, often walking, to their destination. This can be a parked car, a bus stop, a workplace, a store, or a friend's house. Thus, there will be a strong concentration of passengers in the nearby exit of the subway station, and this concentration will dilute on adjacent blocks as the people walk to their destinations.22
Specifically for robbery, crime attractors are probably places that have money savings, places where many transactions are being made, and where most of these transactions involve money, unlike payments by credit card or electronic payment (Wright and Decker 1997). Most property violators prefer items that are concealable, removable, available, valuable, enjoyable, and disposable28,29and money meets those requirements better. Payments tend to be with money in small businesses that sell items of limited value. Examples of these companies are bars, barbers and salons, grocery stores, fast food restaurants, gas stations and pawn shops.
For crime analysis, geographers apply spatial statistics techniques that contribute to the understanding of the spatial structure and rearrangement of crime.30 These techniques are very useful from the academic point of view in understanding the phenomenon, as well as in the planning and implementation of public policies to prevent, control and combat crime and violence. Among the cited techniques in the present study, we have used the geospatial analysis techniques of dot patterns, the average distance to the nearest neighbor, the frequency of points per cell, the average center of a cloud of points, buffer analysis and correlation.
Belo Horizonte, in the context of a Brazilian metropolis, presents itself in the current process of spatial reorganization of its population and recent restructuring of its urban settlement, mainly with regard to the revitalization of its road structure and development / expansion of specific areas of the city.
In this perspective, the central objective of this paper is to identify the places where crime against property, especially robbery, occur the most in a space-time evolutionary manner in the urban space of Belo Horizonte and which ecological factors are related to the distribution of crime in certain places in the city.
The justification for the present study is that the knowledge of places with higher incidence of crime contributes to the implementation of more adequate public safety policies, with a focus on criminal prevention, in addition to increasing the academic field of interdisciplinary studies on the phenomenon of crime with empirical data.
For this study we used data about robbery in the city of Belo Horizonte from 2007 to 2013, obtained from the Data Warehouse of the Social Defense Event Records. Based on the assumption that crime is ecologically concentrated in urban space, with environments with different criminal opportunities, in other words, regardless of the city's "offender supply", the unequal distribution of potential targets and surveillance or collective efficacy suggests a possible concentration of crime in certain places.
The exploratory analysis starts from the identification of crime hot spots using the estimation of the density surface from a spatial distribution of points - Kernel density function -, which is one of the most commonly used techniques.6,31,32
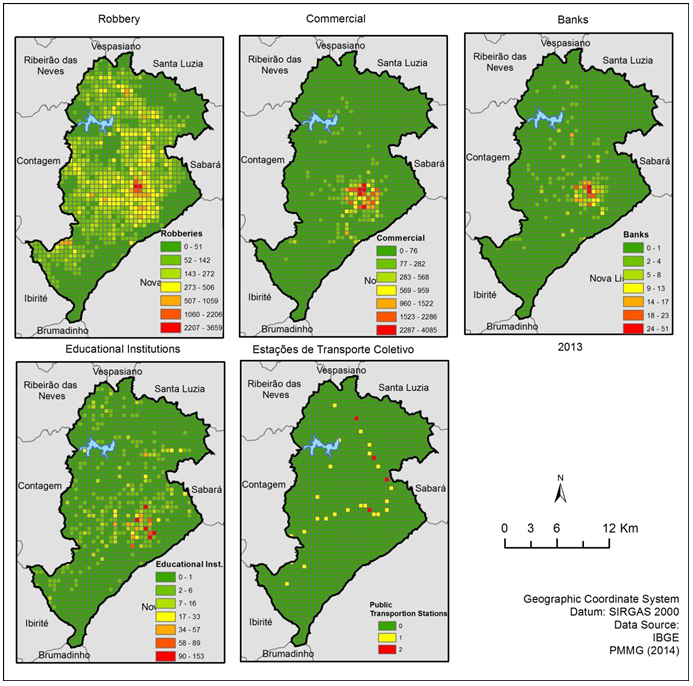
In order to identify the spatial correlation between crimes and the "attractors" for crimes, a grid network of Belo Horizonte with 500 meters x 500 meters was drawn, containing the crimes and nodes (places of destination).
In the construction of the maps the class break attributed to the concentration of events was specific for each modality, taking into account the considerable difference in the number of events of each category.
From this, spatial analysis techniques were used to study the pattern of point distribution.
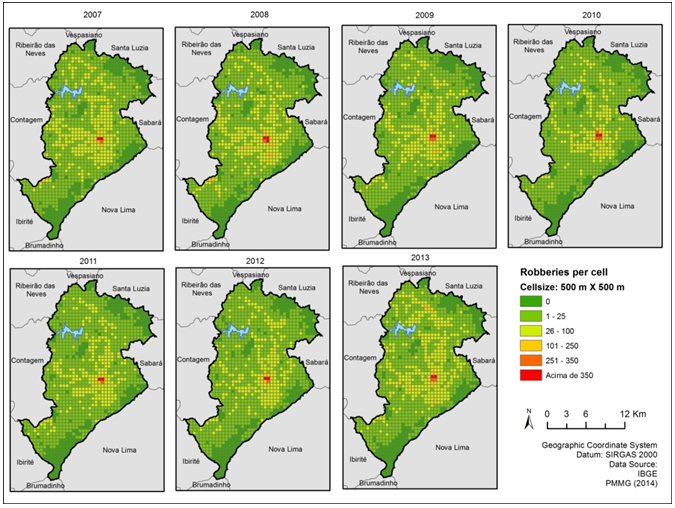
Among the violent crimes, robberies are highlighted by the quantity of events, a criminal mode in which the agent uses violence or serious threat to subtract the property of its victims. The results of the spatial distribution of robberies in Belo Horizonte from 2007 to 2013 are shown in the map collection below (Figure 2):

Figure 2 Spatial distribution of the robberies in Belo Horizonte (2007 - 2013)
Source: Prepared by the authors
The maps were elaborated from a network of cells covering the city of Belo Horizonte, in which the frequencies of crime by area were represented. From the frequency of points per square, the average of events and the variance, it was possible to identify the spatial distribution pattern of the phenomenon (Table 1).
Parameters |
2007 |
2008 |
2009 |
2010 |
2011 |
2012 |
2013 |
General |
σ² |
747,298 |
1330,147 |
940,107 |
787,101 |
641,633 |
663,840 |
881,317 |
39174,66 |
λ |
16,449 |
17,939 |
15,723 |
13,616 |
14,365 |
14,754 |
18,544 |
111,3907 |
r |
45,430 |
74,150 |
59,790 |
57,807 |
44,665 |
44,994 |
47,526 |
351,687 |
Table 1 Analysis's parameters of the spatial distribution pattern of robberies
Source: Prepared by the authors
The spatial distribution pattern of robberies in Belo Horizonte followed recurring parameters: σ² > λ e r > 1, where σ² was the variance, λ the frequency of points per square (average) and r the relationship between the variance and the average (r = σ²/ λ). These parameters indicate the aggregate standard (Figure 3).
The maps showed that, in general, there is a spatial pattern of distribution of violent crimes in Belo Horizonte for the analyzed period, and the highest concentration of crimes per space (violent crimes/km²), in a systematic way, occurs in the central Region of Belo Horizonte for every year, with emphasis on the centrality issue, considering that there is a polarization in the central zones of the intra-urban space (downtown hyper center, Barreiro and Venda Nova), with an increase for the last years in the north vector where there is a tendency of expansion, development and value of the urban land.
There was an increase of the concentration of crimes in the radial access routes connecting the center to the north vector (Cristiano Machado and Antônio Carlos avenues) and to an area of incipient concentration toward the city of Nova Lima, where there is a great flow of people to luxury suburbs.
Initially, the crime of robbery (163,210 events) is concentrated mainly in the hyper center of Belo Horizonte, where there is a predominance of economic activities that attract a considerable amount of the population, which uses the downtown part of the city as passage, with a large volume of people, especially during the day. This indicates a possibility of a number of potential victims, considering a theory of routine activities and the sociodemographic conditions of the region. In addition, a concentration of violent crimes in the southwest portion of the city is noticed, a region that includes Barreiro (important industrial and commercial center, considered a central point of the city), and that forms an "island".
The third important point in the spatial distribution of robberies in Belo Horizonte is the northern portion of the city, especially the area where the centrality of Venda Nova is located, which also presents itself as a "center" for the analysis of the phenomenon. In the locality, there is also a concentration of crimes against property in the main roads of access to the north of the city (Cristiano Machado and Antônio Carlos avenues). There is also a concentration in the direction (center-southeast), where the evolution of the urban structure of the city with a growing population flows towards the cities that concentrate luxury housing settlements.
In order to identify the dynamics of robberies in the analyzed period, the difference in the number of events from 2007 to 2013 was verified, according to the following map (Figure 4):
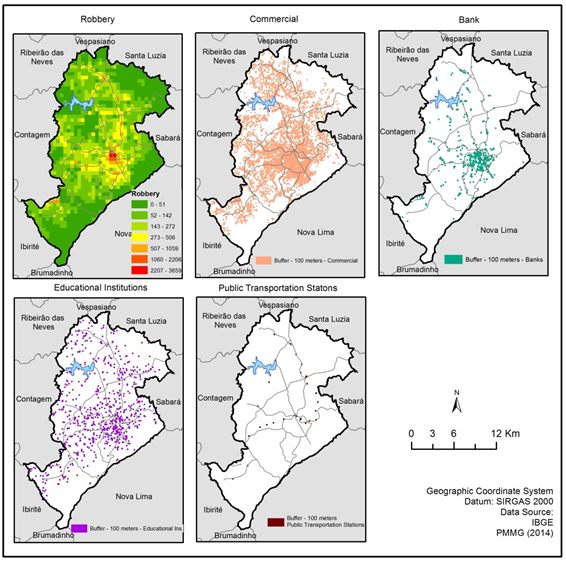
It is possible to identify that the increases in the number of events occurred in the northern part of the city, where an Administrative Center was set up by the state government, which brings together the administrative structure of the State of Minas Gerais. After this implantation, we noticed a significant increase in the number of registered crimes. For the analysis of crime attractors, we mapped the establishments of commercial uses, banking establishments, educational institutions, and public transportation stations, with a radius of 100 meters (Figure 5).

Figure 5 Crimes of robbery and crime attractors in Belo Horizonte (2007 - 2013)
Source: Prepared by the authors
In order to verify the correlation between the attractors and the occurrence of crimes, the analysis was performed by a buffer (100 meters, 250 meters and 500 meters) and we calculated the Pearson correlation coefficient with the number of events per grid of 500 meters x 500 meters. The linear correlation coefficient of Pearson rs is adequate to evaluate dependence between continuous variables, which values are expressed in real numbers (FERREIRA, 2014). The meaning of rs can be grouped into categories (Table 2):
| Range rs | Magnitude of correlation |
| 0,1 < rs < 0,4 | Weakly positive |
| 0,4 < rs < 0,8 | Moderately positive |
| 0,8 < rs < 1,0 | Highly positive |
| -0,2 < rs < -0,4 | Weakly negative |
| -0,4 < rs < -0,8 | Moderately negative |
| -0,8 < rs < -1,0 | Highly negative |
| rs = 0 | There is no correlation |
Table 2 Magnitude of correlation according to Pearson’s coefficient range
Source: Ferreira (2014, p. 99)
The coefficient of correlation between the number of events of the robbery and the presence of attractors is shown in the Table 3 below:
Attractor |
Correlation coefficient (rs) |
Banking institution |
0,581401 |
Educational institution |
0,232486 |
Public Transportation Stations |
0,142904 |
Commercial use |
0,621987 |
Table 3 Correlation between theft and crime attractors – Belo Horizonte (2007 – 2013)
Source: Prepared by the authors
The data shows a greater spatial dependence between the events of robbery and establishments of commercial use, followed by the presence of banking institutions, with moderately positive coefficients. Educational institutions and public transportation stations had a low correlation with theft events.
By the buffer analysis, it was possible to identify the number of events by distance of the attractors, and by the land use (Figure 6).

Figure 6 Robbery and crime attractors in Belo Horizonte (2007 – 2013)
Source: Prepared by the authors
The percentage of robbery events per area of influence (100 meters) of each establishment by land use is represented in the following table (Table 4):
Buffer |
Commercial |
Bank |
Education |
Public transportation |
100 m |
72% |
18% |
13% |
1% |
250 m |
95% |
37% |
50% |
6% |
500 m |
99% |
57% |
86% |
18% |
Table 4 Percentage of events by land use buffer – Belo Horizonte (2007-2013)
Source: Prepared by the authors
The commercial use stands out, with 72% of robbery crimes occurred at a distance up to 100 meters from a commercial place, 95% up to 250 meters and 99% of events occurred to 500 meters from a commercial use, corroborating with the spatial correlation and approached in the criminological theory.
The evolution of the density of violent crimes in the city of Belo Horizonte between 2007 and 2013 was analyzed. It was possible to verify a systematic pattern of polarization (centrality) of robbery crimes, which corroborates with the theory of opportunities, crime pattern, and crime attractors, due to the supply of goods and services in the central zones, and increases in the number of potential victims with low vigilance, besides representing areas of people circulation.
An important crime prevention strategy is promoting urban space management. Possible solutions include incorporating the provisions of crime control into different regulatory systems. This would involve providing project guidelines and / or developing a review process of facilities built with reduced criminal capacity. Another point is to be careful to design road networks with scenarios of convergence with the maximum potential of supervision, as approached by Bernasco Block.22
The empirical data contributes to a better understanding of the criminal phenomenon in the urban space of Belo Horizonte, besides contributing to the elaboration of public crime prevention policies, as well as to the allocation of public resources destined to combat violence.
None.
The authors declare no conflicts of interest.

©2021 Abreu, et al. This is an open access article distributed under the terms of the, which permits unrestricted use, distribution, and build upon your work non-commercially.