eISSN: 2576-4470


Research Article Volume 3 Issue 1
Department of Geography, Federal University of Tocantins, Brazil
Correspondence: Adao Francisco de Oliveira, PhD in Geography and professor of PPGG/UFT, Porto Nacional, Qd. 405 Sul, Al. 18-A, Q.I. 03, Lt. 20, Plano Diretor Sul, Palmas, Tocantins, Brazil , Tel (55 63) 9 9965-1100
Received: September 23, 2017 | Published: January 24, 2019
Citation: Oliveira AF, Ferreira RC. Socio-educational inequality index (sedii): instrument for the analysis of regional inequalities. Sociol Int J. 2019;3(1):105-113. DOI: 10.15406/sij.2019.03.00162
This article intends to present the result of a research developed in the scope of the Observatory of Territorial and Educational Policies of the Federal University of Tocantins, titled Map of Socio-educational Inequality. Based on the understanding that the IDEB-Basic Education Development Index is incomplete, because it presents a proficient domain especially in Portuguese and Mathematics without, however, mentioning the process in which the learning took place, the IDSED-Socio-educational Inequality Index, the product of the mentioned research, aims to complement the information of the first indicator. To that end, their assumption was based on the understanding that educational development, particularly of public networks, is unequal, based on socioeconomic, sociocultural, infrastructural and schooling criteria. Its main theoretical and conceptual basis is the authors P. Bourdieu and JC. Passeron and the initial object of analysis was the State of Tocantins, Brazil.
Keywords: socio, educational, inequality, territorial, analysis, increasing, knowledge, organization
The recent political, economic and sociocultural transformations in Tocantins made the regional dynamics present significant changes, especially after the political separation of the State of Goiás. According to Santos R,1 the propagation of new technologies and new organizational forms promoted a greater complexity of agricultural, industrial and service activities in the territory of Tocantins. In this way, it demanded "... a greater degree of knowledge, intellectual knowledge and increasing levels of information, making the productive and social organization in Tocantins more varied and dense".1 The complexity generated from then on created areas with greater technical specialization than others. Thus, they acquire over the others the power of command with the diffusion of technique, in which they occur in a discontinuous way in space, erecting hegemonic regions and regions submissive, that is, dependent.2 This discontinuous process in space eventually generates regional differences, both temporal and spatial.
In view of this situation, the Cartography of Regional Inequality in Tocantins, formed through socio-educational indicators, consisted of an effort to allow a better understanding of how the Tocantins state has developed regionally, mainly focused on Basic Education based on socioeconomic, sociocultural, infrastructural and educational systems that sediment their education system through the relationship of their social and public agents. Given the premise presented, the challenge refers to the necessary study of the theoretical-conceptual foundations in order to gather subsidies and answer the essential question raised here: how is the socio-educational inequality of Tocantins as an inducer of regional inequalities? In the search for the answer to this questioning, the main proposal of the work was to analyze the structure and the determinants of socioeconomic inequality in Tocantins as one of the determinants of the behavior of regional inequality. The specific objectives of the study were to discuss the notion of region based on geographical science in the search for an understanding of the process of regional development and inequality, development policies and regional planning with a focus on Brazil and Tocantins; analyze the socioeconomic conditions that weaken the school process and that inhibit the prevalence of regional social and economic development factors; develop an indicator of the socio-educational process that allows a greater understanding of the school disarrays and the regional inequalities; to map social and educational inequalities between the microregions of Tocantins in order to allow greater sense in the formulation of educational public policies and regional development.
Thus, the present study sought to develop a new indicator, synthetic and analytical, called Socio-educational Inequality Index (IDSED), composed of four indicators divided into two classes. The first class (per capita/ sampling) sets the Socioeconomic and Sociocultural Indicator and the second (school information) the indicator of infrastructure and resources and schooling. Based on the traditional techniques of decomposition of inequality measures, among others, this index has the purpose of presenting to what extent the state education network of Tocantins reflects, in its structuring, the inequalities that are inherent and characteristic of the capitalist mode of production and, therefore, projects such inequalities in the result of its action. That is, in the wake of Pierre Bourdieu's3–5 thought, this should be an indicator to verify the logic of "reproduction" of the Capitalist Field and Habitus in school composition, whether as a structured structure or as a structuring structure.
Regional inequality and education
According to Ortiz6 Bourdieu defines campo as a social space that has its own structure and relatively autonomous in relation to other social spaces. Each field has hierarchies and disputes, between dominant and dominated, by certain symbolic goods and consequently by social positions. And Habitus, according to Nogueira and Nogueira, in Bourdieu's conception, would be the mediation between structure and practice. "Each subject would experience a series of experiences, according to their position in social structures, which would affect their subjectivity, constituting a kind of matrix of perceptions and appreciations that would guide their actions in later situations". Given this context, it is important to emphasize that inequality in the present study was treated as a characteristic of capitalist societies, with specific features of each social formation, but that can be addressed through public policies based on participatory and inclusive planning. With regard to the inequalities inherent in the capitalist mode of production, it is based on the understanding that the force of capital manifests itself in the territory from the economic interests that are projected on the same, demanding at the same time a project of development and varied investments articulated to the provision of social infrastructures, among them, education.7 However, "the gestation time of the projects is long, and the return of benefits (if any) takes many years".7
In this way, the spaces of a given region are articulated in capitalist production at different times and in an unequal way, as they become interesting to capitalist accumulation. According to Santos,2 the result of this process is the formation of intraregional spaces with levels of integration, occupation, use, appropriation and development of technologies and differential values, which fatally subtracts from the regional social agents substantial citizenship. These differential values in the educational aspect refer to what Bourdieu5 call symbolic violence. For these authors, relations of force are always concealed in the form of symbolic relations. These relations of force present in the pedagogical action are considered to be concomitantly autonomous and dependent, that is, they depend on the relations of force present in a given social structure and at the same time manage to constitute themselves as an autonomous institution for the reproduction of that same structure. Thus, pedagogical action reproduces the dominant culture, reproducing also the power relations of a given social group, exercised by the "educated members" of a certain society.5 In other words, teaching materialized in pedagogical action tends to ensure the monopoly of legitimate symbolic violence, inasmuch as it imposes and suggests cultural arbitrariness.
Thus, seen through the eyes of education, what one has is a pedagogical action that reproduces the dominant culture, reproducing also the power relations of a certain social group. Faced with this factor, Bourdie4 emphasizes that "...even when it seems to obey only its own (properly schooling) norms, the teaching system obeys at the same time external rules." It is in this sense that findings such as those made by Ribeiro & Kaztman,8 relating educational inequalities to urban segregation in large cities in Latin America, may be only one dimension of an even greater territorial problem. Nascimento9 directly relates the sense of development of school education in Brazil to the neoliberal discourse, stating that: Since the 1950s, the discourse of educational reform has been limited to the field of efficiency. The official representatives of these reforms were drafted, especially in the United States, based on the prominent political role of the OECD, UNESCO and the World Bank (1970s) and the IMF.10 Schools, in this discourse, should serve the community, under the logic of quality and business connotations. In fact, the school becomes a company when verifying quality under the logic of profit and the market.9
Since one can understand the global social relations of the present stage as an urban society,11 which implies in the predominance of the urban with all its material and symbolic values over the rural, making the field lifestyle heterotropic , different, secondary), so the relationship between educational inequalities and social segregation must also be projected for territories that are not characterized as large cities, but that suffer the same effects of the problematic characteristic of urban society, which is the case of reality of Tocantins.
Methodology of the socio-educational inequality index (Idsed)
Idsed is an indicator that aggregates the synthetic and analytical dimensions, consisting of four (4) indicators divided into two classes, the first class being defined by a Per Capita Sampling survey, applied to the Basic Education students of the State Education Network between the microregions of Tocantins. In this class, the Socioeconomic Indicator, with a weight of 4, and the Sociocultural Indicator, with a weight of 3. The second class of indicators is defined by School Information, with Infrastructure and Resources as the third indicator, with a weight of 2, and Schooling as the fourth indicator of weight 1, as shown in Table 1. In all, 26 variables were defined and the final indicator, in this case Idsed, will be a centesimal number defined between 0.00 (situation of extreme inequality) and 1.00 (equality situation). Regions with Idsed higher than 0,800 have a level of socio-educational inequality considered low, regions with Idsed between 0.500 and 0.799 are considered of average socio-educational inequality and regions with Idsed up to 0,499 have the level of socio-educational inequality considered high.
Indicators |
|
|
Number |
Variables |
1st CLASS (per capita) |
Socioeconomic (1) |
Weight 4 |
1 |
Number of bedrooms |
|
|
|
2 |
It has a bathroom inside the house |
|
|
|
3 |
Own car |
|
|
|
4 |
Number of people living in the house |
|
|
|
5 |
Separate fridge freezer |
|
|
|
6 |
Washing machine |
|
|
|
7 |
Works outside the home |
|
|
|
8 |
Has maid |
|
Cultural (2) |
Weight 3 |
9 |
Has computer |
|
|
|
10 |
Features Color TV |
|
|
|
11 |
On class day, how much time do you spend watching TV, surfing the internet, or playing electronic games |
|
|
|
12 |
Own DVD |
|
|
|
13 |
Read newspapers |
|
|
|
14 |
Read magazines |
|
|
|
15 |
Read books |
|
|
|
16 |
Attend libraries |
2nd CLASS (school information) |
Infrastructure and Resources (3) |
Weight 2 |
17 |
Dependencies |
|
|
|
18 |
Services |
|
|
|
19 |
Equipments |
|
|
|
20 |
Technology |
|
|
|
21 |
Accessibility features |
|
|
|
22 |
Pedagogical Organization |
|
Schooling (4) |
Weight 1 |
23 |
Age-series distortion |
|
|
|
24 |
Abandonment |
|
|
|
25 |
Failure |
|
|
|
26 |
Percentage of teacher training - Full Degree |
Table 1 Variables used in the composition of Idsed
Source Prepared by Ferreira, Rogério C. from the School Census of Basic Education 2013.
Table 1 shows a significantly different number of variables. In view of the above, and especially in view of the challenge of including as many variables as possible that can be incorporated into the discussions. The present study opted to treat and analyze the information collected within the statistical-methodological assumptions of the multivariate analysis of the data. According to Gonçalves & Santos,12 the multivariate statistic aims to condense the data into its main components, making its analysis easier, as well as reducing interpretation errors. For Moitta Neto,13 "[...] the multivariate analysis corresponds to a large number of methods and techniques that simultaneously use all variables in the theoretical interpretation of the data obtained". Thus, what we propose next is a multivariate treatment of the variables of interest, allowing a broader view of the object under study and the interrelation between variables.
Spatial clipping and description of the sample
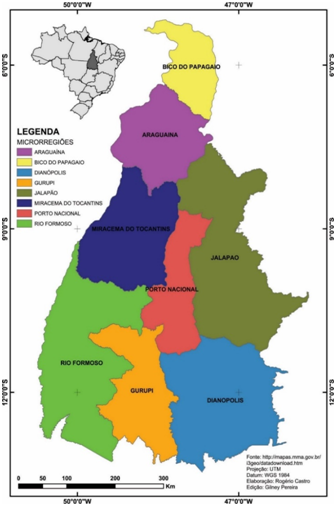
The application of Idsed had as a space cut the strategic division of the eight microregions of Tocantins, made by the IBGE in 1990, being: Araguaina with 17 municipalities, Bico do Papagaio with 25 municipalities, Dianópolis with 20 municipalities, Gurupi with 14 municipalities, Jalapão with 15 municipalities, Miracema do Tocantins with 24 municipalities, Porto Nacional with 11 municipalities and Rio Formoso with 13 municipalities, totaling 139 municipalities (Figure 1). In addition to better targeting regional inequalities in education, this division considers the condition of physical-territorial and socioeconomic homogeneity of the regions.
It is worth mentioning that for the identification of microregions, the IBGE selected two basic indicators: the production structure and the spatial interaction. Like this, the first involves the analysis of the structure of primary production based on land use, agricultural orientation, size structure of establishments, production relations, technological level and employment of capital and the degree of diversification of agricultural production, the structure of industrial production [...] The spatial interaction indicator is due to the area of influence of the sub regional centers and zone centers as articulating elements of the processes of collection, processing and dispatch of rural products of distribution of goods and services to the field and to other cities.14 In relation to the description of the sample, the composition of the Idsed was elaborated from the condensation of a set of socioeconomic indicators found in the microdata of the School Census of Basic Education contained in the National Institute of Studies and Educational Research Anísio Teixeira (Inep), in which it collects data on Brazilian schools, classes, teachers and students. All levels of education are involved in this Census: Early Childhood Education, Elementary Education, Secondary Education and Youth and Adult Education (EJA). The microdata of the School Census of Basic Education used were from the year 2013 and the contextual socioeconomic questionnaire from Prova Brasil conducted in 2011, which deals specifically with the profile, daily life and perception of the student about the school. In this socioeconomic questionnaire of Prova Brasil, students provide information about context factors that may be associated with performance. In addition to these microdata, the results were also extracted from the School Register form, which contains information on characterization/infrastructure/equipment and schooling. The researched population consists of all the students who were regularly enrolled and selected to respond to the contextual questionnaire of Prova Brasil. Thus, we had access to an Inep database of 510 state schools in the state of Tocantins (considered only schools in the situation: In Activity). Inep in the state of Tocantins in 2011, 30,752 questionnaires were administered to students from the 5th grade (11.241) and 9th grade (19.511) of the elementary school, with 25,422 students answered in the 5th grade (9,838) and 9th grade ( 15, 584), as shown in Table 2.
Micro-region |
Questionnaires applied |
Questionnaires answered |
||
5th grade |
9th grade |
5th grade |
9th grade |
|
Araguaína |
2.244 |
4.373 |
2.155 |
3.545 |
Bico Papagaio |
1.933 |
3.245 |
1.68 |
2.607 |
Dianópolis |
1.608 |
2.234 |
1.401 |
1.776 |
Gurupi |
988 |
1.515 |
836 |
1.257 |
Jalapão |
654 |
1.038 |
540 |
877 |
Miracema do Tocantins |
1.137 |
2.417 |
963 |
1.754 |
Porto Nacional |
1.84 |
3.363 |
1.572 |
2.765 |
Rio Formoso |
837 |
1.326 |
691 |
1.003 |
Total (per year of education) |
11.241 |
19.511 |
9.838 |
15.584 |
Total General |
30.752 |
25.422 |
||
Table 2 Number of questionnaires applied and answered by micro region
The numbers presented in Table 1 correspond to the state education network, chosen for Idsed application. The factors that led to this definition are summarized in the scope of this network and in the number of students interviewed, which contributes to a better analysis of the regional differences. Based on these questionnaires, the eight variables of the Socioeconomic Indicator were elaborated, as well as the eight variables of the Sociocultural Indicator. Regarding the variables of the School Infrastructure and Schooling Indicator, these were extracted from the School Register form, respectively, which answered the Brazil Quiz questionnaires. The reduction of the variables was delineated from the effort to draw a socioeconomic and sociocultural profile that extrapolates the student's life history, and for this reason, they have made it possible to draw a profile that contemplates their out-of-school relationship.
Regional analysis between the Tocantins' microregions from Idsed
The intention of creating Idsed is to produce results (based on socio-educational cartography) that reveal a reality beyond that allowed mainly by the Index of Basic Education Development (Ideb), which focuses its attention on the student's performance against the provided, without considering the conditions for carrying out this teaching in the regional context. In this perspective, by bringing to light the socioeconomic, infrastructural and cultural conditions that permeate the school universe, Idsed intends to be an instrument complementary to Ideb in the formulation of guidelines, strategies and actions of educational policies in the sense of overcoming the inherent inequalities in the educational process at the regional level, thus contributing to the increase of territorial development. Thus, assuming that the four indicators of the Idsed range from zero to four, it is important to point out that the higher the rate of the indicator, the better the socioeconomic, sociocultural, infrastructural and educational situation of a given region, being that of 0, 0 to 1 the indicator is poor, 1.1 to 2 the indicator is weak, 2.1 to 3 the indicator is regular, 3.1 to 4 the indicator is satisfactory and 4 the indicator is considered ideal. Therefore, analyzing the Figure 2, which shows the Socioeconomic Indicator of the 5th and 9th grades of elementary school, it is observed that none of the eight microregions of Tocantins had ideal or satisfactory rates, with rates ranging from weak to regular (Graph 1).
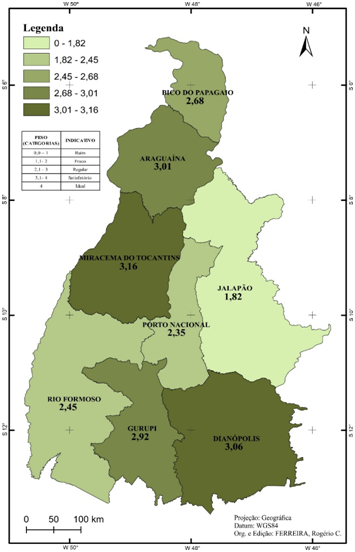
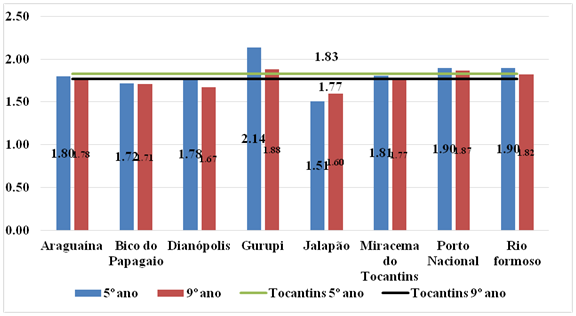
The Gurupi micro-region presents the best sócio-economic indicator in relation to the Socioeconomic Indicator of the 5th grade, but with 2.14, the index is considered regular. Then, they appear to the microregions of Porto Nacional and Rio Formoso with the rate of 1.90 (Weak) each one. The greatest disparities are found between the Jalapão (1.51), Bico do Papagaio (1.72) and Dianopolis (1,78) microregions. In relation to the Socioeconomic Indicator of the 9th grade of elementary education, it follows the same logic of the indicator of the 5th grade, but with a lower result among the microregions. The Gurupi micro-region continues to show the best rate, but below those verified in the profile of the students of the 5th grade, with 1.88 (Poor). With the exception of the Jalapão microregion, which has its socioeconomic indicator of the 9th grade (1.60) a little better than the fifth year of elementary school (1.51), the others obtained lower rates in the 9th grade, being: Araguaína with 1.78, Papagaio Bico with 1.71, Dianópolis with 1.67, Gurupi with 1.88, Miracema do Tocantins with 1.77, National Port with 1.87 and Rio Formoso 1.82. All are with socioeconomic levels considered to be weak, on the categorization scale from zero to four. This weak result in the socioeconomic profile of the students of the state education network, converges directly in the low school performance in Tocantins. As shown in Graphic 1, all microregions have very low socioeconomic levels, especially the Jalapão, Bico do Papagaio and Dianópolis microregions. These microregions, as well as transition rates in terms of approval, disapproval, abandonment and the phenomenon of age / series distortion, are the most worrying. One of the corroborating factors for this low level is linked to the high rates of illiteracy and the low level of schooling among the adult population in the mentioned microregions. These two factors already contribute substantially to school failure and failure, keeping the cyclical problem of poverty in these regions to the detriment of others.
Still according to Graph 1, Tocantins presents in both the 5th (1.83) and the 9th grade (1.77) of elementary school, a socioeconomic indicator considered weak. This result is a reflection of the general average among the Tocantins' microregions, which, as already explained, are in the weak to regular range. When analyzing the comparison between the microregions and the Tocantins' average, it is observed that the microregions of Gurupi, Porto Nacional and Rio Formoso are the only ones that are above the state average in the two series analyzed (see Chart 1). The others are all below the Tocantins' average. This comparison indicates that the state, in general, presents weaknesses in socioeconomic aspects among elementary school students. However, because it is an average, some regions present better or worse indicators, which we can define as social-economic inequality between the state regions. With regard to the graph of the Sociocultural Indicator of the 5th grade and 9th grade of elementary school(Graph 2), the results show that the sociocultural level between the microregions transits only between the weak and regular. It is important to emphasize that this indicator has eight variables that deal in particular with access to the information and communication network, such as the acquisition of computers and television, as well as the habit of reading newspapers, magazines and books.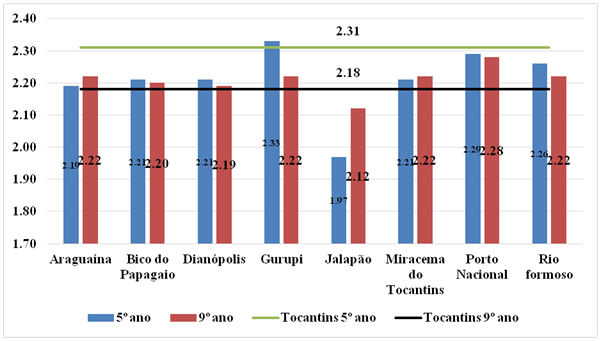
According to Figure 3, the microregion with the lowest sociocultural indicator per student in the 5th grade of elementary education is the Jalapão region with 1.97 (Low), then the micro-region of Araguaína with 2.19 (Regular). Bico do Papagaio, Miracema do Tocantins and Dianópolis meet with a rate of 2.21, with a regular indicative. The micro regions of Porto Nacional (2,29) and Rio Formoso (2,26) appear next. Although the indexes are between weak and regular, the micro-region of Gurupi stands out with the best sociocultural Indicator, with 2.33. It is important to note that this rate presented by Gurupi is higher than the state rate, which is 2.31. Given this scenario, the state of Tocantins presents fragile sociocultural indicators for students in the 5th grade of elementary school. Recalling that these students are still children or adolescents who will later become young and adult, thereby participating in the Economically Active Population (EAP). But for this success to be successful, it is necessary to have public policies that invest in cultural aspects in a way that develops critical reading, interpretation, and finally, an incentive for access, permanence and success in educational institutions.
In relation to the students of the 9th grade of elementary school of the state network, it is important to emphasize that the majority already presents a somewhat higher rate, according to the following approach: Araguaína (2,22), Bico do Papagaio (2,20 ), Dianópolis (2,19), Gurupi (2,22), Jalapão (2,12), Miracema do Tocantins (2,22), Porto Nacional (2,28) and Rio Formoso (2,22) (see Chart 2). It can be observed that, although the indexes were slightly higher in relation to the 5th grade and in relation to the Tocantins' average (except the Jalapão microregion), being at a satisfactory level, it is in this level of schooling that the students present greater school failure, according to data from Inep.15 This school failure in the last grades of elementary school is worrying, since it jeopardizes the future prospects of the youth as a citizen. Regarding the discussion about the second class of the Idsed indicators, Figure 2 presents the Infrastructure and Resources Indicator map. This indicator has six variables (dependencies, services, equipment, technology, accessibility and pedagogical organization), in which, following the weighted average calculations, the following information is presented: Araguaína (3.01), Bico do Papagaio, Dianopolis (3.06), Gurupi (2.92), Jalapão (1.82), Miracema do Tocantins (3.16), Porto Nacional (2.35) and Rio Formoso (2.45). It is observed that of the eight microregions, three have a satisfactory level of infrastructure (Araguaína, Dianópolis and Miracema do Tocantins), four have a regular level (Bico do Papagaio, Gurupi, Porto Nacional and Rio Formoso) and only one, in this case, the microregion of the Jalapão, presents weak level. Taking into account the Tocantins' average, which is 2.75 (regular), we can see that the regions that are most fragile infrastructural are the microregions of Jalapão, Bico do Papagaio, Porto Nacional and Rio Formoso. Consequently, Jalapa’s microregion is negatively affected by the vulnerability of socioeconomic and sociocultural aspects, and now of the infrastructural ones. The reality presented by this region instigates us to reflect on some issues related to public policies. Have federal, state and municipal managers also been able to see this reality? Are there projected public policies planned to minimize these social impacts in this region? The data presented do not allow us to state that there are no public policies for this purpose for this region. Figure 3 shows the map of the Schooling Indicator, an element of great importance for crossing with previous information. This indicator has four variables, three of which portray school failure (Distortion age/grade, dropout, and disapproval), and one depicts the percentage of full-time teachers. This figure includes the following information: Araguaína (2,80), Bico do Papagaio (2,60), Dianópolis (2,60), Gurupi (2,80), Jalapão (2,40), Miracema do Tocantins 60), Porto Nacional (3.00) and Rio Formoso (3.00).16
It can be observed that all microregions are at the regular level (2.1 to 3.0), with emphasis on the microregion of Porto Nacional and Rio Formoso. The Jalapão region presented the lowest level of schooling, with 2.40 respectively. This low level is mainly due to the high rates of school failure and dropout that increase the rates of age/grade distortion, which ultimately contributes to regional disarray, in which school failure materializes in regions that are less in need of resources. Socioeconomic and sociocultural. Thus, in the case of the Jalapão microregion, which has presented the lowest socioeconomic, socio-cultural, infrastructural and consequently schooling indicators, it leads us to the understanding that one factor reflects the other. However, this subordination does not occur in all microregions. The microregion of Gurupi, for example, has a socioeconomic, sociocultural and schooling level that stands out among the others. However, the Gurupi region does not rank as the best in terms of infrastructure and school resources. Thus, it can be inferred that the factor infrastructure and school resources, although important, is not the main inhibitor of low schooling, but the socioeconomic and sociocultural factor of the individual that brings the student's out-of-school relationship to its core. In view of the scenario presented among the four indicators that make up the Socio-Educational Inequality Index (Idsed), we start now to analyze the whole, that is, the index itself. It should be noted that Idsed has its minimum variation of zero (0.00) (extreme inequality) and maximum, one (1.00) (equality situation). Thus, Figures 4 &5 shows the map of the Idsed of the 5th grade and 9th grade of elementary school of the state network.
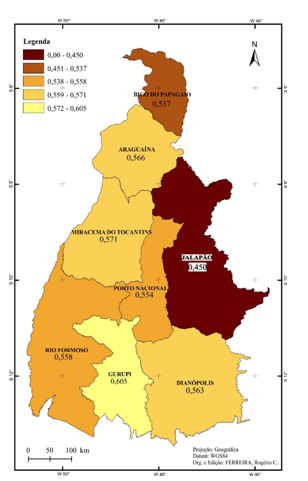
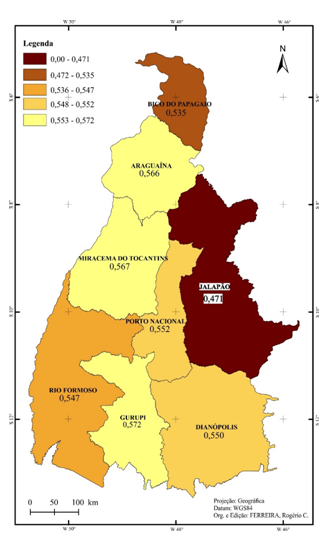
In general terms, in relation to students in the fifth grade of elementary school, it is observed that only the Jalapão micro-region is in the high level of socio-educational inequality (0.00 to 0.499), with 0.450 respectively. The others have a mean level of socioeducational inequality, that is, between 0.500 and 0.799, with the following indices: Araguaína (0.566), Bico do Papagaio (0.537), Dianópolis (0.563), Gurupi (0.605), Miracema do Tocantins, Porto National (0.554) and Rio Formoso (0.558) (Figure 1). The Idsed for students in the 9th grade of elementary school show higher levels of socioeducational inequality than in the 5th grade. The only regions that maintained or improved the level of sócio-educational inequality were the microregions of Araguaína (0.566 in the 5th grade to 0.566 in the 9th grade) and Jalapão, which still continues with a high socio-educational inequality index (0.450 in the 5th grade to 0.471 in the 9th grade). The others increased their levels of socio-educational inequality significantly, and the Gurupi microregion was the one with the highest socio-educational gap among students in the 5th and 9th grades of elementary school. While students of the 5th grade have a rate of 0.605, obtaining the best average among the other microregions, the students of the 9th grade obtained a level of socio-educational inequality of 0.572, that is, increased the level of inequality.
Graph 3 above shows that socio-educational inequality in Tocantins is slightly more pronounced in the 9th grade (0.552) than in the 5th grade (0.557) of elementary school. The comparison between the microregions and the Tocantins reveals that the levels of socio-educational inequality are more accentuated in the micro regions of the Bico do Papagaio and Jalapão. These two regions are characterized by the high rate of illiteracy among the population aged 15 and over. Consequently, a region that has a large number of illiterates among the population that is entering the population of economically active people, ends up favoring the low distribution of per capita household income in minimum wages. This is the case in the two microregions highlighted, which are characterized by having, for the most part, a population contingent that receives up to one (1) minimum wage. The other microregions are close to the Tocantins index, with Gurupi (0.605/5th grade, 0.572/9th grade), Araguaína (0.566/ 5th grade, 0.566/9th grade) and Miracema do Tocantins (0.571/9th grade) for being above the Tocantins' average. In view of this context, in which the educational inequalities present among the Tocantins' microregions reflect broader regional inequalities, it can be inferred that part of the regional inequalities presented here, based on some social indicators and comparative indicators of Idsed, can be explained by the social composition of the populations of each region, that is, by the social origin of the young, which greatly affects their educational level. Regions with higher proportions of people coming from families with socioeconomically and socio-culturally disadvantaged characteristics tend to present lower levels of education, as is the case of the microregions of Bico does Papagaio and Jalapão.
The Socio-educational Inequality Index (Idsed) created from microdata of the Basic Education School Census of 2013, contained in the National Institute of Educational Studies and Research Anísio Teixeira (Inep), the contextual socioeconomic questionnaire of Prova Brasil held in 2011 and of the School Registration form available on the website of the Ministry of Education allows a wide socio-educational situation evaluation of a locality, being it place or region. The diagnosis presented, especially in relation to the regional differences between the micro-regions, related to education, drew attention to the importance and necessity of analyzing, in addition to student performance, the extracurricular contextual factors that could be the educational system and society in general, in this case the socioeconomic factor and the sociocultural factor. Thus, the Socio-educational Inequality Index (Idsed) developed in the study may contribute to other studies that seek to evaluate the effect of school education and extracurricular factors, allowing a greater understanding of school disarrangements and regional inequalities. Thus, based on the development of this index, it was possible to map socio-educational inequalities among the microregions of Tocantins. It was observed that the regions with low schooling are the same regions where socioeconomic and sociocultural indicators are low as well. This is evidenced by linking the socioeconomic indicators of the Jalapão and Bico do Papagaio micro regions with their transition educational rates. Both have the largest contingent of illiterate people living on incomes, these factors alone increase the chances of school failure among students. Thus, in a broader perspective, Idsed also allowed us to assess to what extent the State, with its public and territorial policy options, is reproducing inequalities or acting to overcome them. In addition, with the development of this indicator of inequality, it was possible to evaluate the conditions of inequality, marginality and fragility present in the Tocantins state education network, since this indicator starts from the understanding that the social relations of capitalist production are unequal and project such inequalities, proper to the conditions of access to the market, in the structuring of schools, according to the material and symbolic assets that the beneficiaries of this service have, thus reproducing the same inequalities in the education of the student.
Inequality, despite its most varied forms of manifestation, seems to be present among the Tocantins' microregions as a common denominator of the various patterns of development, creating new social divisions. Both poor and rich can be found everywhere, even though their poverty and wealth patterns are distinguished eminently. In this context, in terms of the implications of public policies, this situation requires a combination of local and regional policies, aimed at generating jobs, expanding access to quality social services and, above all, regulating capital flows. Thus, the study suggests that as long as there are no more effective mechanisms that can drastically reduce the weight of the social origin of young people, a reduction of regional inequalities is not to be sought so soon. The results showed that, as it is today, the educational system of Tocantins, faced with social reality, has minimal capacity to reduce the link between origin and destination in a highly stratified society. Recalling that in the short term, the school system is not able to change the contracted attributes of people and their families. Finally, the issues discussed here remain unfinished, because the material factors that generate socio-educational inequalities insist on existing in time and space. Thus, these inequalities are produced and reproduced in the present, kept in the right proportions, just as in the past. Research such as this helps to clarify the process of producing inequalities and demonstrates that differences in performance may be the reproduction of a history of social inequalities.
None.
The author declares that no conflicts of interest exist in publishing this article.

©2019 Oliveira, et al. This is an open access article distributed under the terms of the, which permits unrestricted use, distribution, and build upon your work non-commercially.