MOJ
eISSN: 2573-2919


Research Article Volume 8 Issue 1
1Research Scientist, Department of Surveying and Geomatics, RSU, Nigeria
2Research Student, Department of Surveying and Geomatics, RSU, Nigeria
Correspondence: Eze Promise I, Research Scientist, Department of Surveying and Geomatics, RSU, Port Harcourt, Nigeria
Received: January 02, 2023 | Published: January 27, 2023
Citation: Eze PI, Kaboufou GW, Douglas RI. Suitability mapping of solid waste disposal sites in Obio/Akpor local government area: rivers state of Nigeria. MOJ Eco Environ Sci. 2023;8(1):1-7. DOI: 10.15406/mojes.2023.08.00266
Obio/Akpor Local Government Area of Rivers State have constantly witnessed Rapid City growth and increased urbanization due to persistence rural-urban migration and the quest for human to meet their needs and wants. This has increased solid waste generation and unregulated dumping of solid wastes in unapproved sites. This prompted the need for this study which is aimed at mapping the suitability of solid waste sites in the study area with the objective of identifying the spatial locations and development of a database of suitability or otherwise of solid waste disposal sites. Ground survey and Geospatial techniques were utilized for data acquisition, manipulation and processing. Garmin 78csx GNSS receiver was used in observing the coordinates of ground positions of all solid waste disposal sites in the study area, the obtain coordinates were charted on the Google earth imagery (2022) and Open Street Map (OSM) (2022) to ensure the positions falls within the shape-file of the study area, On-Screen vectorization was perform using the point, line and polygon spatial tools in the QGIS 3.22 bialowieza software environment to determine the position and extent of solid waste sites under study. Proximity analysis was performed in QGIS environment for buffer of 200m, 500m and 1km to ascertain the suitability of solid waste collection centers and dumpsites base on global standard and proximity maps were produced. A total of (114) solid waste disposal sites were mapped, with (27) legal and (73) illegal collection points and (2) suitable and (12) unsuitable dumpsites respectively. The study also revealed that Elelenwo community in ward 6 has the highest (12) whereas Egbelu Ozodo community in ward 16 has the lowest (1) number of collection sites in the study area. Immediate review and enforcement of solid waste disposal and management laws is needed to forestall likely environmental hazards resulting from indiscriminate dumping of refuse in the study area.
Keywords: dumpsites, geospatial, proximity, vectorization, mapping
Human impacts in the environment have reached an unprecedented intensity and affects the whole world due to its vastly increasing population and higher consumption.1 One of the factors that affect the degradation of the environment is population growth and industrialization around the globe does not only reflect on the natural environment but has also resulted in massive quantity of solid waste generation.2 The problem of solid waste is severe in urban areas because of migration from rural areas due to the search for employment and better quality of life, improper disposal of solid waste leads to environmental problems like air, soil and land pollution thereby affecting the quality of life. As urbanization takes place, there is an increasing need for various amenities that will aid subsistence and this has simultaneously increased productive activities.
Akue,3 opined that environmental problem arises as a result of increased population and a quest for man to satisfy his daily needs and wants.
Waste is any material or substance that is not useful to the individual or organization generating them.4 It is referred to as an unwanted material resulting from domestic, industrial or economic activities which must be disposed or any substance which is in the solid, semi-solid, liquid or gaseous state that remains as a residue from any other substance or material which has no use to the organism, organization or system that produces it. However, solid waste refers to any waste that is in the solid state and as long as man engages in the production of goods and rendering of services in order to satisfy his daily needs, solid waste would continually be generated, it is the act or process of disposing solid wastes, it refers to the orderly process of finally disposing solid waste, and it could be the collection (temporary storage) and processing of solid waste.5
In an attempt for man to satisfy his daily needs, he engages in different productive activities which involves the generation of waste. This waste can be classified into three major groups based on their sources and composition; solid, liquid and gaseous, amongst this classification; solid waste is the most difficult to manage because it does not flow, dissolve or evaporates.6 Solid waste occupies a geographical space and are classified based on their sources which are municipal (domestic, institutional and commercial), agricultural, mining and mineral, radioactive and industrial waste. Among these sources, industrial and municipal solid wastes contribute immensely to the volume of solid wastes.7
Obio/Akpor is one of the most developed Local Government Area in Rivers State of Nigeria. Due to its high population density and continual development, there is an influx of solid waste which has resulted to the improper disposal of solid waste across the local government, according to Rivers State Waste Management Agency (RIWAMA) regulation; solid waste are to be disposed in approved collection site which has been spatially distributed in Rivers State known as receptacle which can be seen either in the form of a container (bin) or a mini fenced area where compactors can then convey these solid waste to the final disposal site referred to as the dump site but solid waste are currently disposed at undesignated collection site and some of these solid wastes at these sites are not evacuated immediately while at some site, solid waste are not collected over a long period and some wastes are continually disposed there making there an illegal dump site. The problem of waste management is becoming more complex due to the increasing rate of urbanization. The volume of solid wastes generated daily in Nigeria has been increasing population growth, urbanization, industrialization and economic growth.7
The significance of this study is such that it will be useful to RIWAMA cum the physical planning and urban development section of Obio/Akpor Local Government Area in the planning, control and regulation of solid waste disposal sites in the study area. The study will also provide information about solid waste collection points and dumpsites in the study area to the residence. Plate 1 and Plate 2 shows some of the impacted areas in the study area.
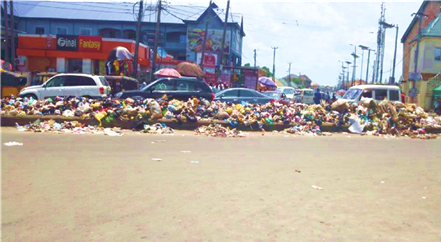
Plate 1 Solid waste disposed at the median of iwofe road, Rumuolumeni Town.
Source: Author’s Field data, 2022
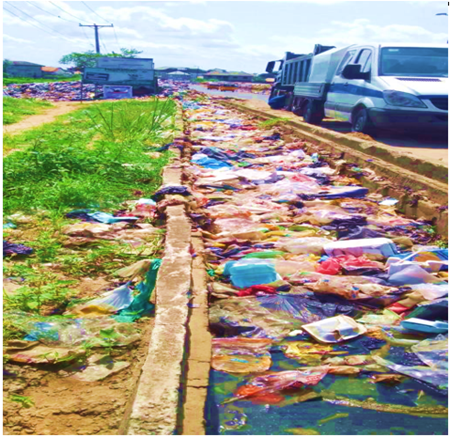
Plate 2 Solid waste dumped in drainage facility along St. Johns - Ogbogoro road of the study area.
Source: Author’s Field data, 2022
Study area description
Geography
Obio/Akpor Local Government Area falls within the Metropolitan region of Port Harcourt, the oil and gas hub of Nigeria with headquarters at Rumuodumaya Town, it is one of the major cities of the Niger Delta located in Rivers State and is bounded in the South by Port Harcourt City Local Government area, Oyigbo and Eleme to the East, Etche and Ikwerre to the North, and Emohua to the West.8 It is situated approximately 25km from the Atlantic Ocean and is between the Dockyard creek/bonny river and the Amadi creek. It has a land mass of about 311.71km2 and approachable through land, water and air and the area belongs to the south-south regions of Nigeria or otherwise known as Niger delta region.9 It lies within the projected coordinates of point (P1) 532031.104m.N, 295165.320m.E and (P2) 530295.765m.N, 268285.080m.E in (UTM, Zone 32N).
Population
Obio/Akpor LGA is a maritime state in the southern geopolitical region Nigeria; with inhabitants of 464,789 (National Population Commission, 2006 in Wali, Abdullahi, Stephen and Amadi, 2021).10 The study area is influenced by industrialization or urban sprawl where small communities have merged and formed megacity due to high influx of people resulting to rapid growth of population overtime.
Topography
The Local Government Area is a lowland area with an average elevation below 30m above sea level. Significant changes in the land Use/ land cover in the area include changes in water bodies, built-up areas, and depletion of the mangrove vegetation along rivers and creeks shorelines, vegetation, and wetlands The local government area is rich with land and natural resources, such as land, soil, vegetation, water, coal, petroleum, gas, animals, wildlife, air, wind and atmosphere, clay, and sand.11
Climate
The study area enjoys tropical hot monsoon climate due to its latitudinal position. The tropical monsoon climate is characterized by heavy rainfall from April to October ranging from 2000 to 2500 mm with high temperature all the year round and relatively constant humidity. The relief is generally lowland which has an average of elevation between 20 and 30m above sea level. The geology of the area comprises basically of alluvia sedimentary basin and basement complex. The vegetation found in this area includes raffia palms, thick mangrove forest and high rain forest. The soil is usually sandy or sandy loam underlain by a layer impervious pan and is always leached due to the heavy rainfall experienced in this area. The study area is well drained with both fresh and salt water. The salt water is caused by the intrusion of sea water inland, thereby making the water slightly salty. Due to continuous heavy rainfall and river flow, the study area experiences severe flooding almost every year Annual rainfall ranges between 2100mm-4600mm as reported by Nigerian Meteorological Agency and the mean temperature ranges between 30.0°C – 33.0°C (Figure 1).9
Instrument selections; Instruments used in course of this research work are; Garmin 78csx GPS receiver, 100m Steel tape, Personal Protective Equipment (PPE), field book, calculator and car for transportation (Table 1).
S/N |
Software |
Hardware |
1 |
QGIS |
Laptop |
2 |
Microsoft Word |
Phone |
3 |
Microsoft Excel |
Camera |
4 |
Google Earth Satellite imagery |
Printer |
5 |
UTM Geo Map |
Garmin 78csx GNSS Reciever |
6 |
Open Street Map |
Accessories |
Table 1 Software and hardware selection
GPS instrument test
The handheld Global Positioning System (GPS) receiver, (Garmin 78csx) was tested in order to ascertain if the instrument is within allowable accuracy limit of 3m (three meters), the test was carried out in three ways (Table 2).
STN |
Observe value |
Known value |
Difference |
|||
|
Easting (m) |
Northing(m) |
Easting (m) |
Northings(m) |
Easting (m) |
Northing (m) |
SVG/GPS 002 |
275963 |
530903 |
275962.761 |
530903.2 |
0.239 |
0.2 |
WGPS 003 |
275993 |
530933 |
275992.841 |
530933.315 |
0.159 |
-0.315 |
Table 2 Difference between observed coordinates and known coordinates of base station
Data acquisition
Secondary data sources: Attribute information of some solid waste collection points and legal dumpsites in the study area.
Primary data sources
Reconnaissance Survey: field reconnaissance was carried out, several solid waste disposal sites such as collection points and dump sites were visited, and photographs were also taken cum attribute information of the ward and communities in the study area.
Point Positioning: GPS observation was carried out based on the principles of GPS positioning. The precise travel time of the signal is necessary to determine the distance, or so-called range, to the satellite. Since the satellite is in an orbit approximately 20,200 km above the Earth, the travel time of the signal will be roughly 0.07 sec after the receiver generates the same signal. If this time delay between the two signals is multiplied by the signal velocity (speed of light in a vacuum) c, the range to the satellite can be determined from;
r = c × t (1)
Where (r) is the range to the satellite, (t) is the elapsed time for the wave to travel from the satellite to the receiver and (c) is the range to the satellite.
Satellite receivers in determining distances to satellites employ two fundamental methods: code ranging and carrier phase-shift measurements, from distance observations made to multiple satellites, receiver positions are be calculated.12
Ground truthing (Measurements/Observations): GPS receiver (Garmin 78csx) was used to obtain the coordinates of various solid waste disposal units, camera was also used to take photographs of various solid waste disposal units (collection points and dumpsites) in the study area. The spatial and attribute information of the various solid waste collection points and dumpsites were also taken which is premised on one of the first objective of this research work which is the obtaining of geospatial (spatial and attribute) data of various solid waste disposal unit in the study area.
Charting of coordinate points: The coordinate acquired were charted on Google earth satellite imagery to ascertain if the position of the various disposal points (collection points and dump sites within the study area) is within the study area and this was achieved by launching Google earth and importing the shape-file of the study area (Figure 2).
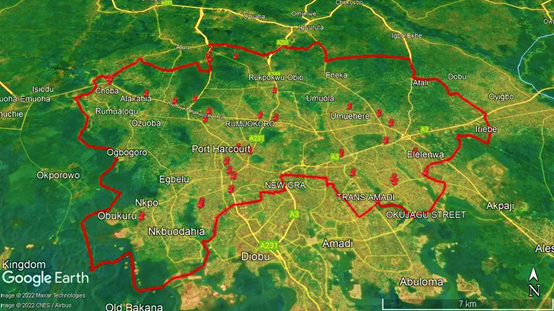
Figure 2 Charting of coordinates of illegal collection points within Obio/Akpor LGA.
Source: (Google Earth Imagery, 2022)
On screen vectorization: is the method of tracing geographic features from another dataset (usually an aerial, satellite image, or scanned image of a map) directly on the computer screen. In this research work, after importing the shape file of the various disposal points to QGIS environment as a layer, an open source data known as Open Street Map (OSM) was used to show the roads leading to the various disposal points and other necessary features needed for the map where some vector operations were also performed.
Proximity analysis: The proximity of dumpsites and collection points to the neighborhood was analyzed using the National Environmental Standard Regulation Enforcement Agency (NESREA) standard/criteria as noted by Tukura et al.,13 for siting a dump site which is 200m, 500m and 1000m on dumpsites away from built-up areas, roads and drainages and water bodies respectively within the study area. In reference to NESREA standard, radius of 200m, 500m and 1000m were taken and buffered on the map. For each buffer, a distinct color was used and the buffer was dissolved on each of the buffer distances (to avoid overlap of buffer). The Proximity between collections points were also analyzed using buffer of 200m and 500m.
Spatial and attribute data
The first result is hinged on the first objective of this research work which is to obtain spatial and attribute data of solid wastes disposal units (collection points and dump sites) (Table 3).
S/N |
Locations |
Easting (m) |
Northing (m) |
Status/Remark |
Feature type |
1 |
Opposite Tonninno Filling station, besides Anglican church, Ada-George junction Rumueme |
276098 |
532052 |
Receptacle |
Point |
(suitable) |
|||||
2 |
Opposite St. John’s Anglican Church, cemetery ikwerre road, market junction Rumueme |
276128 |
533861 |
Open dump |
Point |
(unsuitable) |
|||||
3 |
Besides Rivers State College of Health, Agip Junction Ikwerre road Rumueme |
276311 |
532842 |
Receptacle |
Point |
(suitable) |
|||||
4 |
Elioparanwo road, off wimpey mile 4, Rumueprikom |
275881 |
534220 |
Open dump |
Point |
(unsuitable) |
|||||
5 |
OPM road off Iwofe road Rumueme |
273755 |
533369 |
Borrow Pit |
Polygon |
273751 |
533361 |
(unsuitable) |
|||
273746 |
533343 |
||||
273749 |
533342 |
||||
273740 |
533298 |
||||
273745 |
533298 |
||||
273727 |
533245 |
||||
273715 |
533239 |
||||
273720 |
533238 |
||||
273714 |
533218 |
||||
273690 |
533222 |
||||
6 |
Mgbuoshimini junction besides Primary Health care center, Rumueme |
275482 |
531682 |
Receptacle |
Polygon |
275480 |
531683 |
(suitable) |
|||
275487 |
531687 |
|
|||
275491 |
531683 |
||||
7 |
No 470 Ikwerre road, Rumuokwuta |
276900 |
535585 |
Open dump |
Point |
(unsuitable) |
|||||
8 |
611 Ikwerre road by MCC 1st gate |
277363 |
536865 |
Receptacle |
Point |
(suitable) |
|||||
9 |
Beside Zenith bank, Rumuokoro |
277379 |
538398 |
Open dump |
Point |
(unsuitable) |
|||||
10 |
Nkpolu junction, opposite Chicken Hills |
276114 |
538547 |
Median of road |
Line |
276096 |
538549 |
(unsuitable) |
|||
11 |
Beside Rumuapara Secondary school, Nkpolu Rumuigbo, East west road |
275486 |
538654 |
Open dump |
Polygon |
275486 |
538637 |
(unsuitable) |
|||
275443 |
538644 |
||||
275445 |
538660 |
||||
12 |
Close to Rumuapara Secondary school, East west road |
275281 |
538651 |
Median of road |
Line |
275252 |
538655 |
(unsuitable) |
|||
13 |
Mercy land junction, East west road |
275015 |
538685 |
Median of road |
Line |
274983 |
538689 |
(unsuitable) |
|||
14 |
Close to Jephthah School, East West road |
274403 |
538754 |
Open dump |
Point |
(unsuitable) |
|||||
15 |
Besides Wazobia FM, Rumuosi |
272274 |
539695 |
Open dump |
Point |
Unsuitable) |
|||||
16 |
Opposite Obama Liquid Filling Station, Alakahia East west road |
270489 |
540364 |
Median of road |
Line |
270463 |
540370 |
(unsuitable) |
|||
17 |
Beside MTN office, East West road |
270415 |
540367 |
Open dump |
Point |
(unsuitable) |
|||||
18 |
Opposite UPTH, Choba |
269846 |
540522 |
Median of road |
Line |
269759 |
540561 |
(unsuitable) |
|||
19 |
Opposite Choba Market |
267775 |
541856 |
Open dump |
Point |
(unsuitable) |
|||||
20 |
Opposite Everyday Supermarket, Choba |
267935 |
541822 |
Open dump |
Point |
(unsuitable) |
|||||
21 |
Along East West road, Choba |
269193 |
540820 |
Borrow Pit |
Polygon |
269201 |
540828 |
(unsuitable) |
|||
269159 |
540859 |
||||
|
|
269150 |
540848 |
|
|
Table 3 Spatial and attribute information of some solid waste disposal units
Pictorial highlights of some disposal points within the study area (Plates 3–5);
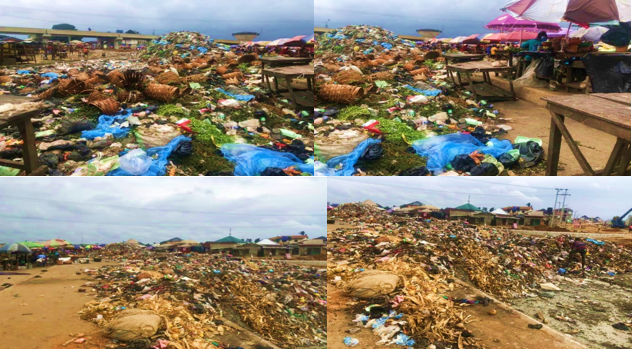
Plate 3 Illegal dump at tank market, opposite Sobaz Filling, rumuokwurusi town.
Source: (Author’s field data, 2022)
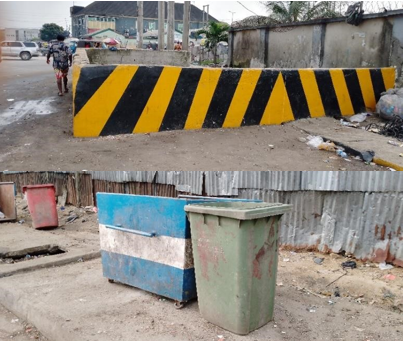
Plate 5 Approved Receptacles; a: mini-fenced area, b: Container/bin.
Source: (Author’s field data, 2022)
Spatial pattern analysis
The third result is hinged on the third objective of this research work which is to analyze the spatial pattern solid waste disposal points within the study area (Table 4) (Table 5) (Figures 3–7).
S/N |
Solid waste disposal points |
Number of locations |
1 |
Legal Collection Point |
27 |
2 |
Illegal Collection Point |
73 |
3 |
Legal Dumpsites |
2 |
4 |
Illegal Dumpsites |
12 |
5 |
Total |
114 |
Table 4 Category of solid waste within the study area
Address |
Eastings (m) |
Northings (m) |
Buffer radius (m) |
Features within Buffer zone |
Remark |
Along Airport road, Rumuosi (old and new Dump sites) |
274242 |
542364 |
200 |
Buildings |
Impacted; There are few buildings within |
500 |
Road |
Impacted; Airport road, |
|||
Rumuosi. The consequence is the littering |
|||||
|
|
1000 |
Waterway |
Not impacted; No water way/ river channel |
Table 5 Buffering analysis result for siting dumpsites
Table 3 presents the spatial and attribute data of various solid waste disposal points within the study area that was obtained during data acquisition. It was observed that there are more illegal collection points and dumpsites than legal in the study area; the result revealed that there are one hundred and fourteen (114) collection points in the study area and that out of the one hundred and fourteen (114), there are seventy-three (73) illegal collection points, twenty seven (27) legal collection points, twelve (12) illegal dumpsites and two (2) legal dumpsites. The legal collection points within the study area are the receptacle which are approved by the Rivers State Waste Management Agencies (RIWAMA) which is either a mini fenced area or a container/bin (Plate 5) while the illegal collection points are sited on open plots of land, along the road and on the median of roads in the study area. Plate 3 and Plate 4 shows some of the various solid waste disposal points within the study area.
Table 2 presents the criteria based on proximity of dumpsites to the neighborhood, also Table 3 presents the criteria based on proximity of various collection points. Buffering operation were carried out, buffer of 200m, 500m and 1000m away from built up area, road and waterways respectively as specified by NESREA and this analysis revealed that all the illegal dumpsites has built up areas, drainages (waterway) and roads within the 200m, 500m and 1000m buffer zone and thereby has negative effect/impact to the residents of the various locations due to its drastic stench and habitat for various rodents and insects, the residents around the buffer zone are prone to ill health like malaria, cholera etc. and this waste also blocks drainages thereby leading to flooding and littering the roads. Proximity analysis done on the dumpsites (Figure 6) revealed that few buildings falls within the 200m buffer zone most of which are not residential building and the 500m distance from the road does not also conforms with NESREA standard, the road is also within the buffer zone of 200m thereby littering the road and this can also be transported to the drainage facility during rainfall.
The proximity analysis of collection points was done using buffer of 200m and 500m reveals that most of the collection points within the study area are more than 500m away from the next collection point on the same route and there are most communities in the study area that does not have legal collection points and this has resulted to illegal or indiscriminate disposal of solid waste and also that communities that have legal collection point only have fewer collection point and noted by Akpotareno.14 This is reflected in the study area in the aspect of illegal waste disposal as residents are unwilling to travel far distances to dispose their waste.
The spatial distribution of solid waste within communities as shown in Figure 6, shows the category of solid wastes within the study area while Figure 4 presents the percentage of solid waste disposal points; 64% of points within the study area are illegal collection point while 24% are legal collection point, 10% are illegal dumpsite and 2% are legal dumpsites.
Figure 6 presents the composite map which consist of legal and illegal dumpsites cum collection points (receptacle and median of roads) are represented with different point colors. The composite map shows that illegal disposal of solid waste is clustered around places where there are more built up areas (population).
Pictorial highlights of solid waste disposal sites as shown in Plates 3–5 indicates that solid wastes are dumped indiscriminately at unapproved and unsuitable sites, such as median of road, public school premises, abandoned sand mining sites (known as Borrow pit), market places and drainage facility. The study also revealed that already dumped solid waste at several collection centers in the study area have been abandoned and making the urban residence vulnerable to the hazard of air pollution which is detrimental to human health.
The focal point of this research was to map solid waste disposal points (collection sites and dumpsites) within Obio/Akpor Local Government Area, Rivers State of Nigeria and to provide vital information that would be useful to RIWAMA in curbing indiscriminate disposal of solid waste in the study area. The results obtain justify the quest for this study which have been achieved with stated objectives. The result revealed that there are more illegal disposal points than legal and that all the illegal disposal point does not meet the NESREA standard and is thereby detrimental to the health of residents within that vicinity. Further analysis revealed that there are fewer legal collection point and some of the collection points does not conforms to WHO standard which has also constituted to the indiscriminate disposal of solid waste.
Recommendation
The study recommends immediate suspension of solid waste disposal in unapproved sites and removal of all unsuitable dump sites and collection sites identified among others;
Special thanks to the management of the Rivers State Waste Management Agency (RIWAMA) for making available some basic data and information which assisted greatly in making this study a successful one.
None.
The authors declared that there is no conflict of interest.

©2023 Eze, et al. This is an open access article distributed under the terms of the, which permits unrestricted use, distribution, and build upon your work non-commercially.