MOJ
eISSN: 2576-4519


Research Article Volume 10 Issue 1
 Vadim V Verbov, Zinovii M Nykyforak, Ievgen V Cheshuk, Milan V Vorodi
Romodanov Neurosurgery Institute of National Academy of Medical Sciences of Ukraine, Ukraine
Correspondence: Oleksii S. Nekhlopochyn, Department of spinal neurosurgery, Romodanov Neurosurgery Institute of National Academy of Medical Sciences of Ukraine, Ukraine, Tel +380 44 483-94-13
Received: February 03, 2026 | Published: February 17, 2026
Citation: Nekhlopochyn OS, Verbov VV, Nykyforak ZM, et al. CT-based assessment of posterior ligamentous complex integrity in AO spine type A1–A2 thoracolumbar junction fractures under conditions of diagnostic uncertainty. MOJ App Bio Biomech. 2026;10(1):10-20. DOI: 10.15406/mojabb.2026.10.00237
Purpose: The diagnosis of posterior ligamentous complex (PLC) injury in thoracolumbar fractures remains a major challenge under conditions of diagnostic uncertainty, particularly when magnetic resonance imaging (MRI) is unavailable or delayed. This study aimed to develop and internally validate a quantitative CT-based model and a clinical nomogram for predicting PLC status in AO Spine type A1–A2 fractures using machine learning–guided morphometric analysis.
Methods: CT and MRI data from 90 patients with thoracolumbar junction injuries were retrospectively analyzed, including 43 patients with AO Spine type A1–A2 fractures used for model development. Key morphometric parameters, including the acute interspinous expansion angle (AIEA), anterior-to-posterior height ratio (A/P), and bone density expressed in Hounsfield units (HU), were measured. An extreme gradient boosting (XGBoost) algorithm was used to estimate feature importance, which subsequently informed the development of an interpretable 10-point scoring scale and a logistic regression–based nomogram. Model performance was assessed using the area under the receiver operating characteristic curve (AUC) and calibration analysis with bootstrap correction.
Results: The scoring scale identified AIEA and the A/P ratio as the most influential predictors, contributing 10.0 and 8.5 points, respectively. The score-based model demonstrated high discriminatory performance with an AUC of 0.944 (95% CI: 0.912–0.976), exceeding that of the baseline machine learning model (AUC = 0.836). Each additional point on the scale was associated with a 31% increase in the odds of PLC injury (odds ratio 1.31, p < 0.05). Calibration analysis showed good agreement between predicted and observed probabilities across the clinically relevant risk range (MAE = 0.041).
Conclusion: The proposed CT-based prognostic model provides an objective and transparent tool for risk stratification in AO Spine type A1–A2 thoracolumbar fractures. By quantifying the probability of occult posterior instability, the nomogram supports evidence-based decision-making regarding the need for MRI and surgical stabilization in acute thoracolumbar trauma.
Keywords: thoracolumbar junction fractures, posterior ligamentous complex injury, CT-based prognosis, AO spine classification, machine learning, XGboost algorithm, nomogram, occult instability
CT, computed tomography; PLC, posterior ligamentous complex; TLJ, thoracolumbar junction; MRI, magnetic resonance imaging; XGBoost, eXtreme gradient boosting
Traumatic injuries of the thoracolumbar junction (TLJ) (Th11–L2) account for a significant proportion of all spinal traumas and represent one of the key challenges in modern vertebrology.1 The high incidence of injuries in this zone is attributed to its biomechanical characteristics: the transition from the rigid thoracic spine to the more mobile lumbar segment creates a stress concentration area vulnerable to axial, flexural, and rotational forces.2 According to epidemiological studies, fractures localized at the TLJ constitute up to 60–90% of all injuries involving the thoracolumbar spine (Th1–L5) as a whole.3,4 The primary mechanisms of injury include falls from heights and motor vehicle accidents, predominantly affecting individuals of working age, which confers a pronounced socioeconomic significance to the problem.5
Injuries to the TLJ are often accompanied by sagittal imbalance, the formation of post-traumatic deformities, and the development of neurological deficits. Even in the absence of primary neurological impairment, instability of the damaged segment can lead to chronic pain syndrome, progression of kyphotic deformity, and a reduced quality of life.6 Collectively, these factors underscore the necessity for precise morphological assessment of the trauma and a well-founded choice of therapeutic strategy.
In recent decades, efforts have been made to standardize the treatment of spinal trauma based on unified classification systems. One of the most widely used is the AO Spine classification, which is based on a hierarchical principle, categorizing injuries by increasing severity—from compression fractures to rotational-translational injuries with gross instability.7 The implementation of this system has improved the objectivity of trauma descriptions and the consistency of clinical decisions.8,9 However, the AO Spine classification primarily relies on computed tomography (CT) data, which in some cases complicates its implementation.10
A key limitation of this system is the difficulty in assessing the state of the posterior ligamentous complex (PLC), the integrity of which is of fundamental importance for differentiating between stable and unstable injuries.11 Computed tomography only identifies indirect signs of PLC rupture, whereas isolated ligamentous injuries may occur without pronounced bony changes.12 This leads to diagnostic uncertainty, high inter-observer variability, and the frequent need to use the "M1" modifier (undetermined PLC status).13
Magnetic resonance imaging (MRI) is considered the "gold standard" for assessing soft-tissue stabilizing structures of the spine and allows for direct visualization of the PLC components.14 The highest diagnostic yield of MRI is achieved within the first few days post-injury, when edema and hemorrhagic changes in the ligamentous apparatus are most pronounced. Nevertheless, performing MRI in the acute period is often limited by method availability, time delays, and contraindications. Supplemental MR studies reveal clinically significant PLC ruptures in a substantial proportion of patients, often leading to the reclassification of an injury from Type A to Type B and a shift in treatment strategy toward surgical stabilization.15
The status of the posterior ligamentous complex is a pivotal factor in determining the treatment method. An intact PLC may allow for conservative management, whereas its rupture reclassifies the injury as unstable, requiring surgical intervention.16 Even morphologically simple compression fractures of the vertebral body must be considered distraction injuries (with different treatment indications) if a PLC injury is present.17
A number of studies convincingly demonstrate the absence of a single, reliable, pathognomonic CT sign of PLC injury. No individual radiological symptom possesses sufficient sensitivity and specificity for the confident diagnosis of a ligamentous tear.12,13
Conversely, literature presents works demonstrating the high diagnostic value of a combination of several CT signs. However, many of these studies utilize prominent and obvious changes as key criteria—such as gross widening of the interspinous space, clear dislocation of the facet joints, or multiple fractures of the posterior elements—cases where the fact of PLC injury typically does not raise clinical doubt.18,19 In real-world practice, such cases are relatively rare.
Significantly more often, changes are subtle or borderline, and no single CT sign carries independent diagnostic weight. In these situations, an objective assessment of the PLC is only possible based on a constellation of indirect manifestations, each of which may have low predictive value on its own but, in combination, reflects a failure of the posterior complex's stabilizing function.20
The active integration of high-performance statistical data processing into the modern scientific process, including multivariate analysis and machine learning algorithms (including deep learning), opens new opportunities for diagnostic optimization.21,22 These approaches allow for the identification of complex non-linear relationships between individual CT signs, increasing the accuracy of PLC injury risk stratification and enabling the development of reproducible clinical decision-making models.23
Identifying sets of indirect radiological signs with high diagnostic significance for posterior ligamentous complex rupture will improve the accuracy of non-invasive diagnostics, reduce dependence on emergency MRI, and bring clinical practice closer to the standardization of diagnostic algorithms. This, in turn, will facilitate a more reasoned choice of treatment tactics and improve outcomes for patients with thoracolumbar junction injuries.
Aim
The aim of this study is to develop an objective model for assessing the status of the PLC in injuries of the TLJ based on an analysis of a set of indirect CT signs using modern methods of multivariate statistical data processing.
Study design
The study was performed using a mixed-methods design, integrating analytical and clinical (modeling) components, which ensured a transition from a theoretical framework to empirical forecasting.
Analytical stage
At the first stage, a structured literature review was conducted to identify the most informative radiological signs and criteria for assessing PLC injury in TLJ trauma, with an emphasis on signs detectable via spiral CT without using MRI data as input parameters. The search for sources was carried out in international databases (PubMed, Scopus, Web of Science) without restrictions on the date of publication; original research and reviews in English were included in the review.24
To increase the specificity and accuracy of the search and minimize the number of publications that did not meet the study objectives, a combination of terms from the MeSH thesaurus and keywords in titles and abstracts (TIAB) was used.25 As part of the initial search in the PubMed database, the following search query was applied:
(“posterior ligamentous complex” OR “posterior ligament injury” OR “posterior ligamentous injury” OR “PLC injury”) AND (“thoracolumbar fracture” OR “thoracolumbar junction” OR “thoracolumbar spine”) AND (“computed tomography” OR CT OR “CT imaging” OR “radiological sign*” OR “indirect sign*”) AND (trauma OR traumatic) NOT (osteoporosis OR pediatric OR cervical OR sacral OR “spinal cord injury”)
In addition to the main query, a supplementary targeted literature search was performed, focusing on publications dedicated to the AO Spine classification of thoracolumbar spine injuries, the role of the PLC in determining injury stability, and the use of the undetermined PLC status modifier (M1):
(“AO Spine” OR “AO classification” OR “thoracolumbar classification”) AND (“posterior ligamentous complex” OR “ligamentous injury” OR “PLC”) AND (“computed tomography” OR CT) AND (thoracolumbar OR thoracolumbar junction)
Similar search strategies were adapted for the Scopus and Web of Science databases, taking into account the specifics of their search syntax.
Clinical stage
At the second stage, a retrospective single-center diagnostic study was performed with the construction and internal validation of a prognostic model (model development and internal validation study) based on the analysis of CT images and clinical data of patients with compression and burst fractures of the TLJ over a continuous 7-year period (2018–2024). The goal of this stage was to develop a model for predicting the probability of PLC injury based on a set of CT signs.
The study included patients with compression or burst vertebral body fractures of the TLJ who were initially assigned AO Spine Type A1–A4.7 Cases with obvious CT signs of PLC rupture, which presented no diagnostic uncertainty, were excluded as they did not correspond to the goal of developing a model for borderline clinical situations.
The presence or absence of PLC injury was considered a binary target outcome and was determined based on MRI and/or intraoperative data if the patient underwent surgical intervention. MRI verification included an assessment of the integrity of the supraspinous and interspinous ligaments, the ligamentum flavum, and the facet joint capsules.26 The study was approved by the local ethics committee.
Radiological parameters and measurement methodology
The definitions and measurement methodology for the CT parameters selected based on the structured literature search are presented in (Supplementary data) Table S1. All measurements were performed on standard sagittal, axial, and coronal CT reconstructions using the RadiAnt DICOM Viewer software package (Medixant, Poland; version 2023.1, license No. 1860F047). In cases of asymmetry, the value of the maximum expression of the sign was recorded. The measurement methodology for several quantitative parameters is illustrated in Supplementary Figure 1S.
Measurements of the radiological parameters under consideration were performed independently by three experts who had no access to clinical data or information about the outcome (the status of the PLC).27 To minimize subjectivity, quantitative data were averaged.28 In cases where significant inter-expert discrepancies (exceeding 2 standard deviations) were identified, a joint review of the CT scans was conducted to develop a unified diagnostic position for the specific case.29 To assess reproducibility, Mean Absolute Error (MAE) and Mean Absolute Percentage Error (MAPE) were calculated for quantitative parameters, along with Fleiss' Kappa (κ) for dichotomous traits.30–32
Statistical analysis
Data processing was performed in the R environment version 4.5.1 (R Core Team) using the RStudio IDE version 2025.05.1+513 (Posit).
Data preprocessing
Qualitative traits considered as potential predictors of PLC injury (type "present/absent") were converted into binary format (0/1). Quantitative variables (angles, distances, coefficients) were standardized by centering and scaling using standard statistical methods.33 For descriptive statistics, 95% confidence intervals for medians were estimated using nonparametric bootstrap resampling (2,000 iterations), and 95% confidence intervals for proportions were calculated using the Wilson score method.
Model construction
The XGBoost (eXtreme Gradient Boosting) decision tree method with a binary logistic classification function was used to predict PLC injury.34 Training and hyperparameter tuning were conducted using 5-fold cross-validation repeated 5 times, ensuring a robust evaluation of model quality. Hyperparameter optimization included tuning for learning rate, tree depth, and subsampling ratios. To address class imbalance, the scale_pos_weight parameter was adjusted based on the training set distribution. The area under the ROC curve (AUC) was used as the optimization criterion. Thus, the model belonged to the class of binary diagnostic models with a probabilistic output.
Model evaluation
Model accuracy was evaluated based on ROC analysis results with the calculation of AUC and 95% confidence intervals.35 Additionally, sensitivity and specificity indices were calculated at a standard threshold value of 0.5. To assess calibration, calibration curves with bootstrap correction (B = 200) were plotted. External validation of the model was not performed in this study.
Model interpretation
Predictor importance was evaluated by two methods: (1) the internal Gain metric in the XGBoost algorithm and (2) model-agnostic permutation importance. Partial dependence plots were constructed for key variables, reflecting the nature of the feature's influence on the probability of PLC injury.36
Prognostic scale
Additionally, an interpretable point-based scale was developed based on supervised binning of quantitative traits. For each value interval, the frequency of PLC injury was calculated, after which the values were normalized into a scale from 0 to 10 points. The patient's total score was used in a logistic regression model to convert it into the probability of injury. ROC analysis and calibration assessment were also performed to verify the scale.37
The study and presentation of results were carried out in accordance with the TRIPOD recommendations for the development and internal validation of prognostic models.38
Sample characteristics
The general morphological characteristics of the study cohort are presented in Table 1. The study included 90 cases of vertebral body fractures of the TLJ (AO Spine types A1–A4), with the majority of injuries localized at the Th12 and L1 levels.
|
Parameter |
Value |
|
Age, years |
41 (19–65) |
|
Sex |
|
|
Male |
58 (64.44%) |
|
Female |
32 (35.56%) |
|
Level of injury |
|
|
Th11 |
14 (15.6%) |
|
Th12 |
27 (30.0%) |
|
L1 |
41 (45.6%) |
|
L2 |
8 (8.9%) |
|
Vertebral body fracture type (AO Spine) |
|
|
A1 |
35 (38.9%) |
|
A2 |
8 (8.9%) |
|
A3 |
13 (14.4%) |
|
A4 |
34 (37.8%) |
Table 1 Morphological characteristics of the study sample (n = 90)
Note: Data are presented as n (%) unless otherwise stated. Age is provided as median (minimum–maximum). Sums may not equal 100% due to rounding.
Parameter measurement results
The measured values of morphometric indices and their reproducibility metrics are presented in Tables 2 and 3. Table 2 provides summary statistics for quantitative parameters (median and 95% confidence interval [CI]), along with inter-expert error estimates (Mean Absolute Error [MAE] and Mean Absolute Percentage Error [MAPE]).
|
Parameter (unit) |
Median |
95% CI |
MAE |
MAPE (%) |
|
CA (°) |
13.58 |
11.41–14.59 |
0.397 |
2.952 |
|
GA (°) |
17.78 |
16.38–19.18 |
0.645 |
3.954 |
|
RA (°) |
19.85 |
18.16–20.83 |
0.682 |
4.024 |
|
LKA (°) |
20.26 |
18.86–21.67 |
1.693 |
8.571 |
|
AIEA (°) |
88.41 |
85.44–93.39 |
1.921 |
2.242 |
|
ISD (mm) |
28.83 |
27.33–30.32 |
2.764 |
9.606 |
|
ISD ratio (—) |
1.77 |
1.55–2.07 |
0.134 |
7.717 |
|
ISA (°) |
9.11 |
7.63–10.59 |
0.843 |
8.765 |
|
A/P ratio (—) |
0.59 |
0.57–0.61 |
0.016 |
2.721 |
|
AVH ratio (—) |
0.65 |
0.63–0.68 |
0.014 |
2.202 |
Table 2 Quantitative CT Parameters and Measurement Reproducib
Note: Angular parameters are in degrees (°), linear parameters in millimeters (mm), and dimensionless ratios are marked with (—).
Table 3 shows the frequency of qualitative signs of injury and the inter-rater agreement coefficients (Fleiss' Kappa) for these dichotomous indicators.
|
Parameter |
Frequency, n (%) |
95% CI |
Fleiss' Kappa (κ) |
|
FBF |
42 (46.7%) |
36.1–57.5 |
0.851 |
|
VLF |
22 (24.4%) |
16.2–34.6 |
0.807 |
|
HLF |
5 (5.6%) |
1.8–12.5 |
0.702 |
|
FM |
31 (34.4%) |
24.7–45.2 |
0.421 |
|
FJW |
24 (26.7%) |
17.9–37.0 |
0.387 |
|
SPF |
31 (34.4%) |
24.7–45.2 |
0.771 |
Table 3 Qualitative CT signs and inter-rater agreement
Assessment of anatomical correlation between predictors
To simplify the predictive model, facilitate its clinical application, and enhance accuracy by eliminating multicollinearity, an analysis of the anatomical correlation between key morphometric parameters used in TLJ injury assessment was conducted. In the selection of potential features, physiological and biomechanical relevance is as critical as statistical significance. Interrelated parameters may provide redundant information, duplicating one another, which reduces diagnostic specificity and complicates interpretation. Consequently, particular emphasis was placed on the comparative assessment of angular parameters reflecting kyphotic deformity and indicators of PLC distraction, as these were the most numerous and diverse categories in our dataset.
Relationship between Cobb, Gardner, and regional angles
The Cobb angle (CA), Gardner angle (GA), and regional angle (RA) all describe the degree of kyphotic deformity in the injured segment; however, they characterize the functional response of the segment to trauma rather than the direct consequence of the injury. The integrity of the PLC limits post-traumatic kyphosis even in cases of significant vertebral body compression; therefore, with an intact PLC, these angles may remain close to normal. Nevertheless, certain patterns are observed. Specifically, the relationship between CA and GA depends on which endplate is fractured—superior or inferior.
This relationship is schematically shown in Figure 1: when the superior endplate is damaged, the Gardner angle is usually larger than the Cobb angle (Option A: CA < GA), whereas inferior endplate damage often results in the opposite relationship (Option B: CA > GA). In cases where both endplates are damaged approximately equally, the values of these angles converge (Option C: CA ≈ GA).
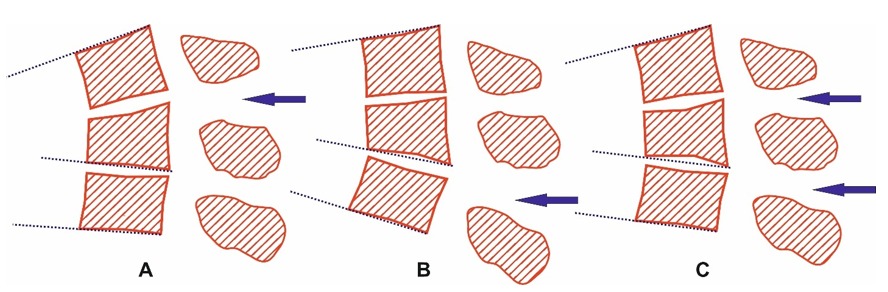
Figure 1 Schematic representation of vertebral body fracture morphology at the thoracolumbar junction in the mid-sagittal plane. Relationship between the Cobb angle (CA) and Gardner angle (GA) based on the localization of endplate disruption: A - cranial (superior) endplate injury (CA < GA); B - caudal (inferior) endplate injury (CA > GA); C - simultaneous injury of both endplates (CA ≈ GA).
Clinically, options A and B most often correspond to AO Spine type A1 and A3 fractures (where one endplate remains intact), while option C is more characteristic of type A2 or A4 fractures. However, no rigid dependence between fracture type and the CA/GA ratio was found: even with simultaneous damage to both endplates, the degree of wedge deformity is most often determined by the condition of the cranial (superior) endplate. In our cohort, the distribution of the Cobb-to-Gardner angle ratio was as follows (Table 4): in approximately 38% of cases (n=90), the Cobb angle was smaller than the Gardner angle, in 8% it exceeded it, and in the remaining ~54%, they were approximately equal (difference < 1°).
|
Injury type |
Damaged endplate |
N |
CA < GA (%) |
CA > GA (%) |
CA ≈ GA (%) |
|
A1 |
Superior |
21 |
17.78 |
0 |
5.56 |
|
Inferior |
14 |
2.22 |
7.78 |
5.56 |
|
|
A2 |
Both |
8 |
5.56 |
0 |
3.33 |
|
A3 |
Superior |
9 |
4.44 |
0 |
5.56 |
|
Inferior |
4 |
0 |
2.22 |
2.22 |
|
|
A4 |
Both |
34 |
20 |
5.56 |
12.22 |
Table 4 Distribution of the Cobb-to-Gardner angle ratio according to the type of vertebral body injury (n=90)
Note: Percentage values are relative to the total number of cases.
The prevalence of specific combinations depended on the nature of the vertebral body fracture. For example, in simple wedge compressions (A1), CA < GA is most typical, especially if the superior endplate is damaged. In burst fractures (A4) involving a height loss of the entire vertebral body, the angles are usually nearly equal (CA ≈ GA). A significant difference in the CA/GA angle ratio (CA/GA) between injury types was confirmed (Kruskal–Wallis test: χ² = 9.00, df = 3, p = 0.029).
When comparing GA and RA, an almost direct linear relationship was identified (Figure 2). This is expected, as the difference between the Gardner angle and the regional angle is determined solely by the individual angulation of the endplates of the adjacent uninjured vertebra (normally ±2° in the TLJ). In our sample, the Pearson correlation coefficient between GA and RA was 0.99 (95% CI 0.985–0.993; p < 0.0001), indicating that these metrics are virtually identical.
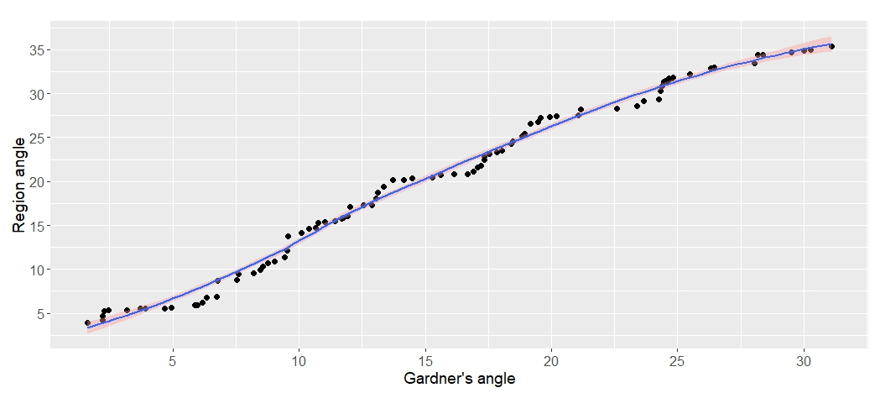
Figure 2 Correlation between Gardner angle (GA) and Regional angle (RA) in patients with traumatic injuries of the thoracolumbar junction. The scatter plot displays a near-perfect linear relationship (Pearson’s r = 0.99; 95% CI 0.985–0.993; p < 0.0001). The solid line represents the linear regression trend, and the shaded area indicates the 95% confidence interval.
Kyphotic deformity vs. posterior complex distraction
During the development of quantitative criteria for assessing the status of the PLC, we initially considered both angular parameters — the Cobb angle (CA) and Gardner angle (GA) — as well as indicators reflecting posterior complex distraction, such as interspinous distance (ISD) and interspinous angle (ISA). However, a detailed analysis of the gathered data, comparison with literature sources, and the geometric logic of trauma pathomechanics led us to conclude that limiting the final diagnostic model to two angular parameters, while excluding ISD and ISA as independent markers, was the most appropriate course of action.
The primary argument lies in the geometric nature of these measurements. An increase in the interspinous space or interspinous angle is invariably accompanied by a change in the spatial orientation of adjacent vertebrae. This realignment inevitably leads to an increase in the segmental Cobb angle, which captures the magnitude of kyphotic deformity between uninjured adjacent bodies. Consequently, an increase in ISD or ISA cannot occur while the Cobb angle remains normal, and an increase in the Cobb angle is necessarily combined with changes in interspinous metrics. Thus, the information provided by ISD and ISA is redundant, as it is already captured by Cobb parameters but expressed with lower reproducibility and greater variability.
In Type A1–A2 compression injuries, where the posterior complex remains intact, the segmental Cobb angle stays close to baseline because the adjacent intact bodies remain parallel. In these cases, the Gardner angle serves as the objective measure of deformity, as it accounts for the inferior endplate of the injured body and captures local wedging even when the ligaments are preserved. Due to this, GA proves to be more sensitive in pure compression fractures, whereas CA demonstrates changes only when the posterior complex is involved. Effectively, the combination of these two angular indicators covers both primary pathomechanical scenarios: GA captures compression without ligamentous injury, and CA captures posterior complex distraction.
The issue of reproducibility is also critical. Our data showed that for angular parameters (CA, GA, RA, AIEA), the Mean Absolute Error (MAE) ranged from 0.4° to 1.9°, with a Mean Absolute Percentage Error (MAPE) of 2.9–4.0%. In contrast, metrics related to the interspinous space demonstrated significantly higher variability: for ISD, the MAE reached 2.8 mm with a MAPE of 9.6%, and for ISA, the MAE was 0.84° with a MAPE of 8.8%. This confirms that angles provide higher measurement precision and inter-observer consistency. Literature frequently highlights that inter-rater agreement coefficients (κ) for angular parameters are substantially higher than for interspinous values, making them more reliable in clinical practice.
Furthermore, ease of use plays a vital role. The Cobb and Gardner angles are well-known and familiar to clinicians; their measurement is time-efficient and requires no complex additional constructions. In practical settings, this becomes a significant advantage, allowing for the integration of the methodology into routine examination protocols. Utilizing only two quantitative parameters not only simplifies the algorithm but also reduces the likelihood of errors, facilitates training, and increases the chances of widespread clinical adoption.
Consequently, the combination of Cobb and Gardner angles reliably covers both key mechanisms of deformity — compression with an intact posterior column and segmental kyphosis when it is damaged. This renders additional distraction indicators, such as ISD and ISA, redundant. While they may serve as auxiliary indirect signs in borderline cases, they are not essential for deciding whether a PLC injury has occurred. Reducing the set of quantitative criteria to two reproducible and well-validated angular parameters enhances the reliability, reproducibility, and clinical applicability of the proposed model without sacrificing diagnostic informative value.
Prognostic models
A critical stage in developing prognostic models is determining the degree of homogeneity within the analyzed sample. While using a single universal model for all types of compression and burst vertebral body fractures may seem clinically appealing, it often leads to reduced predictive accuracy. This is due to the pronounced heterogeneity of the morphological and biomechanical mechanisms underlying different subtypes within the AO Spine classification.
Specifically, Type A1 and A2 injuries are, in the vast majority of cases, characterized by relatively limited involvement of bony structures. In these scenarios, the clinical severity of the trauma is primarily determined by the degree of vertebral body deformity, as reflected by angular and linear morphometric parameters. Thus, the leading pathomechanical process is compression with local wedging, while the structural and functional integrity of the segment is formally preserved.
In contrast, Type A3 and A4 injuries are characterized by the loss of integrity in both the anterior and posterior walls of the vertebral body, resulting in multi-fragmentary comminution and frequently compromising the spinal canal. In these instances, angular deformity becomes a secondary consideration and cannot fully reflect the severity of the injury; instead, the degree of fragmentation and disintegration of the vertebral body becomes the key marker.
From a biomechanical perspective, this implies that in one group (A1–A2), the segmental deformity response to axial loading dominates, whereas in the other (A3–A4), structural instability due to the destruction of supporting elements prevails. Attempting to combine both groups into a single model creates a risk of multicollinearity among features, weakens the prognostic power of individual parameters, and diminishes the overall discriminatory capacity of the algorithm.
Therefore, to enhance accuracy and clinical validity, we deemed it appropriate to develop and validate separate prognostic models for Type A1–A2 and Type A3–A4 injuries. This approach accounts for the differences in injury pathomechanics, allows for the adaptation of predictor selection to the leading mechanism of injury, and increases the reliability of prognostic conclusions.
Model for type A1–A2 fractures
Methodology and predictive accuracy
The eXtreme Gradient Boosting (XGBoost) method was employed to predict PLC injury in Type A1–A2 compression fractures. The analysis included 43 patients with verified A1–A2 fractures; PLC injury was confirmed in a subset of these cases (target variable: Yes – PLC rupture present, No – PLC rupture absent). For each case, 12 potential predictors were analyzed, including the previously mentioned morphometric indices (angles, height ratios, qualitative signs, etc.).
Due to the relatively small sample size, model performance was evaluated using cross-validation. A stratified 5-fold cross-validation, repeated 5 times, was implemented to maximize the utility of the limited dataset and to average results across different splits, thereby increasing the reliability of the performance estimation. The area under the ROC curve (AUC) served as the primary quality metric, as it remains independent of the classification threshold and accounts for the sensitivity-specificity trade-off across the entire range. The resulting model demonstrated an average AUC = 0.836 (mean across 5×5 CV), indicating high discriminatory capacity: with approximately 84% probability, the algorithm assigns a higher predicted risk to a patient with a true PLC rupture than to one without. Figure 3 displays the averaged ROC curve, showing significant deviation from the diagonal line of random chance.
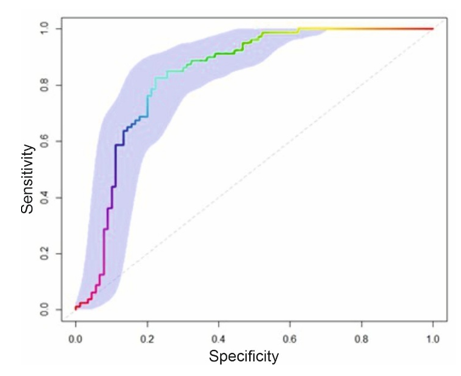
Figure 3 ROC analysis of the predictive model. The plot shows the trade-off between sensitivity and specificity for PLC injury detection (AUC = 0.836 (mean across 5×5 CV)).
Using a standard classification threshold of 0.5, the model's sensitivity was approximately 80.7% and its specificity was 70.7%. In other words, the algorithm identifies about 80% of PLC rupture cases, while approximately 29% of its positive predictions are false positives. This balance, slightly skewed toward higher sensitivity, is considered acceptable for a screening tool, although further research is needed to refine the optimal threshold for specific clinical tasks. Repeated cross-validation showed minimal variance in AUC between splits (within a few percentage points), suggesting model stability and a lack of significant overfitting. Increasing model complexity (e.g., more trees or greater depth) did not improve the AUC; thus, the final configuration was optimized (100 trees, depth 3, learning rate 0.1, regularization γ = 0,1, feature subsampling 85%, observation subsampling 70%).
Feature importance analysis
To interpret the model, predictor informativeness was calculated using two methods: (1) the built-in XGBoost Gain metric (the average contribution of a feature to the reduction of loss across decision trees) and (2) Permutation Feature Importance — an independent assessment based on the random shuffling of feature values and measuring the resulting decrease in AUC. Both approaches revealed a similar set of leading predictors (Figure 4).
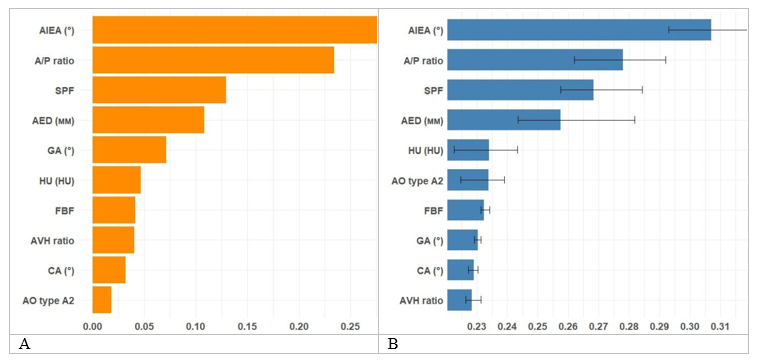
Figure 4 Predictor importance of the model for the A1–A2 group.
A — Ranking based on the Gain metric (the relative contribution of each feature to the reduction of model loss within the XGBoost algorithm).
B — Ranking based on Permutation Feature Importance (data presented as mean loss in accuracy with 95% CI).
The greatest contributions to the model were made by AIEA, A/P ratio, and the presence of a spinous process fracture (SPF). According to the Gain metric, these features were the most informative, with individual contributions of approximately 27.8%, 23.4%, and 13.0%, respectively. The second tier of importance consisted of anterior fragment displacement (AED, ~10.8%), the Gardner angle (GA, ~7.1%), and mean bone density (HU, ~4.7%). Signs such as FBF, AVH ratio, and the Cobb angle (CA) had smaller independent contributions (about 3–4% each), while the binary indicator "Type A2" was the least informative (~1.8%). The low informativeness of the A2 subtype classification is explained by the fact that the distinctive features of A2 fractures relative to A1 are already captured by other quantitative parameters (degree of wedging, presence of fragments, etc.); therefore, adding the "A2" indicator itself merely duplicates existing information. Permutation importance analysis confirmed this hierarchy: the largest drops in AUC occurred when shuffling AIEA, A/P, and SPF, demonstrating that these features are indeed critical for the prediction. Minor shifts in rank among less informative factors (e.g., HU vs. CA) are attributed to the differences between internal tree-based metrics and the actual impact on the outcome, but the core predictors remain consistent across both methods, increasing confidence in their significance.
Integral weighting coefficients
To translate the results of the model analysis into a clinically intuitive form, an integral weight was calculated for each feature, combining three metrics from the XGBoost algorithm: Gain, Cover (the proportion of observations where the feature was used in the trees), and Frequency (the frequency of the feature's use across the trees).
The weight was calculated using the following formula:
The coefficients for each component were selected to reflect the "strength" of the feature's influence on class separation (Gain), its "breadth" of coverage (Cover), and its "stability" of use (Frequency). Subsequently, values were normalized to a scale from 0 to 10, where 10 points were assigned to the most informative feature and the scores for the remaining features were calculated proportionally:
As a result, each CT sign was assigned a specific maximum weight (score) from 0 to 10, reflecting its relative significance in predicting PLC injury. The final integral weights and normalized scores are presented in Table 5.
|
Feature |
Gain |
Cover |
Frequency |
Integral weight |
Points (0–10) |
|
AIEA |
0.2781 |
0.2003 |
0.1769 |
0.233 |
10.0 |
|
A/P ratio |
0.2343 |
0.1693 |
0.1538 |
0.198 |
8.5 |
|
AED |
0.1083 |
0.1941 |
0.2231 |
0.158 |
6.8 |
|
SPF |
0.1296 |
0.1157 |
0.1000 |
0.120 |
5.2 |
|
GA |
0.0713 |
0.0736 |
0.0769 |
0.073 |
3.1 |
|
HU |
0.0468 |
0.0775 |
0.0846 |
0.064 |
2.7 |
|
CA |
0.0319 |
0.0719 |
0.0846 |
0.055 |
2.3 |
|
AVH ratio |
0.0404 |
0.0456 |
0.0462 |
0.043 |
1.8 |
|
FBF |
0.0413 |
0.0192 |
0.0154 |
0.029 |
1.3 |
|
Atype A2 |
0.0181 |
0.0327 |
0.0385 |
0.027 |
1.2 |
Table 5 Integral weights and normalized scores for the A1–A2 group
As shown, the largest cumulative contributions come from the AIEA (10 points) and the A/P ratio (8.5 points). These two indices reflect the severity of the wedge compression of the vertebral body, which, as expected, is a key risk factor for PLC injury: significant loss of anterior height (low A/P ratio) and an acute interspinous expansion angle (small AIEA) are characteristic of severe compression traumas often accompanied by posterior ligamentous rupture.
The third most significant factor was a spinous process fracture (SPF) (5.2 points). This sign itself increases the probability of ligamentous injury, serving as a direct indicator that the posterior structures were subjected to critical loading. However, its weight was roughly half that of the angular deformities. This reflects both the fact that an isolated SPF does not always involve a complete PLC rupture and its relatively low frequency in the sample.
Following in significance are anterior fragment displacement (AED, 6.8 points), Gardner angle (GA, 3.1 points), and bone density (HU, 2.7 points). The informativeness of the GA was relatively low in the presence of stronger predictors, likely due to its high correlation with wedging parameters (AIEA and A/P). Bone density (HU) had limited weight: low HU values (<150), typical of osteoporotic changes, were associated with a decreased probability of PLC injury, while high values (≥185) showed a moderate increase.
This observation reflects the biomechanics of the injury: in bone with low mineral density, a vertebral body fracture can occur under relatively low kinetic energy, primarily destroying the trabecular framework of the anterior columns while the PLC remains intact. Conversely, in patients with high bone density, a fracture requires much higher intensity forces, which involve both compression and distraction loads that damage the ligamentous apparatus.
The Cobb angle (CA) scored only ~2.3 points, supporting our hypothesis that in pure compression fractures (A1–A2), segmental kyphosis is usually minimal, and CA values do not differ significantly between cases with intact or ruptured PLCs. Low scores were also observed for the free bone fragment (FBF, ~1.3) and the relative anterior wall height (AVH ratio, ~1.8). The presence of an A2-type fracture (versus A1) also had almost no impact on the model (1.2 points), indicating that formally categorizing a fracture as "burst" without considering specific morphometric parameters is uninformative for assessing the PLC.
Overall, the integral analysis confirms that the determining risk factors for posterior complex rupture in compression fractures are the degree of vertebral body deformity (wedge geometry) and damage to the posterior bony structures (spinous process). Secondary characteristics only refine the diagnosis but do not play a decisive role.
Development of the scoring scale
Based on the derived weights and primary data, a quantitative prognostic scale was constructed to assess the risk of PLC injury using CT data. For each quantitative feature, an automated partitioning of its value range into several ordered intervals was performed using supervised binning (a decision-tree-based algorithm). This ensured a monotonic increase in the frequency of PLC injury from "favorable" to "unfavorable" values.
As a result, intervals were defined for AIEA (thresholds near 90°, 86°, 82°, 78°, and 74°), A/P ratio (near 0.75, 0.70, 0.65, 0.60, and 0.55), and other parameters. Validation confirmed that these intervals exhibit a consistent monotonic increase in PLC injury frequency as the indicators worsen: for instance, at AIEA ≤ 74° or A/P ≤ 0.55, the probability of injury reached its maximum, while at AIEA ≥ 90° or A/P > 0.75, injury cases were virtually absent.
Each interval was assigned a fixed number of points, with the scale for each feature ranging from 0 (minimum risk) to a maximum equal to its integral weight (see Table 5). Thus, the contribution of each feature to the total score was proportional to its informativeness: the most significant feature, AIEA, could contribute up to 10 points, the A/P ratio up to 8.5 points, and less significant parameters contributed fewer points. The developed gradations and corresponding risk scores are presented in Table 6.
|
Feature (unit) |
Value interval |
Points |
|
AIEA (°) (Acute interspinous expansion angle) |
≥ 90 |
0.0 |
|
< 90 and ≥ 86 |
2.0 |
|
|
< 86 and ≥ 82 |
4.0 |
|
|
< 82 and ≥ 78 |
6.0 |
|
|
< 78 and ≥ 74 |
8.0 |
|
|
< 74 |
10.0 |
|
|
A/P ratio (Anterior-to-posterior height ratio) |
> 0.75 |
0.0 |
|
≤ 0.75 and > 0.70 |
1.7 |
|
|
≤ 0.70 and > 0.65 |
3.4 |
|
|
≤ 0.65 and > 0.60 |
5.1 |
|
|
≤ 0.60 and > 0.55 |
6.8 |
|
|
≤ 0.55 |
8.5 |
|
|
AED (mm) (Anterior fragment displacement) |
< 1.0 |
0.0 |
|
≥ 1.0 and < 2.0 |
1.4 |
|
|
≥ 2.0 and < 3.0 |
2.7 |
|
|
≥ 3.0 and < 4.0 |
4.1 |
|
|
≥ 4.0 and < 6.0 |
5.4 |
|
|
≥ 6.0 |
6.8 |
|
|
SPF (Spinous process fracture) |
No |
0.0 |
|
Yes |
5.2 |
|
|
GA (°) (Gardner angle) |
< 10 |
0.0 |
|
≥ 10 and < 12 |
1.0 |
|
|
≥ 12 and < 14 |
2.1 |
|
|
≥ 14 |
3.1 |
|
|
CA (°) (Cobb angle) |
< 10 |
0.0 |
|
≥ 10 and < 12 |
0.8 |
|
|
≥ 12 and < 14 |
1.5 |
|
|
≥ 14 |
2.3 |
|
|
AVH ratio (Anterior vertebral height ratio) |
> 0.80 |
0.0 |
|
≤ 0.80 and > 0.75 |
0.6 |
|
|
≤ 0.75 and > 0.70 |
1.2 |
|
|
≤ 0.70 |
1.8 |
|
|
FBF (Free bone fragment) |
No |
0.0 |
|
Yes |
1.3 |
|
|
A-type (AO spine subtype) |
A1 |
0.0 |
|
A2 |
1.2 |
|
|
HU modifier (Mean bone density) |
< 150 (Osteoporotic) |
−2.7 |
|
150–185 (Normal) |
0.0 |
|
|
≥ 185 (High density) |
+2.7 |
Table 6 Prognostic scoring scale: feature gradations and assigned points (A1–A2 Group)
Note: The HU value acts as a bone quality modifier.
The total prognostic score for a specific patient is calculated by summing the scores of all individual features. This Total Points value is then converted into a probability of PLC injury using a simplified logistic regression model:
where coefficients and were determined based on the training sample. This approach ensures a strictly monotonic relationship: a higher total score directly correlates with a higher predicted risk.
According to the logistic regression analysis, the Total Points was a statistically significant predictor of PLC injury. Each additional point was associated with a 31% increase in the odds of injury (OR = 1.31; 95% CI: 1.10–1.57; p < 0.05). An increase of 5 points corresponded to a 4-fold increase in odds, while an increase of 10 points resulted in a more than 16-fold increase.
Validation of the scoring model yielded an AUC of 0.944 (Figure 5A), which is significantly higher than the original XGBoost model (0.836). Thus, the integral scale based on key parameters not only simplified the algorithm but also enhanced prognostic accuracy. Furthermore, the score-based model demonstrated excellent calibration: as shown in Figure 5B, the bootstrap-corrected calibration curve stays close to the diagonal, indicating ideal probability matching in the 10% to 80% range.
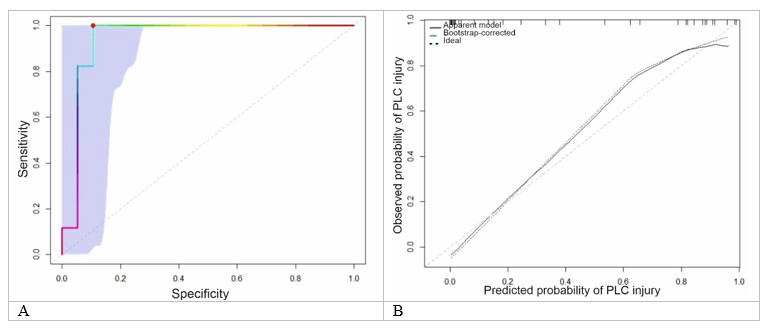
Figure 5 Performance characteristics of the score-based prognostic model.
(A) ROC curve with 95% confidence band; AUC with 95% CI;
(B) Calibration plot of the logistic model: P(PLC injury)∼Points.
Quantitatively, the Mean Absolute Error (MAE) for calibration was 0.041, the Mean Squared Error (MSE) was 0.0032, and the 90th percentile of absolute error was 0.097. These metrics confirm the high precision of the risk estimates.
Prognostic nomogram
To visualize the developed scoring scale, a nomogram was constructed, linking CT feature values with the total score and the probability of PLC injury (Figure 6).
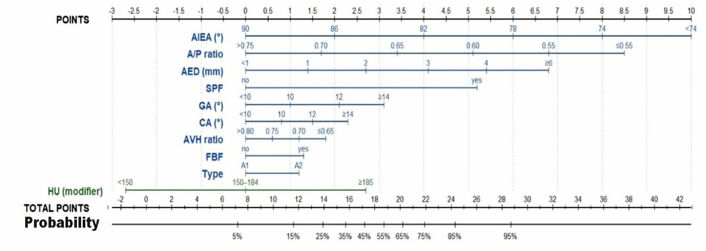
Figure 6 Prognostic nomogram for estimating the individual probability of PLC injury in AO Spine type A1–A2 fractures.
In the present study, we proposed a quantitative CT-based model for assessing the risk of posterior ligamentous complex (PLC) injury in AO Spine type A1–A2 fractures of the thoracolumbar junction. The developed scoring scale and the resulting nomogram demonstrated high discriminatory power and excellent calibration, outperforming the original gradient boosting model in predictive accuracy. Below, we discuss the potential reasons for this result, the specifics of its practical application, limitations, and a comparison with existing approaches to PLC assessment.
Rationale for the superiority of the scoring scale
The transition from the "black box" of a machine learning model to an explicit scoring scale in our study was accompanied by a significant increase in prognostic quality. This can be explained by a combination of statistical and clinico-biomechanical factors.39
First, the discretization of continuous parameters and the use of fixed thresholds act as a form of stringent regularization. Within each scale interval, individual feature variability is ignored; only the assignment to a specific risk tier is considered. This minimizes the impact of random measurement noise and reduces the variance of estimates in small datasets. While this approach increases model bias by simplifying relationships, the overall bias-variance tradeoff remains favorable, thereby enhancing prognostic stability.40
Second, the scoring scale is grounded in monotonic, clinically, and biomechanically sound relationships. An a priori defined order of influence (where more pronounced morphological disruption corresponds to a higher score) guides the model within physiologically plausible trauma scenarios. Consequently, this prevents the formation of spurious or difficult-to-interpret patterns that a flexible machine learning model might identify in a limited dataset. This renders the scoring model both interpretable and less prone to overfitting.41
Third, converting features into scores significantly reduces multicollinearity. Redundant indicators are either assigned a capped influence ceiling or excluded entirely.42 Specifically, vertebral body height ratios (AVH ratio) and segmental kyphosis (Cobb angle, CA) were assigned relatively low maximum scores, while interspinous distance parameters (ISD/ISA) were excluded. This eliminates the "double counting" of the same effect—such as compression or kyphotic deformity—across different metrics, making the final index more specific.43
Furthermore, the scale's structure reflects the key pathomechanical mechanisms of Type A1–A2 fractures. The leading role is played by anterior wedge deformity, described by the AIEA and the A/P ratio, while the posterior complex remains intact. Risk assessment is further refined by signs of posterior column involvement, such as a spinous process fracture (SPF) and fragment displacement (AED). In contrast, a flexible model without a priori constraints does not distinguish the clinical significance of specific feature combinations and may overestimate irrelevant associations in small samples.44
Finally, discrete threshold gradations enhance the model's robustness against measurement errors. Minor discrepancies of ±1 mm or ±1° typically do not shift a feature into a different interval and, therefore, do not alter the final score. This reduces sensitivity to inter-observer variability and establishes a foundation for the scale's application in multicenter settings.45
Practical application of the nomogram
The practical implementation of the identified patterns is realized through a scoring scale and a nomogram designed for bedside clinical use. The nomogram enables clinicians to determine the contribution of each CT parameter using linear scales and convert the cumulative score into the probability of a PLC injury.
The application algorithm involves a sequential score assessment for each feature, summation of the resulting values, and identification of the corresponding PLC injury probability. Quantitative parameters are assessed using graduated scales, while binary features (presence/absence) are assigned a fixed score. The resulting Total Points is mapped against the probability scale, providing a quantitative risk estimate.46
Our clinical experience suggests that even in cases of formally 'stable' type A2 compression fractures according to the AO Spine classification, the cumulative score often corresponds to a high probability of PLC injury. In such instances, the model highlights the necessity for additional verification of the posterior ligaments (e.g., via MRI), which may lead to a reassessment of the surgical strategy.
Characteristics and limitations of the methodology
Despite the demonstrated advantages, the proposed approach has several limitations that should be considered during its interpretation and clinical application.
First, the scale is based on fixed thresholds calculated for a specific study cohort of Type A1–A2 fractures. Altering the interval boundaries or including new features would require recalculating the weighting coefficients and updating the nomogram. Consequently, the scale's applicability is primarily limited to conditions similar to the original research data.47
Second, the model incorporates bone mineral density (HU) as a modifier that adjusts the final score independently of the fracture geometry.48 For a given morphology, lower bone density is associated with a decreased calculated risk, while high density increases it.49 This factor should be interpreted with caution, considering potential variations in HU measurement techniques and the influence of CT technical parameters.
Third, the model was specifically developed for compression injuries without obvious distraction or rotation. Extrapolating these results to Type B distraction injuries or more complex fragmentary Type A3–A4 fractures requires separate validation, as the risk factor patterns and the nature of PLC disruption in those groups differ substantially.11
An additional limitation is the potential for missing data. In clinical practice, it is not always possible to accurately measure all parameters (e.g., bone density or angles when endplate contours are poorly defined). In such cases, using neutral values or a "worst-case scenario" approach is permissible, though wider adoption of the scale will require standardized rules for handling missing data.
Given the single-center design and internal development of the scoring thresholds, the apparent performance may be optimistic; external validation is required.
Finally, the discretization of features inevitably leads to some loss of information. Patients with borderline values receive the same score despite slight differences in actual risk. Nevertheless, such simplified gradation is justified by its clinical utility and the robustness of the assessment.
Accordingly, the present results should be regarded as an initial methodological validation rather than a definitive universal model, with extension to A3–A4 Type injuries requiring separate model development and validation.
Comparison with existing approaches
The results of this study should be viewed within the context of current strategies for assessing PLC injury. While MRI remains the "gold standard" for diagnosing posterior ligamentous ruptures, and classification systems such as TLICS directly incorporate PLC status to determine injury stability, MRI may be unavailable or delayed in acute trauma settings.50 This necessitates the search for reliable CT-based risk criteria.
Previously proposed approaches generally rely on identifying individual "red flag" signs on CT or their simple combinations. It has been demonstrated that no single sign possesses sufficient diagnostic accuracy on its own, whereas the presence of multiple signs significantly increases the probability of PLC injury.20 However, such binary schemes do not account for the graduated impact of deformity severity and fail to provide a quantitative risk assessment.
The nomogram proposed in this study is distinguished by its consideration of the weighted contributions of both qualitative and quantitative deformity parameters. The inclusion of continuous variables, such as AIEA and the A/P ratio, allows for a more precise reflection of the degree of compression than simple threshold criteria. Compared to previously published CT-based scoring systems that demonstrated moderate accuracy, our developed scale showed superior discriminatory power while maintaining full interpretability.21
Unlike complex machine learning algorithms, the nomogram remains transparent to the user: the contribution of each feature to the final risk is easily traceable and can be correlated with the patient's clinical presentation. Thus, the proposed approach occupies a middle ground between simple classification rules and high-dimensional "black boxes," combining quantitative objectivity with clinical interpretability.41
Clinical significance
The proposed CT→PLC model serves as a practical decision-support tool, enabling a quantitative assessment of the risk of posterior ligamentous complex injury during the primary CT evaluation. The use of the scoring scale and nomogram facilitates more accurate stratification of patients with thoracolumbar compression fractures.
A high cumulative score indicates a significant probability of PLC injury and can justify a more proactive diagnostic and treatment strategy, including MRI or early surgical stabilization. Conversely, a low calculated risk may allow for the omission of additional imaging and invasive interventions. Ultimately, the implementation of such a model in clinical practice can optimize patient triaging, reduce the number of unnecessary MRI scans, and lead to more evidence-based treatment choices for thoracolumbar injuries.
This study developed a CT-based prognostic tool for estimating the probability of posterior ligamentous complex (PLC) injury in AO Spine type A1–A2 fractures of the thoracolumbar junction. The proposed point-based scoring system and nomogram provide an interpretable, bedside-applicable method for risk stratification in clinical situations where CT findings are subtle and MRI is unavailable or delayed. By integrating the weighted contribution of key morphometric parameters and indirect CT signs, the model supports more consistent identification of occult posterior instability and may assist in selecting patients who require urgent MRI and/or early surgical stabilization, while reducing unnecessary additional imaging in low-risk cases. Further multicenter external validation and assessment of clinical impact are required before routine implementation.
None.
Ethical approval: All procedures performed in studies involving human participants were in accordance with the ethical standards of the institutional and/or national research committee and with the 1964 Helsinki declaration and its later amendments or comparable ethical standards. The study was approved by the Local Ethics Committee (Protocol No. 4, Date: 05.09.2018).
None.
The authors declare that there are no conflicts of interest regarding the publication of this paper. No financial or personal relationships with other people or organizations have inappropriately influenced the content of this study.

©2026 Nekhlopochyn, et al. This is an open access article distributed under the terms of the, which permits unrestricted use, distribution, and build upon your work non-commercially.