Journal of
eISSN: 2574-8114


Research Article Volume 3 Issue 3
1Department of Textile Engineering, Textile Excellence & Research Centers, Amirkabir University of Technology, Iran
2New Technologies Research Center, Amirkabir University of Technology, Iran
Correspondence: Fatemeh Mokhtari, Department of Textile Engineering, Textile Excellence & Research Centers, Amirkabir University of Technology, Tehran, Iran
Received: October 02, 2017 | Published: November 8, 2017
Citation: Mokhtari F, Latifi M, Shamshirsaz M. Applying the genetic algorithm for determination electro spinning parameters of poly vinylidene fluoride (PVDF) nano fibers: theoretical & experimental analysis. J Textile Eng Fashion Technol. 2017;3(3):640-648. DOI: 10.15406/jteft.2017.03.00098
Poly Vinylidene Fluoride (PVDF) because of its piezoelectric properties has been applied in different applications such as smart textiles, medical application and membranes for energy harvesting. It was declared that nanofibres diameters and electrospinning parameters could be enhanced the piezoelectric properties of these materials. The main objective of this paper is applying the Genetic Algorithm (GA) to determine the optimum condition of solution parameters and processing conditions based on the desired diameter size of PVDF fibers to produce the fibers without any structural faults. In this method, The Fitness function was determined by a simple analytical model presented by Fridrikh. Toward approving the GA results the experimental tests were done. the effect of four parameters such as flow rate of the polymer solution, electrospinning voltage, electrospinning distance and polymer concentration on the fiber formation and fiber diameter size of electrospun PVDF fibers have been explored by Scanning Electron Microscopy (SEM) to attest the accuracy of the model. Assessment of experimental and theoretical results show that electrospinning parameters determined by GA method leads to achieve desire fiber diameters. Because of time and energy consuming of electrospinning process, the GA method may be useful to achieve desired fiber diameter by determining electrospinning parameters for polymers prior to fiber production.
Keywords: genetic algorithm, electrospinning parameters, pvdf, desire fiber diameter
PVDF, poly vinylidene fluoride; SEM, scanning electron microscopy; RWS, roulette wheel selection; DMF, n-ndimethylformamide; GA, genetic algorithm; CDF, cumulative density function
Poly Vinylidene Fluoride (PVDF) is a semi crystalline polymer that consists of 4 crystalline phases, α, β, γ and δ. Among these phases, the non-polar phase, α, is the most common and commercial type of PVDF films and powders.1 The commercial PVDF polymer is generally produced by polymerization process in emulsion or suspension using free radical initiators and forming a repeating unit of –CH2–CF2–. The spatial arrangement of the CH2 and CF2 groups along the polymer chain have the main effect on the unique properties of PVDF materials in generated from considering the crystalline structure.2 One of considerable methods to produce PVDF fiber is electrospinning process. Many researchers used this process to improve PVDF piezoelectric properties by changing α phase to β phase which is responsible for piezoelectric properties of PVDF.3-6 Electrospinning is a unique technique to produce continuous nano/micro fibers (5-500 nm) which are controllable by process parameters.7-9 The diameter size of electrospun fibers is greatly dependent on the processing and solution properties. The major electrospinning processing parameters include the applied voltage, solution flow rate, and electrospinning distance.10-13 Changing any of these parameters could have a significant effect on fiber formation.14-16 The effect of the electrospinning process on properties of PVDF fibers in the formation of β phase and their application in energy harvesting have been consider by researchers in recent years. Due to the high draw ratio that applied to fibers during that electrospinning process, it is predictable that the produced fiber would have highly orientated molecular structure and could enhanced the β phase construction, so the diameter size of fibers could have the significant impact on piezoelectric properties of these fibers. Because of producing the fine fiber diameter, the electrospinning process is interested by researchers and some researchers used GA method to optimize electrospinning parameters for suggesting the best situations for controlling the diameter of fibers. The goal of these researches is to achieve the finest fiber diameter only.17,18 But In present work, the GA method was applied to optimize the electrospinning parameters to achieve desire PVDF fiber diameter which is depend to the final application. In fact by desiring a fiber diameter (here 400 nm), the GA method determines the optimum electrospinning parameters to achieve desire fiber diameter. Toward approving the GA results the effect of electrospinning parameters such as flow rate of the polymer solution, electrospinning voltage, electrospinning distance and polymer concentration on the morphology of individual electrospun PVDF fibers have been explored by Scanning Electron Microscopy (SEM). This work by experimental and theoretical sections provides background to attest GA method in electrospinning process which it wasn’t done before. The fitness function in the GA method is based on the simple analytical model introduced by Fridrikh.19 The comparison demonstrates that the result obtained by Fridrikh theory is consistently correlated with the experimental result to achieve desire fiber diameter (400nm). It was observed that the morphology of the fiber produced is strongly influenced by parameters such as flow rate of the polymer solution, PVDF concentration, the electrospinning voltage and electrospinning distance. Because of time and energy consuming of electrospinning process, the GA method is useful to achieve desire fiber diameter by determining electrospinning parameters prior to fiber production. Here PVDF polymer used to evaluate the GA method. The algorithm presented in this research can be assessing for other polymer solutions too.
Modeling of electrospinning parameters
Fridrikh et al.9 established a simple model for the stretching of a viscous charged fluid in an electric field. The model predicts a terminal jet diameter which is a consequence of balance between normal stresses due to surface tension and surface charge repulsion. Terminal jet diameter can be determined from data of the flow rate, electric current and the surface tension of the fluid. Although this model may be applied to predict “terminal” jet diameter, the mathematically derived limiting diameter is equated with experimentally measured fiber diameter. The model solves the equations of motion for the jet, as a function of solution properties [dielectric permittivity (ε) and surface tension (γ)] as well as processing parameters [flow rate (Q) and electric current (I)]. In equation 1, the terminal jet radius ht is as follow:
(1)
In Equation (1) the terminal diameter of the whipping jet is a function of the flow rate, electric current, and the surface tension of the fluid. In this equation the elastic effects and fluid evaporation are not considered, and also it was assumed that the minimal jet thinning after the saturation of the whipping instability. Equation was investigated by measuring the diameters of electrospun fibers obtained over a wide range of external conditions. According Fridrikh’s research, the fluid jet diameter which gives rise to a solid fiber diameter (d) by correcting for polymer concentration (c) could be estimated by Equation 2.19 These equations applied for fitness function of genetic algorithm in this paper.19,20
(2)
Genetic algorithm
Genetic algorithm is one of the powerful methods for optimization that was used successfully in solving different problems. Its performance is depending on the encoding scheme and the choice of genetic operators especially, the selection, crossover and mutation operators. The GA is characterized by binary representation of individual solutions, simple problem-independent crossover and mutation operators, and a proportional selection rule. To apply GAs in solving an industrial optimization problem, it is usually assumed that a potential solution to the problem may be represented as a set of variables. These variables “genes” are joined together to form a string of values as “chromosome”. The string can be the binary digits, integers or real numbers. Three component of algorithm are initialization, reproduction, and selection. After creation of first population’s chromosome, fitness function evaluates their ability for transferring to the next generation. Here there are three methods to create chromosome for new generation, copy, mutation and cross over. During the process, generation attempt is to create chromosomes with high level of suitability base on fitness function. The generation is repeated until stop condition happen.21
Initialization: In the initialization step, at the first, it should be decided the coding structure. Coding for a solution is usually described as a string of symbols from {0,1}. These components of the chromosome are then labeled as genes. The number of bits that must be used to describe the parameters is problem dependent. In this work to generate initial population for each electrospinning parameter (input parameter) consider one chromosome. Length of each chromosome related to the range of input parameters. This rages related to experimental experience of PVDF electrospinning but with an extension around to have real and general trend. These ranges are listed in the Table 1. In the initialization step by order “randint” generate initial population which its chromosomes are selected randomly of binary representation. The initial population size is 100 to cover all possible solutions.
Fitness function: The fitness function is defined to establish the fitness of each individual chromosome to control which one is fit to reproduce and continue for the next generation. In fact the fitness function evaluates the ability of chromosomes by returns a single numerical score, “fitness” to transfer to the next generation. The “fitness” score assigned to each individual in the population depends on how well that individual solves a specific problem.22 In this work Fridrikh model predict fiber diameter as fitness function. This model is provided by the reasonable prediction of the dry fiber diameter for PCL, PEO, and PAN.19 In present word this model used for diameter determination of electrospun PVDF fiber. The selection of chromosomes for next generation would be based on minimum difference between achieved fiber diameter from GA and fiber diameter that desired by the user (here 400nm).
Selection: The population for the next generation is defined in selection part. This selection is based on fitness assigned for each chromosome of the population. The roulette wheel selection (RWS) method applied in this paper to select fitted chromosome (only for cross over and mutation operator) to transfer for next generation. In roulette wheel method, each member of the population is represented by a slice that is directly proportional to the member’s fitness. A selection step is then a spin of the wheel, which in the long run tends to eliminate the least fit population members. The roulette wheel selection is processes based on the survival of the fittest and are in random nature, there is no guarantee that some fit individuals will be selected.23
Reproduction: In this paper, three operators for creation of new generation were used including copy (10%), crossover (30%) and mutation (60%). Copy process forces the GAs to retain some of the best individuals in each generation. This process strategy copies the best individuals (based on fitness function) of each generation directly onto the succeeding generation without any change. Copying the strings according to their fitness will result higher probability of contributing one of more offspring in the next generation. The crossover operator is an operator that combines two chromosomes (parents) to produce a new chromosome (offspring). The idea behind crossover is that the new chromosome may be better than both of the parents if it takes the best characteristics from each of the parents.21 Mutation is viewed as a background operator to maintain genetic diversity in the population. It introduces new genetic structures in the population by randomly modifying some of its building blocks. Mutation helps escape from local minima’s trapped and maintains diversity in the population.21 Here mutation applied on two random points of individual parent, to produce a single new individual, child. Also the mutation percentage was set more than other operators to have the best possible selection in the search space.
Termination: A genetic algorithm is run over a number of generations until the termination criteria are reached. Each of the enabled termination criterion is checked after each generation to evaluation to see if it is time to stop. Typical termination criteria are: Stop after a fixed number of generations, Stop when a chromosome reaches a specified fitness level, stop when a chromosome succeeds in solving the problem, within a specified tolerance. Human judgment can also be used in some more subjective cases.24 In this paper termination criterion is reaching mean fiber diameter of the generation to desire fiber diameter which is define by user (here 400 nm).
Procedure: The program used to optimize the electrospinning parameter and solution concentration by implementing the flowchart given in Figure 1. After the initialization, evolution is occurred in accordance with the standard genetic operations of copy, crossover and mutation operation with the roulette wheel selection method. The evolutionary process is allowed to continue until mean fiber diameter of the generation reach to desire fiber diameter that consider here 400 nm.
In summery in theoretical part the Genetic Algorithm method was used to determine the optimum condition of solution parameters and processing conditions based on the desired diameter size of electrospun PVDF fibers. In this paper the desire fiber diameter set for 400 nm and fitness function is based on Fridrikh analytical model for final fiber diameter. Length of each chromosome related to the range of input parameters. This rages related to experimental experience of PVDF electrospinning parameters (reported by researchers’ papers), but with an extension around to have real trend which are illustrated in Table 1. Three operators for creation of new generation were used including copy (10%), crossover (30%) and mutation (60%). The roulette wheel selection method applied to select fitted chromosome for cross over and mutation operator to transfer for next generation. Termination criterion is reaching mean fibers diameters of the generation to desire fiber diameter (400nm).
Parameters |
Interval |
Polymer concentration (wt %) |
(5-25) |
Electrospinning voltage (kV) |
(10-30) |
Electrospinning distance (cm) |
(5-30) |
Flow rate (ml/hr) |
(0.1-1) |
Table 1 The interval range of pvdf electrospinning parameters
Materials
PVDF pellets (Sigma-Aldrich) with molecular weight of 534,000(g/mol-1) were used to fabricate the electrospun fibers. The solvents "N-Ndimethylformamide" (DMF) and acetone were used in this work were purchased from Merck Chem. Co. All the materials were used without further purification.
Methods
Sample preparation: The PVDF polymer was dissolved in DMF/acetone solution and stirred for 1hr at 60˚C and then the solution is stirred again for 24hrs at the room temperature. The percentage of concentration of PVDF varies from 14 to 17% (w/w). The electrospinning setup used in this study consists of a 1.0 ml plastic syringe tipped with a 22-gauge stainless steel needle (e.d=0.7mm, i.d=0.4 mm) and a high-voltage supply (Gamma High Voltage Research). The needle is connected to the high-voltage supply, which can generate positive DC voltages up to 40 kV. Positive voltage applied to polymer solutions ranges from 18 to 22 kV. The distance between the needle tip and the ground electrode was adjusted from 10 to 25 cm. PVDF solution is delivered via a syringe pump (KD Scientific, USA). The pump controlled the polymer solution flow rate which varies from 0.3 to 0.7 ml/h in this study. The whole of electrospinning fiber formation process was carried out at the room temperature. In experimental part to achieve desire fiber diameter (400 nm) series of experimental tests were done by variation of the electrospinning process parameters which are illustrated in Table 2. In each step depends on fiber morphology obtained from SEM, parameters changed to achieve desire fiber diameter also tried to have variations in all parameters for evaluating their effect on fiber diameter.
Sample Number |
PVDF Concentration (wt %) |
Voltage (kV) |
Distance (cm) |
Flow Rate (ml/hr) |
1 |
14 |
20 |
20 |
0.3 |
2 |
15 |
20 |
20 |
0.3 |
3* |
16 |
20 |
20 |
0.3 |
4 |
17 |
20 |
20 |
0.3 |
5 |
16 |
20 |
10 |
0.3 |
6 |
16 |
20 |
25 |
0.3 |
7 |
15 |
20 |
20 |
0.5 |
8 |
15 |
20 |
20 |
0.7 |
9 |
16 |
18 |
20 |
0.3 |
10 |
16 |
22 |
20 |
0.3 |
11** |
15 |
24 |
13 |
0.1 |
Table 2 Different conditions used to optimize the electrospun pvdf nanofibres
*optimum condition by experimental-**optimum condition by GA.
Characterization techniques: The morphology of nanofibres webs were characterized by using scanning electron microscope (SEM, model: XL30, PHILIPS Co.). All samples were gold coated (Bal-tec SCD50 sputter coater) and the images were taken at an acceleration voltage of 20 kV. FTIR spectra of PVDF film and nanofibres were recorded by Spectrometer (model: NEXUS 670, Nicolet Co.) over a range of 400-4,000 cm−1. The fiber diameter was measured using image processing software (Image J, National Institutes of Health, USA).
Genetic algorithm results (theoretical results)
In this paper GA as searching method used to find optimum electrospinning parameters to produce PVDF electrospun fiber with desire fiber diameter which is define by the user. Here desire fiber diameter for the electrospun fiber in GA set for 400 nm. The termination criterion is searching the mean fiber diameter of each generation to find 400nm and then GA stop searching. The trend of this process is shown in Figure 2. As can be seen from this figure after 10 generation the mean fibers diameters reach to desire fiber diameter. In 10th generation the optimum fiber diameter achieved by GA was 330 nm.
For this fiber diameter, GA recommend optimum electrospinning parameters such as: 15wt% (polymer concentration), 13cm (electrospinning distance), 24 kV (electrospinning voltage), and 0.1 ml/h (flow rate). Figure 3 shows the SEM image of PVDF electrospun fibers was produced base on these optimized conditions. The mean fiber diameter for this figure base on image j is 330 nm as it was declared by GA too. But because of the difference (21.2%) between the desirable fiber diameter (400nm) and theoretical results obtained by GA (330nm), the experimental tests done to understand the root of this difference. In experimental part effect of electrospinning parameters (flow rate of the polymer solution, electrospinning voltage, electrospinning distance and polymer concentration) on fiber diameter evaluated.
Usually, most of the authors analyzed and report the mean fiber diameter from SEM images. But, if we create an analysis of the nanofibre diameter distribution, we will find that in the most cases this distribution is not normal (Gaussian).25-29 Because of this, it is impossible to compare the mean fiber diameters reported by different researchers. To have a standard comparison between mean fiber diameters achieved by different researchers, according to the mathematical statistic, the distribution of the fiber diameter must be obtained from the same calculations (Figure 4).
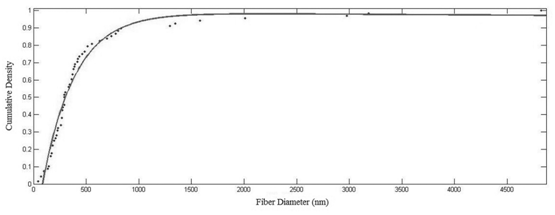
Figure 4 Cumulative density distribution of fiber diameter based on optimum condition resulted by GA.
Here cumulative density function (CDF) has shown the high precision of utilizing the concept of actual diameter distribution for experimental result. To achieve fiber diameter distribution, after illustration the diagram of cumulative density for each fiber diameter and choosing the best fitting curve, Differentiation of fitness function should be done (Figure 4) (Figure 5).30
Finally diameter distribution of electrospun fibers illustrated in exponential form based on derived function (Figure 5). Although results show that its distribution is not normal but mean fiber diameter base on exponential function is 330 nm which confirmed the result obtained from experimental. By applying this method for fiber diameter distribution, all comparison between all distribution reported by different researches are comparable logically.
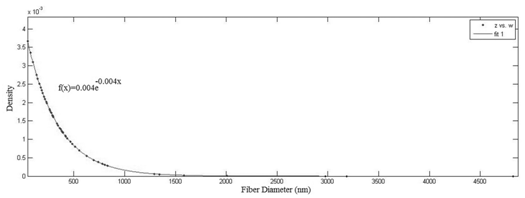
Figure 5 Diameter size distribution of electrospun PVDF fibers based on optimum condition resulted by GA.
Experimental results
To evaluate GA method ability to determine electrospinning parameters to achieve desire fiber diameter, experimental test were done to find these parameters for nearest fiber diameter to desire fiber diameter (Figure 6). So the optimized processing conditions (base on experimental tests) used to produce the electrospun PVDF fibers with desire diameter (400 nm) are presented in Table 3.
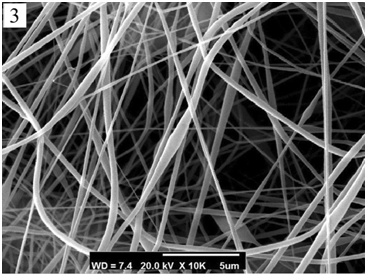
Figure 6 The SEM image of PVDF electrospun fiber based on optimum condition resulted by experimental. (Samples numbers according to Table 1).
PVDF Concentration |
Voltage (kV) |
Distance (cm) |
Flow Rate (ml/hr) |
Volumetric Ratio (Acetone/DMF) |
16 |
20 |
20 |
0.3 |
4/6 |
Table 3 Optimized conditions used to fabricate the electrospun pvdf fibers with desire diameter (400nm)
Diameter distribution for experimental sample is obtained from the procedure explained before in theoretical section. This distribution is in Gaussian form (Figure 7) which confirms desire fiber diameter (400nm) obtained from image j.
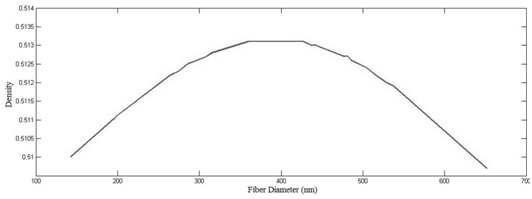
Figure 7 Diameter size distribution of electrospun PVDF fibers based on optimum condition resulted by experimental.
In electrospinning, most of the attention is focused on producing fibers with a uniform diameter. It is very important to understand how the diameter and its distribution vary with the materials used and the processing parameters. An analysis of literature sources has shown that the distribution curves of the diameters obtained are very complex and do not resemble normal distributions. It is impossible to compare the average values of nanofibre diameters without consideration to its distribution. So in Table 4 the mean fiber diameters reported beside other statistical characteristics of samples to have logical comparison between samples.
Sample Number |
Mean |
Range |
SD |
Median |
1 |
960.681 |
(312.5-3462.66) |
663.03 |
717.67 |
2 |
1004.591 |
(424.859-2704.77) |
453.7175 |
865.061 |
3* |
400.124 |
(126.473-582.811) |
107.71 |
318.029 |
4 |
1161.288 |
(465.620-4344.264) |
750.55 |
971.063 |
5 |
2275.147 |
(1027.373-5238.596) |
852.204 |
2105.465 |
6 |
323.891 |
(97.601-2157.184) |
324.985 |
238.055 |
7 |
275.284 |
(111.280-1222.916) |
196.618 |
212.639 |
8 |
2413.518 |
(1438.221-5003.282) |
766.239 |
2184.072 |
9 |
2404.537 |
(1094.861-4131.561) |
784.59 |
2457.648 |
10 |
334.289 |
(70.311-2617.422) |
517.636 |
187.307 |
11** |
330.266 |
(45.91602-3822.385) |
578.03 |
293.106 |
Table 4 Samples Statistical Characteristics Statistics
*optimum condition by experimental-**optimum condition by GA
FTIR analysis: It was supposed that the electrospinning process have the good potential for converting α phase of PVDF to β phase, which is responsible for enhancing the piezoelectric properties of PVDF fibers. FTIR spectra of PVDF film and fiber were recorded by Spectrometer over a range of 400-4,000 cm−1 (Figure 8). FTIR spectrum of PVDF exhibited α-phase peaks located at 531, 614, 763, 796, 870 and 970 cm−1. The β-phase PVDF characteristic peaks located at 440, 470, 510, 840 and 1280 cm−1.31 It has been revealed that the film has weaker β-phase crystalline than the electrospun PVDF fibers. So to reach this goal the best electrospinning conditions should be adjusted to have uniform and bead-free fibers.
Effect of electrospinning parameters
Effect of PVDF concentration: The concentration of polymer solution plays an important role in the formation of fiber during the electrospinning process. In low concentration, the polymeric micro/nano particles would be obtained. In this case, electro spray occurs instead of electrospinning owing to the low viscosity and low surface tensions of the solution.1 The smaller diameter in the lower concentrations can be due to the higher mobility of the polymer chains and the stronger instabilities of the jets during the electrospinning both enable and induce the higher stretching of the polymer jet and the formation of beads.
As the concentration increases, a mixture of beads and fibers will be formed. By proceeding to increase the concentration, smooth fibers could be formed. The results show that increasing the concentration over the appropriate limit (16% in this study) leads to the disappearance of smooth fibers and subsequent formation of further helix-shaped micro ribbons. Four typical SEM images are presented in Figure 9 in which the evolution of the samples with different concentrations from low to high values (14 to 17%) can be observed. Figure 9C is based on optimum electrospinning condition for desire fiber diameter (400 nm). As it was expected, by increasing the solution concentration, the fiber diameters have been increased (Figure 9D).
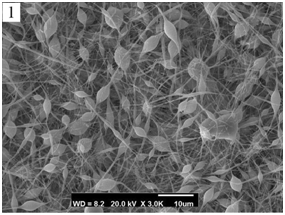
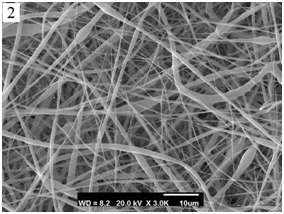
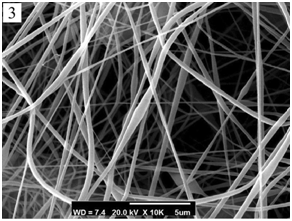
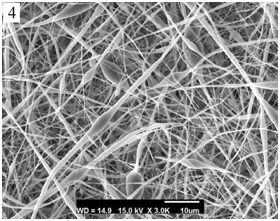
Figure 9 SEMs of PVDF electrospun fiber by different PVDF concentrations: A)14, B)15, C)16, D)17wt%. (Samples numbers according to Table 1).
According to the above description, by comparing the optimum condition obtained from experimental (16wt %) with theoretical one (15wt %), it is predictable to have finer fiber diameter in theoretical (330nm) in compare with experimental (400nm) (Figure 9).
Also, ANOVA and Duncan statistical tests have been carried out in order to show that there is a significant difference between fiber diameters by different PVDF concentration at 95% p-value.
Electrospinning distance: Previous studies reported that the distance between the collector and the tip of the syringe can also affect the fibers diameters and morphologies.32 In brief, if the distance is too short, there is not enough time to solidify the fibers before reaching to the collector, whereas the distance is too long, beaded fiber can be obtained. This is because for a longer traveling distance, the interaction between positive charge and grounded collector will be decreased and consequently the elongation force will be reduced. It is well known that one important physical aspect of the electrospun fibers is the evaporation of the solvent, so an appropriate distance for each electrospinning conditions should be adjusted. Figure 10 presents electrospun PVDF fibers related to three different electrospinning distances; 10, 20 and 25 cm. The appropriate distance based on measurement of fiber diameter distributions is 20 cm (Figure 10B)because of its non-bead structure. As it can be seen in Figure 10, increasing the tip to collector distance will decrease the fiber diameter from 230nm to 400nm and 290nm respectively (Figures 10a-10c). Likewise, ANOVA and Duncan statistical tests have been carried out in order to show that there is a significant difference between fiber diameters by increasing tip to collector distance. Although electrospinning distance in theoretical optimum condition (13 cm) is less than experimental one (20 cm) but its lower flow rate and higher voltage leads to have finer fiber diameter (330 nm) in compare with experimental (400nm).
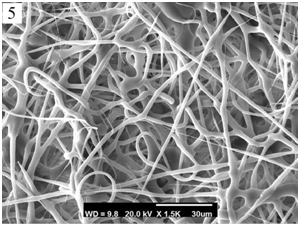
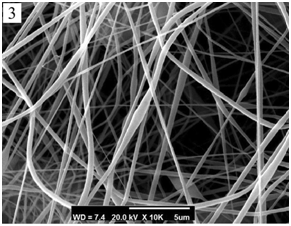
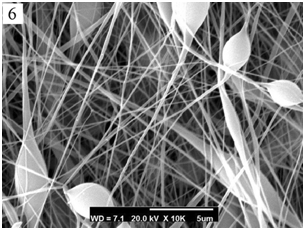
Figure 10 SEMs of electrospun PVDF fiber for three different tip to collector distances: A)10, B)20 and C)25 cm related fiber diametre: A) 2275nm B) 400nm C) 324nm.
Flow rate: The flow rate of the polymer solution is another important process parameter which affects the fiber morphology. Generally, lower flow rate is more recommended because in this way, the polymer solution will have enough time for the polarization. If the flow rate is very high, bead fibers with thick diameters will be formed rather than the smooth fibers with thin diameters owing to the short drying time prior to reaching the collector and low stretching forces. Moreover, fiber bead density increases with the increasing the instability of the jet at the spinning tip, and may be minimized through the control of flow rate.
As it can be seen from Figure 11A, it is inferred that with the decrease in the flow rate, bead size could get smaller until a non-beaded structure is obtained. Further decrease in the flow rate urges the necessity of an increase in voltage in order to assure a continuous electrospinning process.
Also, ANOVA and Duncan statistical tests have been carried out in order to show that there is a significant difference between fiber diameters by increasing flow rate. These results confirm that fiber diameter based on theoretical results with flow rate 0.1 ml/hr leads to finer fiber diameter (330nm) in compare with experimental flow rate (0.3ml/hr) condition with 400 nm fiber diameter.
Voltage: Among the electrospinning process parameters, applied voltage is a major factor. The applied voltage should be higher than the threshold voltage in order to supply a charged jet ejected from Taylor cone. This threshold voltage depends on the polymer solution concentration and tip to collector distance. Figure 12 demonstrates SEMs of electrospun PVDF fiber in different electrospinning voltage. As it was expected, higher voltages can increase the electrostatic repulsive force on the charged jet, favoring narrower fiber diameters. This increase in voltage causes a faster removal of the solution on the needle tip. An over increasing electrospinning voltage results in jet instability and consequently formation of beads along electrospun fibers will occur.
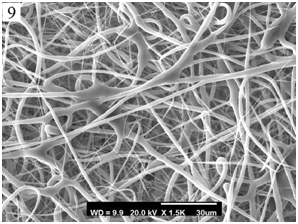

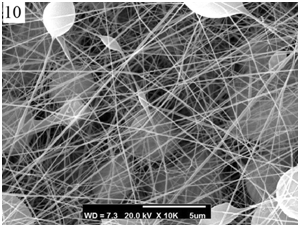
Figure 12 SEMs of electrospun PVDF fibers in different electrospinning voltages A)18, B)20, C)22 kv.
Keeping other electrospinning parameters constant and increasing the applied voltage, fiber diameter will decrease however the bead sizes will increase (Figure 12C). The beaded structure shows that a stable Taylor cone could not be formed at this higher voltage. At this level of voltage, greater amounts of charge will emerge, causing the droplets and jet accelerate toward the collector faster, and thus larger beads will be formed. It could be concluded that to generate a Taylor cone and non-beaded fiber morphology, flow rate and voltage should be adjusted simultaneously. Therefore for a given voltage, a certain flow rate should be selected to collect a non-beaded fiber structure. These finding confirm results obtained for experimental and theoretical voltages and their final fiber diameter. Figure 13 illustrates the effect of voltage on the fiber diameter distribution in PVDF electrospinning.
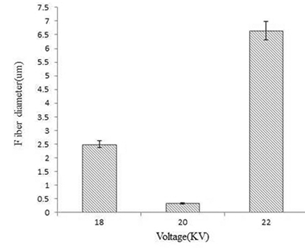
Figure 13 The effect of voltage on the fiber diameter distribution in PVDF electrospinning process. Concentration: 16 wt%, distance: 20 cm, flow rate 0.3ml/h.
Also, ANOVA and Duncan statistical tests have been carried out in order to show that there is a significant difference between fiber diameters by increasing voltage.
Optimization of electrospinning processing parameters to achieve desire fiber diameter has been theoretically done by Genetic Algorithm based on Fridrikh analytical model as a fitness function. Using Genetic Algorithm and searching for optimum values of electrospinning processing conditions can significantly reduce experimental process time by identifying the most values that will yield specific qualities prior to production. Here desire fiber diameter for the electrospun fiber in GA set for 400 nm and then searching for optimum conditions started. The nearest fiber diameter to desire fiber diameter which achieved by GA was 330 nm that is derived by optimum parameters of 15wt% polymer concentration, 13cm electrospinning distance, 24 kV electrospinning voltage and 0.1ml/h for flow rate. Toward approving the GA results, the experimental tests done for achieving fiber diameter 400 nm experimentally. Besides, the effect of four important electrospinning parameters (flow rate, electrospinning voltage, and electrospinning distance and polymer concentration) on fibers diameters by Scanning Electron Microscopy evaluated. All these experiments have done to interpret differences between experimental and theoretical results. Two findings in this paper are remarkable:
The results show that increasing the PVDF concentration over the appropriate limit (16% (w/w) experimentally in this study) leads to the disappearance of smooth fibers and subsequent formation of further helix-shaped micro ribbons. In compare with theoretical results (15%w/w) in lower concentration it’s reasonable to have finer fiber diameter. Decreasing the flow rate, bead size will decrease until a non-beaded structure obtained, it resulted to have smaller fiber diameter theoretically with flow rate (0.1 ml/h) in compare with experimental flow rate (0.3 ml/hr). However; increasing voltage causes a faster removal of the solution on the needle tip but an over increasing of voltage results in the jet instability and consequently the formation of beads along electrospun fibers, because of this fact which is related to optimum electrospinning parameters by GA, presence of beads is more. Finally the results show that Genetic Algorithm is a suitable method to determine optimum influenced factors in electrospinning to achieve desire fiber diameter. The algorithm presented in this research can be assessing for other polymer solutions too.
None.
Author declares there is no conflict of interest.

©2017 Mokhtari, et al. This is an open access article distributed under the terms of the, which permits unrestricted use, distribution, and build upon your work non-commercially.