Journal of
eISSN: 2373-633X


Review Article Volume 2 Issue 5
Republican Clinical Hospital ''Pheophania'', Ukraine
Correspondence: Grabovetskyi Sergii, Republican Clinical Hospital, obolonskii prosp. 22-v, kv. 139 22, Pheophania, Kyiv, Ukraine, Tel 3.81E+11
Received: March 16, 2015 | Published: May 29, 2015
Citation: Sergii G. Proton magnetic resonance spectroscopy of focal intracranial lesions: role in clinical practice. J Cancer Prev Curr Res. 2015;2(5):132-142. DOI: 10.15406/jcpcr.2015.02.00052
Once limited to scientific experiences, 1H MRI spectroscopy is becoming a common adjunct to conventional MR imaging, beings used by radiologists in everyday practice. This article, based on a review of literature and personal experiences provides information and recommendations to neuro radiologists on the practical applications of 1H MRI spectroscopy of neoplastic and non-neoplastic CNS lesions, with a particular focus on the most common intracranial tumors, such as gliomas, and meningiomas with differential diagnosis from other CNS lesions.
Keywords: MRS, MRI spectroscopy, chemical shift images, brain metabolites, metabolite profile, CNS, focal brain lesions, intracranial tumor, intra-axial tumor, extra-axial tumor, glioma, meningioma, differential diagnostic
Proton (1H) magnetic resonance spectroscopy (1HMRS) is available as an option by most manufacturers and is becoming a common adjunct to magnetic resonance imaging (MRI), especially for the differential diagnosis of intracranial lesions. Spectroscopy can also be performed on other elements having nuclei with nonzero quantum number, such as 13C and 31R. However, this requires additional equipment, while the proton (1H) magnetic resonance spectroscopy requires only a test phantom and a software package, making it simple and inexpensive addition to MRI systems. Magnetic resonance spectroscopy is the only method to obtain information about the biochemical composition of tissues in vivo.
Brain metabolites
N-atsetylaspartat (Naa): 2.03 ppm (singlet) a neurotransmitter marker of intact and normal functioning of neurons, observed only in the brain parenchyma and neural tissue. In the normal brain parenchyma, its concentration depends on the density and functional activity of cells. All pathological processes, except for Canavan disease, lead to decreases of its concentration. In malignant neuroepithelial tumors its concentration is very low. In extra axial tumors and metastases Naa is absent. However, the precise role of Naa remains unknown. Naa concentration is estimated at medium and long TE, at short TE metabolites of close resonant frequency can contribute to the Naa peak.
Choline (Cho): 3.21 ppm (singlet). Free choline, phosphocholine, and glycerophosphocholine give a single peak of total choline (tCho). Choline plays a role in the synthesis of phospholipids that make up cell membranes. Its concentration rises with their synthesis and destruction. Therefore, choline is a marker of cell density and membrane turnover. In tumors, demyelinating lesions and infarcts, its concentration increases. Choline to N-acetylaspartate ratio (Cho/NAA) is regarded as one of the most important indexes of malignancy.
Creatine/phosphocreatine (Cr/PCr): 3.05 ppm (singlet). It is impossible to separate their peaks on standard equipment therefore it is usually referred as total creatine (tCr). Creatine plays a role in energy metabolism, is present in neurons and in neuroglia, and regarded as an energy marker. Creatine is the most stable among normal metabolites – its concentration varies at different pathological processes to a lesser extent than concentrations of other brain metabolites. Nevertheless, its level usually grows in proportion to the degree of tumor malignancy, but tends to decrease when necrotic processes start to dominate.
Myo-inositol (Myo, M-Ins): 3.52 ppm (doublet of doublets, peaks determined only at short TE 20-30 ms) - six-fold alcohol of cyclohexane. Its exact role in metabolism is unknown, but it is considered a glial marker, as the concentration increases with glial proliferation. Myo-inositol is also regarded as a marker of demyelination. High concentrations are observed in demyelinating lesions, inflammation and glial tumors. Glycine (Gly): 3.57 ppm (singlet peak reliably assessed only at intermediate and long TE, at short TE merges with myo-inositol peak). This simplest of amino acids is considered an antioxidant. High concentrations observed in glioblastomas, primitive neuroectodermal tumors, ependymomas, and neurocytomas.
Glutamine / Glutamate (Gln + Glu = Glx): 2.10-2.60 ppm (multiplet peaks determined only at short TE 20-30 ms). Glutamate is a neurotransmitter involved in mitochondrial processes. Glutamine controls neurotransmitters. The resonant frequencies of the two metabolites are close, therefore, dividing their peaks on standard equipment is currently unfeasible. High levels of glutamine and glutamate can be observed in meningiomas.
Lactate (Lac): 1.31 ppm (doublet, inverted peak due to J-coupling at intermediate TE 135-140 ms). It is a marker of anaerobic processes. Normally present in low concentrations inspinal fluid. High concentrations observed in some tumors (both benign and malignant, but more often in the latter) in areas of acute ischemia and inflammatory processes. At short TE the lactate peak merges with the lipid peak, hence it is referred as lipid-lactate peak (Lac / Lip). Estimate lactate concentration is possible only using medium and long TE.
Lipids (Lip): 0.94 ppm, 1.33 ppm (singlet, usually peaks are observed at short TE 20-30 ms) present in cell membranes, have short relaxation times. In normal brain parenchyma small peaks of free lipids can be observed only at very short TE. High concentrations of lipids indicate destruction and tissue necrosis. High peaks are observed in glioblastomas, lymphomas, metastases, subacute ischemic foci, tuberculous abscesses, sometimes in meningiomas. It’s important to note that scalp fat can lead to contamination of the voxel, especially when the region of interest (ROI) is close to the skull.
Alanine (Ala): 1.48 ppm (doublet, inverted peak due to J-coupling at intermediate TE 135-144 ms) –an amino acid whose role is not yet defined. Observed in meningiomas, pyogenic abscesses and glioblastomas. The resonant frequency is close to lactate (Lac – 1.31 ppm), so, their peaks may merge.
Acetate (Ac): 1.95 ppm (singlet) - product of the biochemical cycle of anaerobic microorganisms. Observed in pyogenica bscesses, empyema.
Succinate (Suc): 2.43 ppm (singlet) product of the biochemical cycle of anaerobic microorganisms. Observed in pyogenic abscesses, empyema.
Isoleucine (I-leu): 0.94 ppm, 1.01 ppm (multiplet, inverted peak due to J-coupling at intermediate TE 135-144 ms).
Leucine (Leu): 0.96 ppm, (multiplet, inverted peak due to J-coupling at intermediate TE 135-144 ms).
Valine (Val): 0.99 ppm (multiplet, inverted peak due to J-coupling at intermediate TE 135-144 ms).
Isoleucine, leucine, valine - amino acids (AA), high concentrations are observed in pyogenic abscesses and empyema. Since their resonant frequency coincides with the macromolecules (lipids and proteins), to assess their presence medium and long TE should be used.
Taurine (Tau): 3.25 ppm, 3.43 ppm (triplet) - organic acid, play role in osmoregulation, membrane stabilization. High concentrations of Taurine observed in primitive neuroectodermal tumors (PNET), including medulloblastomas, in pituitary adenomas and renal cell cancer metastases. At short TE peaks of taurine and myo-inositol can merge, at medium and long TE peaks have insufficient signal-to-noise.
Above were mentioned only the most important peaks for interpretation of the metabolite profile. Additional peaks listed in Table 1.1
|
Metabolite |
Chemical shift δ (ppm) |
|
CH3 Isoleucine |
0.94 |
|
CH3Lip |
0.94 |
|
CH3 Leucine |
0.96 |
|
CH3 Valine |
0.99 |
|
CH3Isoleucine |
1.01 |
|
CH3 Valine |
1.04 |
|
CH2 Isoleucine |
1.26 |
|
CH3Lac |
1.31 |
|
CH2Lip |
1.33 |
|
CH2Isoleucine |
1.48 |
|
CH3Alanine |
1.48 |
|
CH Lip |
1.5 |
|
CH2 Leucine |
1.71 |
|
CH3Acetate |
1.95 |
|
CH Isoleucine |
1.98 |
|
CH3NAA |
2.01 |
|
CH2Glu |
2.04 |
|
CH2Gln |
2.12 |
|
CH Valine |
2.28 |
|
CH2Glu |
2.34 |
|
CH2Glu |
2.35 |
|
CH2 Succinate |
2.43 |
|
CH2Gln |
2.46 |
|
CH2 NAA |
2.49 |
|
CH2 Glu |
2.5 |
|
CH2 NAA |
2.67 |
|
N(CH3) Cr |
3.03 |
|
N(CH3)3 Cho |
3.19 |
|
CH2SO3 Taurine |
3.25 |
|
H 5M-Ins |
3.28 |
|
NCH2Taurine |
3.43 |
|
(CH) 4M-Ins |
3.52 |
|
CH2 Glycine |
3.56 |
|
CH Glu |
3.77 |
|
CH Gln |
3.77 |
|
CH Alanine |
3.79 |
|
CH2Cr |
3.91 |
|
(CH2)2Cho |
4.05 |
|
CH M-Ins |
4.05 |
|
CH Lac |
4.1 |
|
H2O (37°) |
4.7 |
Table 1 Brain metabolites; configuration (multiplicity) of peaks
S, singlet; d, doublet; dd, doublet of doublets; t, triplet; q, quartet; m, multiplet
Demyelination: multiple sclerosis (MS): Demyelinating lesions occur in acute disseminated encephalomyelitis and nonspecific inflammatory process, but the most common cause is multiple sclerosis.
Multiple sclerosis is an autoimmune inflammatory disease of the central nervous system causing myelin damage of axonal membranes, leading to inflammation, demyelination, gliosis and axonal degeneration. According to the Poster's criteria, in contrast to other episodes of demyelination, in multiple sclerosis dissemination of lesions is observed in time and space.
Depending on the course of the disease, the most recognized classification define benign (20%), relapsing-remitting (25%), second-progressive (40%) and primary-progressive (15%) forms of MS.
In the acute phase of demyelination, destruction of myelin membranes occurs, accompanied by inflammation. Subsequently, in the subacute and chronic phase remyelination and gliosis begin. In the acute stage of demyelination an increase of Cho (membrane destruction) and Lac (inhibition of aerobic metabolism), and marked decrease in NAA (damage or dysfunction of axons) is observed.
At short TE increased concentrations of Lip (degradation processes), Glu (excitotoxicity that is associated with the destruction of axons) and M-Ins (astrogliosis and glial proliferation) can be detected. After the acute phase transition, in affected areas normalization of concentrations of Lac, Cho and Lip, can be observed, while NAA may recover for several months.3 Abnormal profile of metabolites can be found not only in areas of demyelination, but in white matter that appears normal on conventional MRI. A marked decrease in NAA, and increased concentrations of Lip, Glu and Cho in normal looking white matter can determine, with a high probability where in the future there new foci of demyelination may occur.3,4
Some authors argue that chronic foci in various forms of MS can show differences in metabolite profiles. Thus, in relapsing forms, an increase of myo-inositol (M-Ins/Cr) and a significant reduction in N-acetylaspartate (NAA/Cr) can be observed, in contrast to the benign form of disease (Figure 1).5
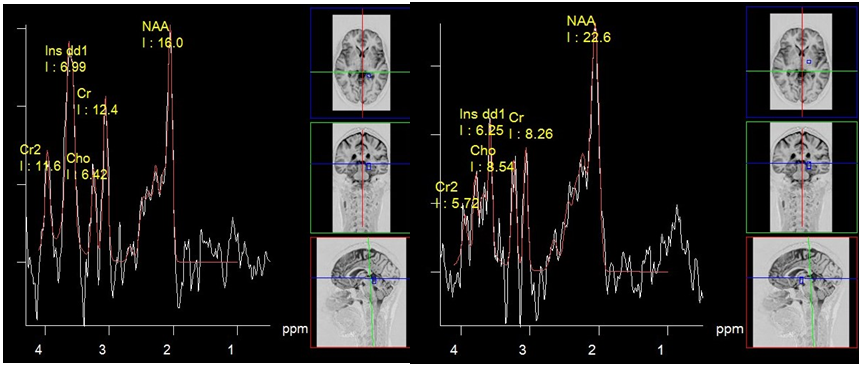
Figure 1 Multiple sclerosis, PRESS, TE 30 ms spectrum of metabolites of chronic plaque (a) and normal looking white matter (b). High concentration of myo-inositol is suggestive of relapsing-remitting form of disease.
Tumefactive demyelinating lesions on conventional MRI may be indistinguishable from intra axial tumors. In this case, MR spectroscopy can provide useful information (Figure 2). Although the metabolite profiles of demyelination lesions in the acute phase and tumors may be similar, in general, tumors show higher concentrations of choline and myo-inositol. Still there is no consensus among authors.6 According to C. Majós et al. the ratio ≥ 0.9 of M-Ins/NAA and ≥ 1.9 CHO/NAA is strongly suggestive for tumors.7 According to other studies, the only reliable criterion in differentiate tumors from demyelinating lesions NAA/Cr ratio in the central areas of lesions. For demyelinating lesions average NAA / Cr ~2.4, for gliomas~0.9.8
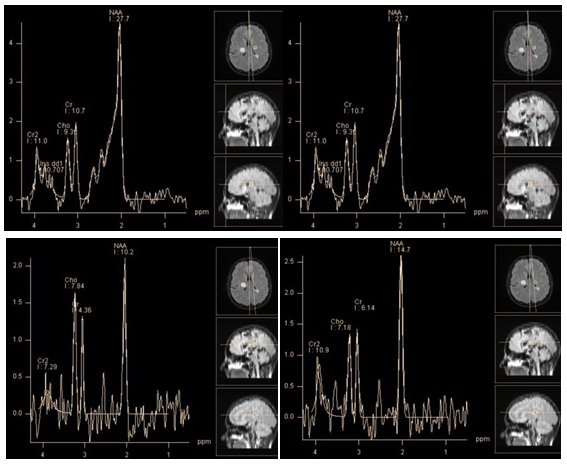
Figure 2 Chronic tumefactive demyelinating lesion in the right Corona radiata. PRESS, TE 30 ms(a, b) PRESS, TE 30 ms, PRESS, TE 135 ms (c, d). Spectra of the lesion (a, c)in comparison with normal brain parenchyma on the opposite side (b, d). At short TE, concentrations of the main metabolites in the lesion seem normal, marked by high peaks Lac/Lip 1.3 ppm and Lip/MM 0.9 ppm. At intermediate TE lactate peak is absent, there is only a slight decrease of NAA, Cho and Cr concentrations are normal. This "benign" metabolite profile helps rule out tumor.
Ischemia: Ischemic stroke or infarction is an acute cerebrovascular accident due to a deficiency of arterial blood flow of the brain, leading to hypoxia and development areas of necrosis. It mainly develops due to occlusion of arterial vessels. The variation in metabolite profile over time gives valuable information for the diagnosis and prognosis of the disease. In the acute phase of infarction its core shows signs of anaerobic metabolism and cell death. Accordingly, spectra from the affected areas are characterized by a high lactate peak, often in combination with significant lipid peaks (Figure 3). Lactate in low concentrations, can also be detected in "penumbra", the area surrounding the core of ischemia. Lactate remains during few weeks the in the affected area.
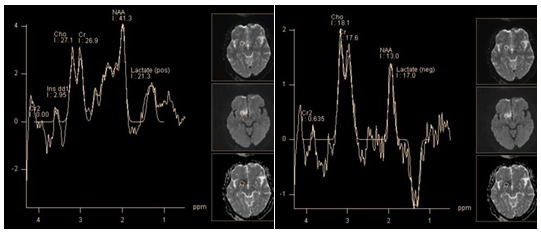
Figure 3 Super acute infarction. PRESS, TE 30 ms (a) PRESS, TE 135 ms (b) marked decrease in NAA and myo-inositol. High lactate peak.
The slow decrease of NAA concentration in the affected tissue during several days, which can occur even weeks after onset, can't be explained only by destructive action of enzymes on NAA. So, it was suggested, that it is caused by ongoing Ischemia in the affected area. This also may explain the presence of lactate in the core of ischemia in the subacute phase.9 This has important diagnostic value for prognosis, and further treatment (Figure 4).

Figure 4 Infarction, sub acute phase. PRESS, TE 30 ms (a) TE 135 ms (b), lactate concentration map (c) and choline concentration map (d) marked decrease in NAA and myo-inositol (b), the high peaks of lactate and lipids. The map shows that the maximum concentrations of lactate and choline coincide topographically.
Cho level may either increase or decrease in areas of ischemia in the acute and chronic phases.10 Higher concentration of Cho can be explained by gliosis and myelin membranes damage, while its decrease is a result of edema, necrosis and cell death.11
At the core of ischemia PCr rapidly converts to Cr.12 The level of total creatine (tCr - Cr / PCr) decreases immediately after the onset, and this decline can be observed for 10 days. Muñiz et al.,10 reported continuous reduction of Cr levels over a period of three months from the stroke onset.10 Estimation of the metabolite profile in the ischemic focus compared with the opposite side as a reference can lead to mistakes, as in a stroke the whole brain metabolism is disturbed.13
Neuroinfection: abscess, empyema: Brain abscesses are focal accumulations of pus surrounded by a capsule, developed from localized infection in the brain parenchyma (cerebritis). Subdural empyemas are accumulations of pus in the subdural space, which sometimes occur as complication of inflammation of the meninges (meningitis). Microorganisms that lead to the formation of abscesses are diverse and often include mixed culture: aerobic, anaerobic, facultative aerobic and facultative anaerobic bacteria.
Spectroscopy of pyogenic brain abscess and empyema demonstrate presence of specific metabolites such as succinate, acetate, alanine, valine, leucine, isoleucine, lactate and lipids, which makes it possible to differentiate them from other brain cystic lesions (Figure 5 & 6) High levels of lactate, acetate and succinate can be explained by increased glycolysis and fermentation of microorganisms. Such amino acids, as valine and leucine are the final product of proteolysis by enzymes released by neutrophils in pus.14 Neurons in abscesses are absent, so peaks of NAA and Cr should not be detected. The presence of these peaks can be explained only by misplaced voxels, or its contamination from adjacent parenchyma. Also, an acetate peak, which is close to NAA resonance frequency (Ac - 1.95 ppm, NAA - 2.01 ppm), can be erroneously attributed to the latter. Cho is also absent in the abscess cavity, since the necrotic core lacks membranes.

Figure 5 Chronic pyogenic abscess. PRESS, TE 135 ms. The spectra from the abscess cavity (a) show inverted peaks of lactate (1.31 ppm), amino acids (isoleucine, leucine and valine - 0.96 - 1.01 ppm), and the abscess wall(b), shows an inverted peak of lactate and considerable reduction of N-acetylaspartate.
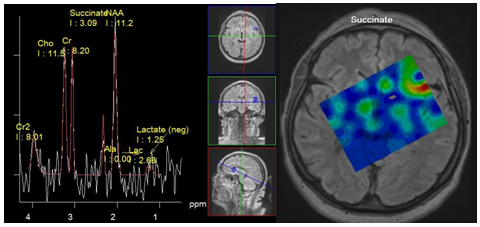
Figure 6 Meningitis. Spectra obtained from Lateral sulcus area near the small subdural empyema, PRESS, TE 135 ms (a) Map of succinate concentration. The peak of succinate 2.4 ppm can be seen (a), and its maximum concentration is localized in the sulcus (b).
TBC abscesses are characterized by dominant lipid peaks and the presence of Cho. The presence of cytolytic amino acids have not been observed.15
The results of spectroscopy in differential diagnosis between purulent abscesses and necrotic tumors are not always unambiguous, but the presence of the abovementioned amino acid peaks undoubtedly testifies to the abscess (Figure 5 & 7). Note that in chronic abscesses after drug treatment peaks of amino acids cannot be detected.16
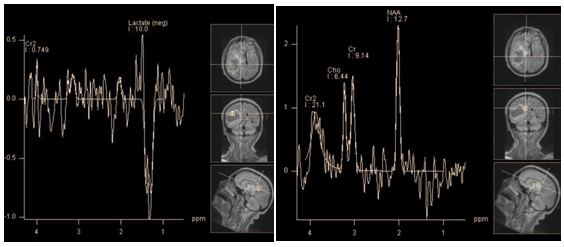
Figure 7 Cystic (necrotic) tumor - glioblastoma, PRESS, TE 135 ms. The spectra obtained from the cystic cavity(a) show an inverted peak of lactate - (1.31 ppm); spectra obtained from cystic wall (b) show a minor peak of lactate and almost normal profile of major brain metabolites (which is not typical for glioblastoma).
Role of spectroscopy
Meningiomas and other extra axial tumors:
According to the WHO classification there are three main types:
Most meningiomas have typical radiological features: distinct extra axial localization (CSF rim), involvement of the meninges (dural tail) etc. But in some cases they must be differentiated from other tumors with similar features. First of all, with other extra-axial tumors: neurinomas (cerebellopontine angle localization), pituitary adenomas (parasellar localization) hemangiopericytomas (meningeal tumors of mesenchymal, non-meningeoendotelial origin, which in most cases do not differ from meningiomas on conventional MRI), and meningeal metastases.
Intra axial (neuroepithelial) tumors with superficial or intraventricular localization may also require differential diagnosis with meningiomas. Namely choroid plexus tumors (choroid plexus papilloma, choroid plexus carcinoma).
Meningiomas, like other extra cerebral tumors do not originate in the brain parenchyma, so they do not contain NAA. The presence of a peak at the resonant frequency close to 2.0 ppm, which is often observed in spectroscopy of meningiomas, may be explained by voxel contamination, and possible presence of endogenous N-acetyl compounds (NACs): N-acetylaspartylglutamat and N-acetylgalactosamin.17 Interestingly, the peak at 2.0 ppm was detected in the sinus mucocele. Andre et al. suggested this peak may be caused by the presence of N-acetyl glycoproteins.18 (In our observations of 25 meningiomas, the peak NAA, which was significantly higher than noise level, was never detected when using intermediate TEs). The typical spectra of meningiomas shows a high concentration of Cho and low Cr. Cho/Cr ratio in meningiomas is higher than in gliomas and metastases.19 Lactate and lipids in meningiomas may be present in different concentrations. Alanine (doublet, 1.48 ppm), is considered to be a marker of meningiomas by many authors.20,21 However, while its resonant frequency is close to lactate (doublet, 1.33 ppm) their peaks may merge. Also, both metabolites have inverted peaks at intermediate TE 135 - 144 ms. In practice alanine is detected in less than 50% meningioma cases.17 (In our studies, a clear peak of alanine, separate from the lactate was determined in 5 cases out of 25).
New studies that focus on glutamine/glutamate (2.05 - 2.6 ppm), and glutathione (2.95 ppm) peaks, convincingly demonstrate a high concentration of these metabolites (associated with metabolic cycle of alanine) in meningiomas22,25 (Figure 8). In our studies, all 25 (100%) meningiomas demonstrated a dominant concentration of the glutamine/glutamate complex. Kousi et al.,26 found a typical chemical compounds for meningiomas that can be detected at 3.8 ppm using short TE, as a "distinct peak" (Figure 8). In vitro studies suggest that the "distinct peak" is likely to consist of the sum of resonant frequencies of phosphoethanolamine, alanine, glutamine and glutamate.23 (In our study, in 24 of 25 of meningiomas a "distinct peak" was clearly present).

Figure 8 A typical metabolite profile of meningioma. PRESS TE 30 ms (a), PRESS TE 135 ms (b). Alanine peak (1.5 ppm) partially merge with those of lactate (a,b). The dominant peaks of Glx (a). High choline peak. "The distinct peak" * (a) also can be seen on the spectra, obtained with TE 135 ms at 3.8 ppm (b).
Attempts of some authors to discriminate the degree of anaplasia of meningiomas by concentrations of such metabolites as glutamine/glutamate complex, glutathione,24 and lipids,25 did not give convincing results yet.26
Pituitary adenoma and craniofaringioma are the most common tumors of this localization. In most cases it is technically difficult to obtain quality spectra of metabolites in this area, especially for small tumors. So, there is little data in the literature.
Adenoma, originating from the adenohypophysis does not contain N-acetylaspartate, as well, as other extra cerebral tumors. Chernov et al.,27 describe the "substantial reduction of NAA" in adenomas.27 In our studies, 4 of 5 adenomas showed an evident peak at 2.0 ppm using intermediate TE (in the other extra axial tumors this peak at intermediate TE was absent or barely rose above the noise level). Perhaps, in adenomas this peak corresponds to other N-acetyl compounds, such as N-acetyl glycoproteins (Figure 9). Creatine can be found in a very low concentration or absent.28 The concentration of choline may be relatively high, also sometimes can be observed peaks of lactate and lipids.29

Figure 9 Spectra of pituitary adenoma. PRESS TE 30 ms (a), PRESS TE 135 ms (b) in comparison with suprasellar meningioma. PRESS TE 30 ms (c), PRESS TE 135 ms (d). Peak at 2.0 ppm in the spectra of adenoma, corresponding to NAA resonant frequency, is evident on both short (a) and Intermediate (b) TE. High peak myo-inositol at 3.58 ppm is present (a) there are no peaks of alanine and lactate, and low concentrations of glutamine/glutamate complex (a).
Craniopharyngiomas - tumors originating from craniopharyngeal channel. There are two types of such tumors - adamantinomatous and papillary craniopharyngiomas. The first type occurs mainly in children, the second - in adults. Adamantinomatous craniopharyngiomas almost always have cystic component of significant size and multiple calcifications in a solid part. For papillary craniopharyngiomas calcifications are not typical and cysts are usually smaller.
Some authors state, that in the spectrum of craniopharyngiomas peaks of metabolites are absent, but there are additional peaks caused by the presence of calcifications and microcysts.27 Others describe peaks corresponding to resonance frequencies of lipid and lactate.29 Probably the first describe spectra obtained from the solid part (no peaks of metabolites), and the latter, describe spectra of the cystic part of the tumor (lipids and lactate peaks). Histological analysis confirmed the presence of cholesterol and lactate incysts (Figure 10).
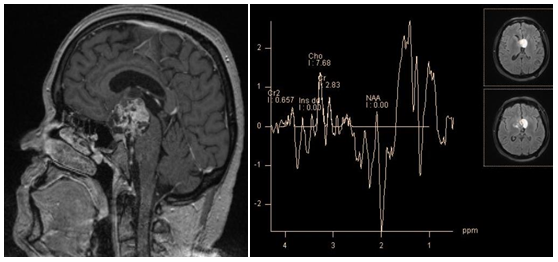
Figure 10 Craniopharyngioma, T1-WI (a) PRESS TE 30 ms (b) spectra, obtained from cystic part; broad lipid peaks are seen - 0.9 ppm and 1.3 ppm.
Neurinoma account about 8% of all intracranial tumors, and 85% of tumors of cerebellopontine angle localization. Often they have to be differentiated from meningioma. As in the case of tumors of suprasellar localization, it is technically difficult to obtain quality spectra of metabolites in this area for small size tumors. Yoshida et al. state that in the spectra of neurinoma, the creatine peak is absent, choline is present, but to a lesser concentration than in meningiomas, and it shows the highest concentration myo-inositol of all intracranial tumors.28 Also, in spectra of neurinomas can be observed lipid and lactate peaks (Figure 11).
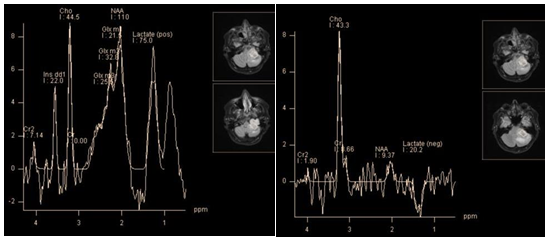
Figure 11 Recurrent neurinoma of hypoglossal nerve. PRESS TE 30 ms (a), PRESS TE 135 ms (b), high peak myo-inositol (3.56 ppm), high lipid and lactate peaks (0.9 ppm and 1.3 ppm), and glutamine/glutamate complex (a). At TE 135 ms dominates choline peak, inverted lactate doublet is still pronounced (but much less than lactate + lipids peak at TE 30 ms), small NAA peak remains, probably caused by contamination of the voxel (b).
The metabolite profile of hemangiopericytoma, like of the most other extra axial tumors shows high levels of choline, creatine and lack of N-acetylaspartate. Unlike meningiomas, the level of the glutamine/glutamate complex is not high, alanine is not recognized, a "distinct peak" at 3.8 ppm is absent. Instead, hemangiopericytomas show high peaks at 3.56 ppm, and 3.4 ppm, attributed to myo-inositol/glycine, and glucose, respectively, by some authors.30,31 However, according to Young-Dae Cho et al.,32 these peaks should be classified as resonant frequencies of the "unknown molecule" because; in contrast to myo-inositol and glucose (that have T2 within 110 ms) both of these peaks are observed at long TE.32 However, it is not clear, why glycine, which has the same resonant frequency as myo-inositol (3.56 ppm), and long T2, was not mentioned by the authors (Figure 12).
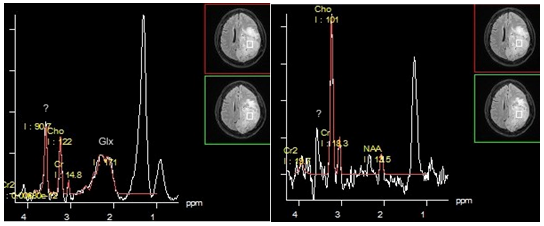
Figure 12 Hemangiopericytoma. PRESS TE 30 ms (a), PRESS TE 135 ms (b). The dominant lipid peak at 1.3 ppm is seen on both short and intermediate TE, without changing phase (a,b). Also peak of "unknown molecule" / glycine (?) At 3.56 ppm clearly seen on spectra obtained with both TEs.
Choroid plexus papilloma and choroid plexus carcinoma are rare neuroepithelial tumors. Accordingly, there is little data in literature on their metabolic profiles. They should be differentiated from other tumors of this localization, especially with meningiomas, as well as oligodendrogliomas and central neurocytomas. Papilloma, as carcinoma show two dominant peaks: myo-inositol and choline. Ratio of choline and myo-inositol corresponds to the degree of malignancy: namely choline levels are higher in carcinomas. In addition, carcinoma may contain lactate. Peaks of creatine and N-acetylaspartate is absent in choroid plexus tumors. Metastases account for about 50% of all intracranial tumors. Solitary metastases first of all, should be differentiated with glioblastomas. But some of them, of superficial or meningeal localization, have the same radiological features as meningiomas. In this case spectroscopy plays an important role in differential diagnosis. The metabolite profile of metastases is characterized by two dominant peaks: choline and lipids at 1.3 ppm. Lipids in metastases of certain origin (lung cancer, etc.) can have long T2. Thus, the spectra obtained with TE 135 ms may show a positive peak at 1.3 ppm, instead of the inverted lactate doublet (Figure 13). Multiplets of the glutamine/glutamate complex are also sometimes observed, but not dominant as in meningiomas. Alanine and its "distinct peak" at 3.8 ppm are absent. The level of creatine is low, peak NAA, as in other extra axial tumors is missing.32 Metabolic profiles of metastases and glioblastoma have much in common33 but according to some authors, there are some differences19,34 which will be covered in more detail in the discussion of the differential diagnosis of Intra axial tumors.

Figure 13 Meningeal metastasis. PRESS TE 30 ms (a), PRESS TE 135 ms (b). The dominant lipid peak at 1.3 ppm is seen on both short and intermediate TE, without changing phase (a,b). Relatively high peaks Glx (a). Choline peak seems insignificant compared with the peak of lipids (a).
Gliomas and other intra axial tumors
Gliomas are a heterogeneous group of tumors that develop from glia. Gliomas account for approximately 30% of all intra cerebral tumors and 30% of all malignant brain tumors. They are histologically divided into astrocytoma, oligodendroglioma, ependymoma, and tumors of mixed origin - oligoastrocytomas. The most common are astrocytomas.
By the degree of malignancy gliomas are divided into 4 groups.
The general rule for metabolite profile of all gliomas is reduction of N-acetylaspartate (a marker of neuronal integrity) and increased levels of choline (a marker of cellularity, and membrane turnover), proportional to the degree of malignancy of tumors (Figure 14). But there is an exception of the rule. The most common of benign tumors, pilocytic astrocytoma (grade I), usually shows a very "aggressive" metabolite profile, with a significant reduction of NAA, high level of lactate and relative increase of choline (Figure 15). According to Hwang et al. the typical rate of main metabolites of pilocytic astrocytomas is Cho/NAA - 3.40, Cho/Cr - 3.46. The main difference between the profiles of pilocytic astrocytoma and malignant neuro epithelial tumor is the absence of a dominant lipid peak.35

Figure 14 Glioma follow-up PRESS, TE 135 ms. First discovered glioma, showing a moderate decrease in NAA and increased Cho levels, which is a typical profile of metabolites for benign (grade II) glioma (a). Observation after 2 years of the same tumor (b). Tumor size did not change significantly, but ratio of Cho/NAA and Cho/Cr is highly suggestive of malignization, a transition to grade III.
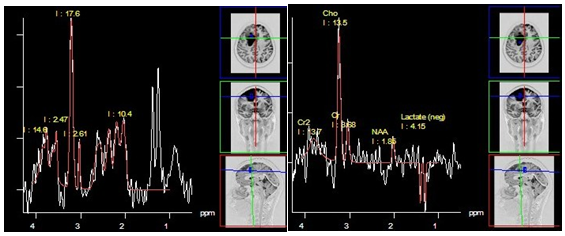
Figure 15 Pilocytic astrocytoma (grade I), PRESS, TE 30 ms (a) and PRESS, TE 135 ms (b). Both sequences demonstrate a high lactate doublet, a significant decrease in NAA and Cr, as well as a high Cho level. This "aggressive" metabolite profile is rather typical for this histologic type.
The ability to differentiate histological types of gliomas, by means of the spectroscopy, most authors consider questionable,19,36,37 Although others argue that metabolite profile of oligodendroglioma and ependymoma differ from that of astrocytoma. Rijpkema et al.,38 and colleagues insist that oligodendroglioma shows higher Glx concentrations using a short TE,38 Majos et al.,39 and colleagues write that the high peaks of myo-inositol/glycine (3.56 ppm) in ependymoma help differentiate it from other gliomas.39
Currently spectroscopy is used for determining the degree of malignancy of gliomas, as it affects treatment strategy. According to Kousi et al.,26 the most sensitive and specific criteria for differential diagnosis between relatively benign (grade II) and malignant gliomas (grade III - IV) is the Cho/NAA ratio using an average TE and Cho/Cr ratio using short TE.26
The average ratio of Cho/NAA is 2.02 for benign, and 2.93 for malignant tumors. The average ratio of Cho/Cr is 1.52 for benign, and 1.90 for malignant tumors. Since malignant gliomas have a greater tendency to invasion than benign ones, according to the same authors, spectroscopy of peritumoral area is very important. The average ratio of Cho/NAA in peritumoral area is 0.83 for benign, and 1.22 for malignant tumors. The average ratio of Cho/Cr is 0.79 for benign, and 1.00 for malignant tumors.40 This data is consistent with observations of other authors.33,41,42
It is important to note, that in necrotic areas the level of all main metabolites including choline, tends to decline. So, glioblastomas can show either high or low choline concentration (Figure 16 & 17).19 Necrosis leads to a significant increase of lipids and macromolecule concentration. Thus, the dominant lipid peaks can be used as a marker of glioblastoma in differential diagnosis with anaplastic gliomas. In our own observations 6 of 23 glioblastomas, had low concentrations of choline, while areas with the lowest choline level were in the center of the tumor, while periphery, and peritumoral area showed its relative increase. All 6 glioblastomas with low choline concentration had dominant lipid peaks.
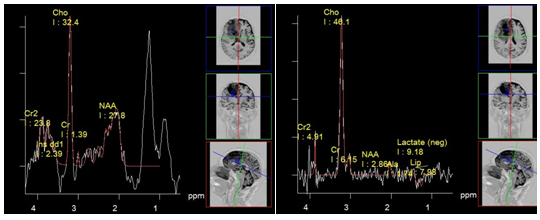
Figure 16 Glioblastoma with high Cho concentration. PRESS, TE 30 ms (a) and PRESS, TE 135 ms (b). The dominant peak at 1.3 ppm, using TE 30 ms (a) is almost entirely contributed by lipids as the inverse lactate peak at TE 135 ms (b) only slightly rises above the noise level.
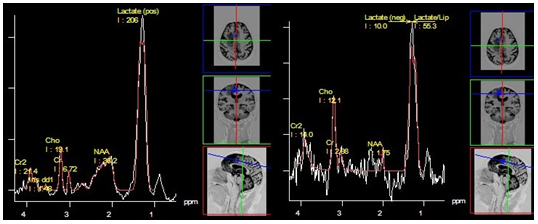
Figure 17 Glioblastoma with low Cho concentration. PRESS, TE 30 ms (a) and PRESS, TE 135 ms (b). The dominant peak at 1.3 ppm, (a) is due to the presence of lipids with long T2 - a positive phase both at TE 30 ms (a), and at TE 135 ms (b).
Lactate, unlike lipids, can be observed in gliomas of different degrees of malignancy.43 Its peak merges with the peak of lipids using short TE, but can be separated while using intermediate TE due to peak inversion (it is true for 1.5 T system; at 3 T system, lactate peak in most cases fail to invert)44 Therefore, in the analysis of the spectra obtained using short TE, the peak at 1.3 ppm is referred as "lipid-lactate" - LL.
An increase of the myo-inositol level is typical for gliomas. The highest level of myo-inositol shows a relatively benign (grade II) astrocytoma. According to Riyadh et al.,45 the average value of Myo/Cr is 0.49 for benign and 0.33 to 0.15 for anaplastic glioblastoma.45,46 Spectroscopy also provides clinically valuable information for planning stereotactic biopsy (Figure 18), in evaluation of perifocal areas after invasive tumor removal, for radiation therapy planning (Figure 19), and in discrimination between radionecrosis and tumor recurrence (Figure 20). In all these cases, the highest concentration of choline (Cho/NAA and Cho/Cr ratio) is estimated.
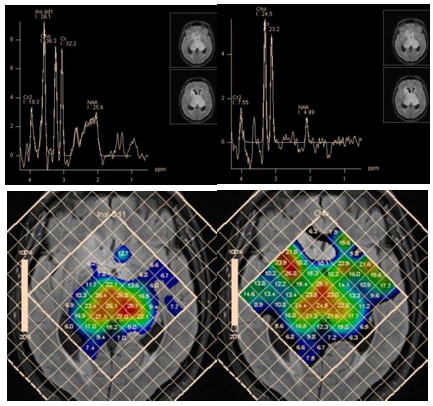
Figure 18 Bilateral thalamic astrocytoma. PRESS, TE 30 ms (a) and PRESS, TE 135 ms (b) and map of myo-inositol (c) and choline (d) concentrations, for planning stereotactic biopsy. Histological analysis revealed anaplastic astrocytoma, though high myo-inositol concentration is more typical for grade II gliomas.
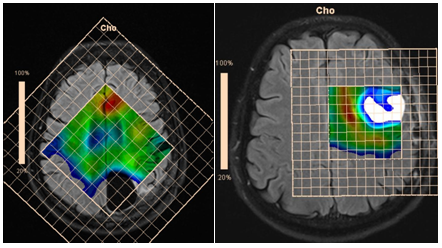
Figure 19 Maps of Cho concentrations in patients after removal of anaplastic astrocytoma without evidence of tumor invasion (a), and glioblastoma, with evidence of tumor invasion in the perifocal area (b).

Figure 20 Partial removal, and radiation therapy of glioblastoma of the right hemisphere PRESS, TE 135 ms (a) and concentration Cho map (b). Tumor recurrence is evident in the opposite hemisphere.
In the differential diagnosis between radionecrosis and recurrent glioma, it is important to remember that during 4 months after irradiation brain parenchyma may exhibit high levels of choline.47 According to Schlemmer et al.,48 for recurrent tumor average values are: Cho/NAA 3.44, Cho/Cr 2.30, while for areas of necrosis: Cho/NAA 1.29, Cho/Cr 1.26.48
In addition to determining the degree of malignancy of gliomas, they have to be differentiated from other intra axial masses. Benign gliomas - with tumefactive demyelinating lesions; malignant gliomas (especially glioblastoma) - with cerebral metastases, lymphoma and medulloblastoma.
Most authors agree that the examination of the peritumoral zone has greater value for differential diagnosis.52,53 Unlike glioblastomas, ration of Cho/NAA and Cho/Cr in the peritumoral area of metastases is close to those in normal parenchyma (Figure 21).
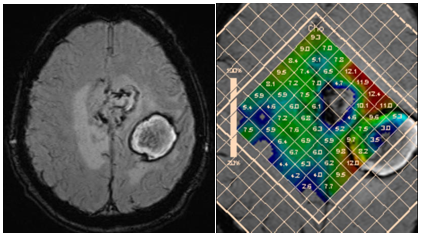
Figure 21 Two hemorrhagic foci in the left hemisphere; discrimination between glioblastoma and metastasi. SWI (a) and concentration Cho map (b). High choline levels in peritumoral area are in favor of multifocal glioblastoma.
III. Primary central nervous system lymphomas account 1% of all intracranial tumors. Lipomas typically show low diffusivity and active contrast enhancement. On MRI images they may not differ from gliomas. There are no significant differences in metabolite profiles between malignant gliomas and lymphomas either. On spectroscopy, lymphomas show a high concentration of choline, low concentration of creatine, and a significant reduction or absence of N-acetylaspartate. Although there is no necrosis in lymphomas, according to Chawla et al.,54 the lipid-lactate peak may be even higher than in glioblastomas (Figure 22).54 High concentrations of lipids are explained by macrophage accumulation. According to the same authors, due to the infiltration of lymphocytes and macrophages beyond the tumor borders, the peritumoral zone of lymphomas may show a characteristic profile of metabolites. Except for high values of Cho/Cr, which also applies to peritumoral area of glioblastomas, for lymphoma, increased lipid and lactate concentration in peritumoral zone is typical (the ratio Lip+Lac/Cr for lymphomasis higher than for glioblastomas).54

Figure 22 Lymphoma of the corpus callosum. PRESS, TE 30 ms (a) and PRESS, TE 135 ms (b). The dominant lipid peaks at 1.3 ppm and 0.9 ppm (a). The inverse lactate peak using TE 135 ms barely rises above the noise (b).
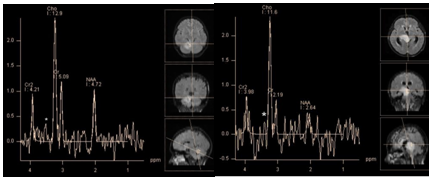
Figure 23 PRESS, TE 135 ms. Medulloblastoma (a) and glioblastoma (b) low peak at 3.4 ppm, which may correspond to taurine triplet (*) can be found on the spectra of both tumors.
Role of spectroscopy
1H-MRS is a valuable tool in solving difficult neurological cases, especially in discrimination focal intracranial lesions; however, it should be always considered a supplementary tool to other examinations and conventional MRI when reaching the final diagnosis.
In the analysis of the spectra it is important to remember: the Cho/Cr and Cho/NAA ratio at short TE is lower than at intermediate TE, while the LL/Cr ratio is higher. In discriminating focal intracranial lesions, ideally both short and intermediate TE should be used. While spectra obtained using short TEs provide information about wider range of metabolites, spectra at intermediate TE make it possible to estimate the concentration of NAA much more accurately, and discriminate metabolites with the same resonant frequencies but different T2, such as lipid/lactate, and myo-inositol/glycine. Analysis of the distribution of metabolites in affected tissue, and perifocal area provides additional valuable information.
None.
The author declares that there is no conflict of interest.
None.

©2015 Sergii. This is an open access article distributed under the terms of the, which permits unrestricted use, distribution, and build upon your work non-commercially.