Journal of
eISSN: 2373-633X


Research Article Volume 4 Issue 4
1Department of Applied Biosciences, University of Arkansas at Little Rock, USA
2Central Michigan University, USA
3Department of Biology, University of Arkansas at Little Rock, USA
4Department of Pharmaceutical Sciences, North Carolina Central University, USA
Correspondence: Md Zakir Hossain, Assistant Professor (Research), Department of Pharmaceutical Sciences, Laboratory of Cancer BioNanotechnology, Biomanufacturing Research Institute and Technology Enterprise (BRITE), North Carolina Central University , BRITE Building, Room # 1013 302 E. Lawson St., Durham, NC 27707, USA, Tel 919 530 6884, Fax 919 530 6894
Received: February 04, 2016 | Published: March 17, 2016
Citation: Akter R, Gealt MA, Kleve MG, et al. Cytotoxicity of wortmannin triggers programmed cell death in MCF-7 cells; biochemical and morphological analysis. J Cancer Prev Curr Res. 2016;4(4):114-118. DOI: 10.15406/jcpcr.2016.04.00125
Objective: The primary objective was to study whether the cytotoxicity of Wortmannin (Wtmn) triggers apoptotic programmed cell death on the widely-used model breast cancer MCF-7 cell to understand this small molecule’s biological signaling mechanisms.
Methods: In this present study, MCF-7 cells anti-proliferative activities determined by using MTT assays to quantify the cytotoxicity of the Wtmn. The direct cellular and molecular effect of Wtmn was investigated selectively using flow cytometric cell cycle, mitochondrial membrane potential (MMP) assays, fluorescent and phase contrast microscopy.
Results: Our biochemical and morphological experimental analysis showed that Wtmn inhibits the proliferation of MCF-7 breast cancer cells and facilitates their entry into the apoptosis mode of programmed cell death.
Conclusion: Our experimental results directed towards elucidating the cytotoxicity of Wtmn and it’s biological mechanisms indicates anti-proliferative and apoptogenic properties. This strategy can serve as a screening model for anti-cancer treatment in-vitro.
Keywords human breast adenocarcinoma, MCF-7, wortmannin, cytotoxicity, MTT, flow cytometry, Cell cycle, programmed cell death
MCF-7, human breast adenocarcinoma cell line; EMEM, eagle’s minimum essential medium bovine insulin; P-S, penicillin-streptomycin; TE, Trypsin-EDTA; ATCC, american type culture collection; AO, acridine orange; EB, ethidium bromide; PI, propidium iodide; PBS, phosphate buffer saline; FBS, fetal bovine serum
Breast cancer remains one of the most commons types of cancers among women worldwide.1 Study revealed that Akt, also known as protein kinase B (PKB) level was higher in MCF-7 cells among all other breast cancer cell lines, and enabling these cells to resist drug induced apoptosis.2,3 The PI3k-Akt pathway plays major role of increased apoptotic resistance in MCF-7 cells.4,5 Therefore, selectively inhibiting PI3k - Akt expression in breast cancer cells using small molecular inhibitors such as Wtmn might have potential therapeutic value in inducing apoptosis in MCF-7 cancer cells.1,6 We have thus hypothesized that Wortmannin (Wtmn), an irreversible and selective PI3K inhibitor, inhibits the proliferation of breast cancer cells (MCF-7) and facilitates their entry into apoptosis. The underlying hypothesis directed towards the objective to develop a potential treatment strategy for breast cancer through a selective, target specific anti-cancer agent that possesses both anti-proliferative and apoptogenic properties.
It is very important to assess the cytotoxicity of a pharmaceutical or chemical compound exposed to cancer cells for its potential application as a chemotherapeutic agent. Many chemical compounds can inhibit the tumor cells growth and exhibit cytotoxic effects, but all of them cannot triggers apoptotic programmed cell death7,8 Thus, it is important to determine whether the cytotoxicity of Wtmn on MCF-7 cells was associated with apoptosis induction.
Materials
The human breast adenocarcinoma cell line (MCF-7), Eagle’s Minimum Essential Medium (EMEM), bovine insulin, penicillin-streptomycin (P-S), and Trypsin - EDTA (TE) was purchased from American Type Culture Collection (ATCC, Rockville, Maryland). Acridine Orange (AO), Ethidium bromide (EB), Propidium Iodide (PI), and phosphate buffer saline (PBS) was bought from Amresco Inc. (Salon, OH). The MTT assay kit, DMSO, fetal bovine serum (FBS), standard tissue culture (75 cm2) flask with filtered cap, 6 well-plates for cell culture was purchased from BioExpress (Kaysville, UT).
Methods
Cell Culture, The established human breast cancer cell line (MCF-7) was cultured as described previously.1 Briefly, cells were cultured in Eagle’s Minimum Essential Medium supplemented with 10% (vol. / vol.) FBS, 0.01 mg/ml bovine insulin and penicillin-streptomycin at 37 °C with 5% CO2.
Phase contrast microscopy (PCM), The MCF-7 cells were cultured in triplicate into 6 well plates at a density of 1 X 10⁶ cells / well. The cells were treated with different concentrations of Wtmn for 24 hour period. To asses qualitatively, images were taken randomly using a Zeiss Axiovert 40 CFL® inverted PCM.
Fluorescence microscopy (FM), For fluorescence microscopy (FM), AO-EB double staining method was applied as previously described (Akter et al. 2012). Wtmn treated cells were pelleted, resuspended and stained with 20 µl AO (15 mg/ml) and EB 50 mg/ml) dye mixture in 1X PBS for 5-10 minutes at room temperature. Then 2-3 drops (20µl) of these cell solutions were placed in each slide with a coverslip. After those 5 to 6 images for each sample were captured randomly using Nikon 90i fluorescence microscope equipped with Nikon BR software. Untreated cells were used as negative control.
MTT assay, For quantitative MTT assay, 5X10³ - 104cells/well were seeded in 96 well plates followed by treatment with various (100nM-5µM) concentrations for desirable time periods. After that 10µl MTT solution were added in each well of 96 well plate and incubated at 37º C in 5% CO2 for 3 - 4 hours. The medium was then removed and the purple color formazon precipitations were dissolved in 150µl DMSO. Then the optical absorbance was measured with a Bio-Rad 680 microplate reader at 570nM wavelengths and at background 630 nM filters were used as references. Atleast, three individual experiments were conducted.
Cell cycle analysis, Cell cycle distribution of nuclear DNA was determined through PI staining method followed by DNA Flow-cytometry. Cells (~1x10⁶/ml) were treated with presence or absence of different Wtmn concentration for 24 hours. After the incubation period, pellets were collected by trypsinization, vigorously vortex for 10 seconds and continue vortexing while drop wise adding ice-cold 70% ethanol for fixing the cells followed by overnight incubation at 4oC. Then the ethanol removed by centrifugation and resuspended cell pellets in 0.5 ml PI staining solution containing 1 mg/ml PI, 0.1% Rnase and 0.1% BSA and incubated in dark for 30 minutes on ice.
Mitochondrial membrane potential, The effect of Wtmn on the mitochondrial membrane potential was determined by FCM using Rho-123 cationic dye. Briefly, the MCF-7 cells were grown at a density of approximately 1 X 10⁶ cells / well in 6-well flat-bottomed microtiter plates. After treatment with Wtmn for indicated times, cells were trypsinized and resuspended in 1 ml ice-cold PBS containing 1 µM Rho-123 for 30 minutes in dark at room temperature. The cells were then collected and washed three times with PBS and resuspended in 500 µl PBS followed by 30 minutes incubation on ice and the fluorescence emitted from Rho-123 was analyzed by FCM flow cytometry (FACS caliber®). To evaluate the MMP, the fluorescence of retained Rho-123 was measured on a histogram of FL1-fluorescence and the geometric mean fluorescence intensity (GMFI) was recorded by using FACS caliber® Flow cytometer (Becton, Dickinson). Cell Quest® software was used to perform data acquisition and analysis and at least 10,000 cells are recorded.
Statistical analysis
Experiments were done in triplicate. Data were expressed as Mean±Standard Error Mean (SEM). Significance was evaluated by a one way ANOVA and the student T- test.
Morphological microscopic apoptotic blebbing
In vitro, discrimination of apoptosis from necrosis either morphologically or biochemically is not always straight-forward.9 However, in accordance with other investigators8,10-13 using both PCM and FM some distinguishable morphological features were commonly accepted to confirm apoptosis from necrosis.
As shown from our experimental results, Wtmn treated MCF-7 cells using fluorescent microscopic double stained (AO - EB) image in Figure 1A & 1B), and phase contrast microscopic cells in Figure 1C-1E. They (Figure 1B, 1D& 1E) have distinct morphological apoptotic characteristics such as cell shrinkage with intact membranes as well as condensed cytoplasm along with membrane blebbing (onset of cytoplasmic budding) compare to control Figure 1A & 1C. Therefore, our Figure 1B, 1D & 1E leads to formation of apoptotic bodies.
MTT assay
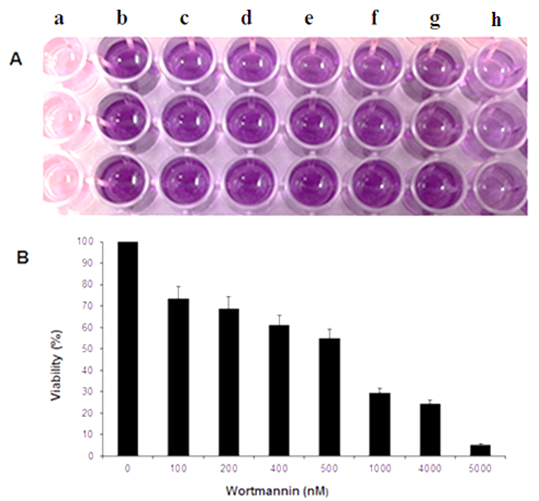
The cytotoxic effect of Wtmn on MCF-7 cell viability was determined quantitatively by MTT assay. Generally, the total amount of formazon production or the optical colorimetric signal is linearly and directly proportional to the number of metabolically active cells.14-15 The percentage of viability by MTT assay is determined using the following formula, Cell viability % = [{OD 570-630 nM of treated cells / OD 570-630 nM of control cells} x 100].16 Then the IC50 (the inhibitory concentration) is the concentration that kills 50% of the cells or inhibited the cell growth17 as calculated from a bar graph.
The percentage of cell death was calculated from the control cells and the calculated IC50 for Wtmn was 500nM. One-way ANOVA and student’s t test were used for statistical analysis to compare quantitative data. Results were expressed as mean ± SEM (n=3)*, p <0.05.
Role of Wtmn on cellular DNA content through cell cycle phase distribution of sub-G1
Wtmn treated MCF-7 cells stained with PI. The FCM was used to measure the sub-G1 peak accumulation, which is an indicative of apoptosis that resulting from DNA fragmentation. In this method, cells generally less stained up by DNA binding dye PI, after losing its DNA and accumulated as sub-G1 peak to the left side of histogram. The DNA content profile was detected by PI fluorescence using FCM. In our experiments, as shown in Figure 3 indicated that the percentage of sub-G1 population was increased significantly from 7.06 (A)%, to 15.56 % (B) and 21.33 % (C) after incubation with 0, 200nM and 1µM Wtmn, respectively for 24 hour.

Figure 2 The MTT assay. (A) Digital photograph of MCF-7 cells in 96 well plate for 24 hour without or with (100nM -4µM) Wtmn treatment showing after solubilized formazon a) media without cells b) control cells c) 100nM d) 200 nM e) 400 nM f) 500 nM g) 1µM and h) 4µM Wtmn treated cells respectively. (B) Bar Graph showing the microplate reader results at 570 nM wavelengths.

Figure 3 Effect of Wtmn on the cellular DNA content of MCF-7 cells. Cells were treated without Wtmn (A) Control cells or with (B) 200 nM and (C) 1µM Wtmn respectively for 24 hour, then fixed and stained with PI staining solution according to standard method as described previously in materials and methods section followed by flow cytometric DNA content analysis.
Increased percentage of cells in sub-G1 peak of treated groups (Figure 3B & 3C) compare to control group (Figure 3A) suggesting Wtmn treated MCF-7 cell’s involvement in apoptotic process through DNA fragmentation. Each plot is representing of three independent similar experiments.
The percentage of Sub-G1 population in the upper left corner of each plot indicated fragmented DNA, indicative of apoptotic cells. Each plot represented of three separate experiments. Representing cell cycle analysis of MCF-7 cells in response to Wtmn. After 24h incubation with A) 0nM, and B) 500nM of Wtmn, PI stained cells were analyzed using FACS.
Flow cytometric analysis of mitochondrial membrane potential (MMP) loss (∆ψm)
Flow cytometric mitochondrial parameter such as MMP analysis provides unique information of mitochondrial activities through fluorescent probe signal intensity.
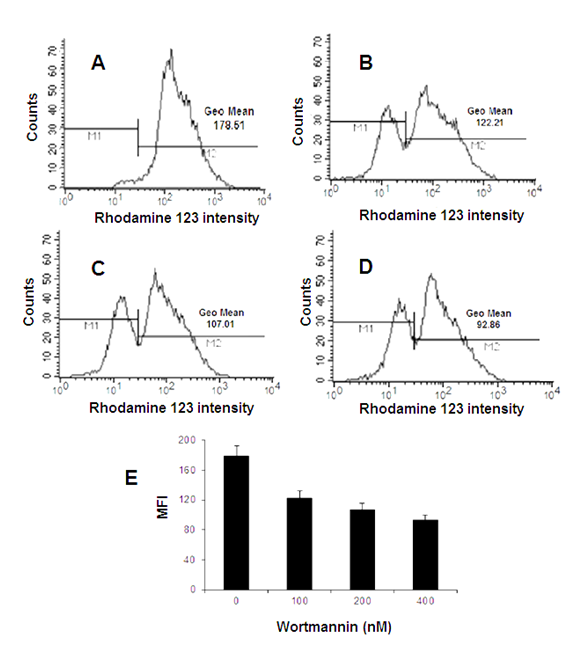
In our experiments, fluorescence intensity were detected by FCM showed that treatment of MCF-7 cells with different concentrations (200-400nM) of Wtmn that induced apoptosis (Figure 4), significantly decrease Rho-123 fluorescence intensity, a measure of total depolarization of MMP i.e. loss of ∆ψm through lower dye accumulation into mitochondria. The geometric mean values were decreased as shown in Figure 4B-4D than that of control group Figure 4A due to the shift in Rho-123 fluorescence to the left on the X-axis of the FACS histogram as evidence of drop of MMP suggesting Wtmn treated MCF-7 disrupted MMP indicator of early key events of apoptosis process.

Figure 4 Flow cytometric analysis of mitochondrial membrane potential loss (∆ψm) in MCF-7 cells, indicative of apoptosis induced by Wtmn. Cells were incubated in absence (A) Control cells or presence of (B) 100 nM (C) 200 nM and (D) 400 nM Wtmn respectively and stained with Rho-123 cationic dye for 30 minutes and the Rho-123 fluorescence intensity was detected by flow cytometry.
The numbers in parentheses Figure 4A-4D are the corresponding geometric means of Rho-123 fluorescence intensity was significantly decreased in FL-1 channel with increased Wtmn concentration compare to control (Figure 4A) cells. Figure 4E Bar graph showed reduced mean fluorescence intensity (MFI) compare to that of control. Each experiment was performed in triplicate with similar results.

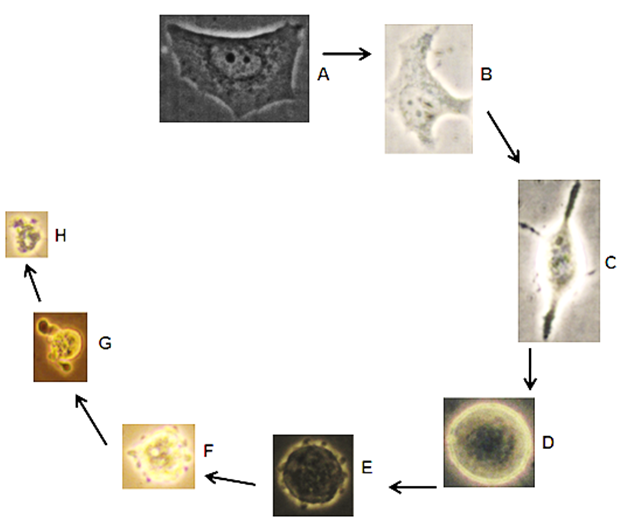
Figure 5 Apoptosis cycle; typical morphological apoptotic characteristics of Wtmn treated MCF-7 cells visualized under phase contrast microscope. (A) Control MCF-7 cells with polygonal shape and Wtmn treated cells with (B) Shrinked (C) Spiked (D) body rounded up with condensed content (E) Onset of apoptotic membrane blebbing F) Increased blebbing G) Final blebbing and formation of apoptotic body and finally (H) Degraded cell in vitro.
Apoptosis cycle
Since apoptotic processes are consists of distinct morphological mechanism, in our experiments, Figure 6 which are phase contrast images of different distinguishable events of apoptosis can be used as a confirmation of apoptosis in Wtmn treated MCF-7 cells.
In Figure 5A-5H showing distinct images of Wtmn treated MCF-7 cells have different morphological apoptosis characteristics. Typically, cell shrinkage, cytoplasm condensed with intact plasma membrane, extensive membrane blebbing resulted from chromatin condensation and subsequently proceeding nuclear DNA fragmentation leads to cytoplasmic apoptotic bodies (budding) formation and cytolysis in vitro were confirmed critical apoptotic phases through direct light microscopic visualization.
We have performed a series of different well known and widely accepted biochemical, and morphological apoptosis distinguishing assays to confirm the apoptosis inducing abilities of Wtmn in the MCF-7 cell lines.
These assays include morphological characteristics such as PCM for membrane blebbing, fluorescence microscopy using Acridine Orange (AO), Ethidium bromide (EB)/AO-EB staining, flow cytometric (FCM) cell cycle analysis through PI staining. Direct microscopic observation using PCM was used to determine and distinguish the cellular morphological characteristic changes. Mitochondrial dye conversions (MTT) assay was performed to evaluate the cell growth as well as death, based on mitochondrial metabolic activity of living cells. Thus, Wtmn induced cytotoxicity and cell death in MCF-7 cells were performed in our research.
Several studies reported that Wtmn exhibits anti-tumor effects on human breast cancer cell lines, which are not in details and incompatible with the MCF-7 contexts specifically in the programmed cell death i.e. apoptosis perspective.18-22 To study whether Wtmn could induce apoptosis in MCF-7 cell lines, we have treated MCF-7 cells with Wtmn for 24 hours time period and examined through morphological (both cytoplasmic and nuclear) as well as biochemical assays. The morphological differences between the normal and apoptotic cells were observed from PCM. In addition to morphological changes the typical apoptosis characteristics including loss of adhesion, cell shrinkage, membrane blebbing, reduced cellular volume with condensed contents, body rounded up further demonstrating Wtmn induced apoptosis of MCF-7 cells. Wtmn induced cell death was apoptotic cell death also confirmed by observing membrane blebbing using both fluorescence and phase contrast microscopy.
Furthermore, FACS analysis of cell cycle arrest and decreased MMP were demonstrated apoptotic cell death pathways.2,7,23-24 The rapid and sensitive MTT assay evaluates the mitochondrial activities to test cell viability as well as cell death.25 We have evaluated the Wtmn cytotoxicity quantitatively through spectrophotometric MTT analysis. As shown in digital photographed purple color gradually decreased with increased Wtmn concentration, indicating reduced formazon production consistent with PCM micrograph. Quantitative MTT assay showed reduced MCF-7 cell viability and inhibition of cellular proliferation induced by Wtmn in a dose-dependent manner. Moreover, more than 70% cell viability were detected at lower nanomolar concentration (100nM), whereas less than 30% viability were observed at micro-molar concentration (1µM) for the same time 24hrs incubation-period suggesting the cytotoxic effects of Wtmn in MCF-7 cells selectively depend on its concentration. In addition, dosage of Wtmn to inhibit 50% of MCF-7 cells proliferation (IC50) value was calculated at 500nM concentration.
Morphological observation revealed loss of adhesion, cell shrinkage, reduced cellular volume with condensed contents, and body rounded up in Wtmn induced apoptosis of MCF-7 cells. Therefore, the cytotoxicity or cellular damage results in disability of maintaining and providing energy for metabolic function and growth for Wtmn induced MCF-7 cells are performed in a dose dependent manner. At very low concentration these effects are not significant but with higher concentrations the effect was more evident and significant percentage of cytotoxicity induction characteristics was observed.
To conclude, the distinct cytotoxic assays were used in our research have long been popularly used for morphological and biochemical evaluation of cytotoxicity, viability, metabolic activity and cellular proliferation profile.7,14 These assays observed and quantified viability by examining visual microscopic, biochemical as well as metabolic components essential for cell growth. Therefore, our results suggested investigating in details the molecular pathway of apoptosis induction by Wtmn to the breast cancer MCF-7 cells. From our experimental results for the first time, it was clearly demonstrated that the Wtmn induced cytotoxicity in MCF-7 cancer cells significantly exhibit apoptogenic morphological and biochemical characteristics. This strategy can be used as a model for anti-cancer treatment in-vitro and a new source with potential therapeutic value.
None.
None.
The authors declare no conflict of interest.

©2016 Akter, et al. This is an open access article distributed under the terms of the, which permits unrestricted use, distribution, and build upon your work non-commercially.