Journal of
eISSN: 2373-633X


Electric field distribution of tumors of human pancreas at different locations like head, and tail of the organ is presented. Various values of voltages like 400 V, 800 V and 1200 V (ac) were applied at a frequency at 60 Hz. It was observed that the distribution of electric field is uniform around the electrodes for the applied voltage. Electric field values (439.4 V/cm for head and 574.252 V/cm for tail) were found to be dependent upon the shape of the part and location of application of voltages. Simulations were also conducted to find out the effect of applied voltage and resulting energy storage around the structure. Calculations were made to find out the resulting values of capacitance by application of voltages. Values of capacitance were found in the range of 0.824 nF to 2.77nF depending upon the values of applied voltage and size of tumor under study. Results obtained are encouraging to use the technique of electrochemotheray (ECT) as an alternate methodology for treating pancreatic cancer.
Pancreas is one of the most important human organs, which lies at the back of stomach and close to abdomen. This organ is responsible for the release of enzymes or fluids, which help in easy digestion of food leading to release of energy in human body.1 In the absence of pancreas failing to do its regular set of actions, human beings may get affected from diseases like diabetes.2 Besides improper functioning of this important organ, some kind of tumors may also rise in pancreas, which may lead to the development of more fatal disease of cancer.3
While its incidence rate is low (only 3.1 % of all new cancer cases in the US),4,5 its death rate is high. Pancreatic adenocarcinoma (PAC) is the most common pancreatic cancer. This occurs in 90% of all human pancreatic cancers. It is the most devastating disease, with overall 5-year survival of only 3–5%. In 2014, it was estimated that 46,000 new cases will occur with more than 40,000 deaths. This indicates that the current standard of cure is inadequate.
For medical practitioners, pancreatic cancer in a way is more challenging to treat as it does not show any symptoms till a very advanced stage of its development.6 The overall 5-year survival rate among patients with advanced pancreatic cancer remains to be less than 5 percent.7 Typically they are diagnosed at the late stages, and only 20% could be treated with surgery, which is very complicated due the location of pancreas amidst various major organs and major arteries (Figure 1a).8 Chemotherapy is also not useful in many patients due to the resistance of the pancreatic cell lines to the chemo drug. Thus, the standard techniques to treat cancer like surgery, radiation, and chemotherapy have not been very successful. So, there is a need for alternate techniques which may give a better ray of hope to the patients suffering from this deadly disease.
Electrochemotherapy (ECT) is emerging out as one of the important techniques for treatment of cancer. It is already being used for treatment of a wide variety of cancer affected tissues like those in breast cancer and head and neck cancers.9-11 Eventually, it is possible to use this for treating pancreatic tumors with and without drug (Irreversible electroporation, IRE.12,13 Towards this, it is of practical interest to study the electric field distribution of pancreatic tumors, which occur mostly (about 90%) in the head of the pancreas. Figure 1b8 shows the four parts of pancreas, head, neck, body and tail, where pancreatic tumors occur.
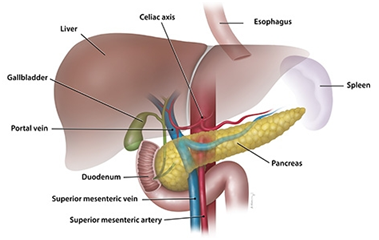
Figure 1a The Complex location of Pancreas.8
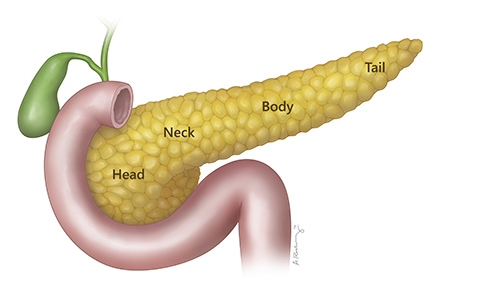
Figure 1b Head, neck, Body and Tail parts of Pancreas.8
Elecnet is a powerful tool in which a user can create models from materials and electrodes, view displays in the form of field plots and graphs, and get numerical values for quantities such as charge and force. For doing so, the tool uses finite element method (FEM) of solving field equations and calculating various quantities of interest.14 In an earlier research work,15 present group of researchers have studied the use of this tool to conduct simulation studies in the structure of the brain for possible treatment of tumor with the help of technique of electroporation. Figure 2 shows a pancreatic tumor configuration with the tumor in the head.16 A model of the pancreas,17 on which we have worked upon using Elecnet is shown in Figure 3.
Figure 2 Pancreatic tumor in the Head of Pancreatic cancer.16
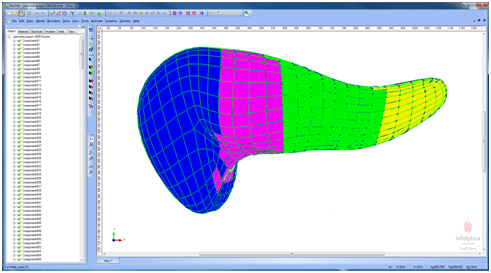
Figure 3 Screen shot of the Elecnet tool after importing the structure of Pancreas.17
For carrying all these simulations, AC voltage of 1200 V at 60 Hz frequency was applied. Table 1 shows the physical dimensions of model components along with the voltages applied in each case. Table 2 shows the electrical parameters used. Values of constants like electrical conductivity and permittivity mentioned in Table 2 for pancreas were taken from the work carried out by Clark et al.,18 and Gabriel et al.19
Model component |
Breadth × Height (cm × cm) |
Value of applied Voltage (V) |
Head |
0.5 × 0.2 |
400, 800, 1200 |
Tail |
1200 |
|
Tumor size |
2.2mm diameter |
|
Size of the needle electrodes |
0.001cm |
|
Table 1 Dimensions of the geometry used
Parameter |
Value |
Conductivity |
0.001S/m |
Permittivity |
3200 |
Conductivity of tumor |
0.005S/m |
Permittivity of tumor |
16000 |
Temperature |
20ºC |
Frequency |
60Hz |
No. of electrodes |
2 |
Table 2 Parameters used for the simulation
Electric field distribution
Figure 4 shows the model studied to simulate the electric field distribution of the tumor in the head of the pancreas. Three different values of voltages, 400V, 800V, and 1200V were applied to the head of the pancreas as indicated in and see its impact on the variation of distribution of electric field. Resulting electric field plots are shown in Figures 5a-5c respectively. Results of the plots shown in Figure 5, as summarized in Table 3 indicate that the values of maximum electric field are dependent upon the amount of applied voltage. A direct linear correlation was found to be existing between the two parameters. This is useful to vary the applied voltage depending up on the size of the tumor.
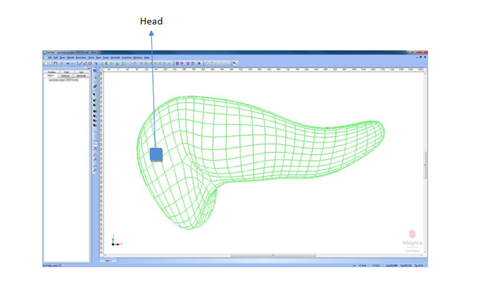
Figure 4 Representation of a tumor at Head region of the pancreas structure as obtained in Elecnet tool.
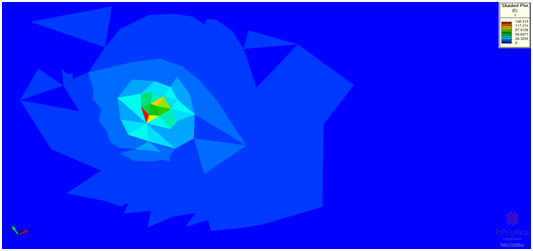
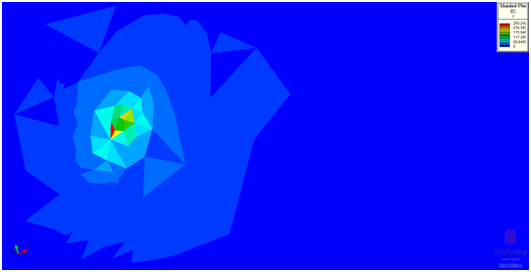
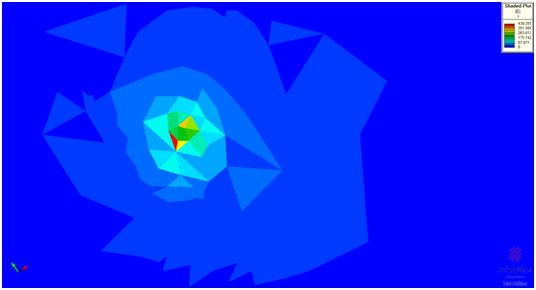
Figure 5 Distribution of electric field |E| against application of voltages of 400V (a), 800 V (b) and 1200 V (c) respectively.
Value of applied voltage |
Resulting maximum value of electric field (V/cm) |
400 V |
146.518 |
800 V |
293.242 |
1200 V |
439.353 |
Table 3 Values highlighting the direct correlation between applied voltages and resulting value of maximum value of electric field
Another point, which can be observed from these plots, is that the maximum of the resulting electric field owing to application of voltage centers around a particular point only. Rest of the structure of the pancreas shows a nil value. This particular point is quite an advantage of the technique of electroporation. A major requirement for the success of electroporation remains that the electric field should impact only those areas, where it is targeted.20 Our results of simulations highlight the same. Simulations were also performed on the tail region of the pancreas (Figure 6) at a voltage of 1200 V. The corresponding electric field distribution for tail region is shown in Figure 7.
Again, it is seen that the maximum of the electric field centers only around a particular location, and different values of electric field were observed for other locations. Figure 8 compares the values of maximum electric field at the head and tail of the pancreas studied. The variation in the maximum electric field values for the same voltage at the head and tail could due to the change in the geometry of these parts.
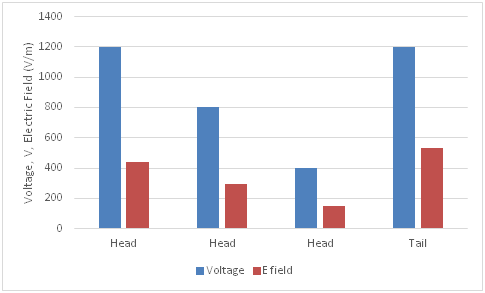
Figure 8 Comparison of applied voltages and resulting value of maximum electric field at Head and Tail.
Energy storage
Simulations were also conduced to ascertain the areas for maximum energy storage against the application of different values of voltages. One such typical plot recorded for simulations conducted close to tail region has been shown in Figure 9.
Energy distribution was found to be uniform and centered on the location of application of voltage. In general, owing to shape of pancreas in such a way where it has a large number of turning curves, it remains difficult to ascertain the exact area, where the electrodes need to be identified and apply the voltage across. So, the major challenge remains whether the effect of applied voltage remains almost uniform throughout the structure and whether technique of electroporation can be safely deployed to treat the tumor. Present simulations highlight positively toward the possible use of electroporation. Appropriate set of equations were developed to approximate the value of electric field prevailing over different parts of structure. For that, we assumed an infinitesimal component of the structure, dv, characterized by a volume charge density (ρ) whose magnitude is supposed to be varying with spatial location, x’.
Differential electric field at a point P due to this differential amount of charge contained in a differential volume dv’ is
(1)
Here R’ is the vector from the infinitesimal component, dv, to a point P.
Electric Field, E, as indicated in eqn. no. 2 can be obtained by principle of linear superposition and integrating the fields contributed by all the charges making up the charge distribution.
(2)
Capacitance
Capacitance values owing to application of voltages across different locations of pancreas were also calculated. Figure 10 shows these values.
Values of capacitance for all three different values of voltages for Head structure were found to be same. For understanding this, we can find out the basic relationship for capacitance for the structure which, we have adopted here to undertake these studies. A two needle array electrode, as shown in Figure 11 was used. By keeping one electrode at high potential, while retaining the other one at ground, we obtain a structure that is equivalent to a parallel plate capacitor.
Equation 3 below specifies the relation between the electric field intensity and charge on the plates–
(3)
In the above set of equations, understandably, D is Electric flux density, E is the Electric field intensity and ϵ is the relative permittivity.
(4)
where, u is the stored electrostatic potential energy, ϵ is the permittivity, s is the area of overlap of two plates of capacitance and ‘a’ is the distance between these two plates of capacitance.
While performing simulations, only applied values of voltage were changed. So, our results obtained as same value of capacitance irrespective of value of applied voltage on ‘Head’ are quite understandable. Value of capacitance for the tail region was found to be higher, depending upon the shape of the tail, compared to that of the head. The more non uniform the tumor region or the organ is, the higher is the electric field and hence the capacitance for the same voltage.
On the basis of simulation studies conducted in this work, it can be concluded that:
Rajnish Sharma gratefully acknowledges the support provided by Chitkara University, India in terms of sanctioning his sabbatical leave and allowing him to visit and work at Purdue University for this work.
None.

© . This is an open access article distributed under the terms of the, which permits unrestricted use, distribution, and build upon your work non-commercially.