Journal of
eISSN: 2469 - 2786


Research Article Volume 8 Issue 3
1Center for Genetic Engineering and Biotechnology, Cuba
2University of Sancti-Spiritus, Cuba
Correspondence: José Miguel Fernández Torres, Center for Genetic Engineering and Biotechnology, Cuba
Received: September 04, 2020 | Published: September 21, 2020
Citation: Torres JMF, Sánchez ALR, Pérez OV, et al. Purification of a mouse monoclonal antibody against Erns protein from classical swine fever virus. J Bacteriol Mycol Open Access. 2020;8(3):93-97. DOI: 10.15406/jbmoa.2020.08.00279
With the aim to follow large scale production of recombinant Erns from Classical Swine Fever Virus, a monoclonal specific antibody was obtained and optimized it downstream lab scale purification. The anti-Erns gamma globulins were purified through Protein A and Protein G affinity chromatography from ascites fluid. Three binding factors were assessed (pH, flow rate and buffer) to define dynamic binding capacity. The best binding condition to Protein a (6.6 mg/mL of matrix) was in phosphate buffer, pH 8.0 and linear flow rate of 78cm/h with a purity of 90 %. For Protein G, the best arrangement of factors was phosphate buffer, pH 7.0 and linear flow 178cm/h with 6.45mg/mL of adsorbed antibody with a purity of 95 %. The nProtein-A Sepharose matrix allowed 1.21 times more recovery than the nProtein-G Sepharose matrix. However, the elutions obtained with the G-protein were more pure.
Keywords: swine fever virus, monoclonal antibody, Erns, glycoprotein, biological marker, hybridoma
The classical swine fever (CSF) is a high transmission potential disease which produces economical lost in porcine farms from numerous countries. Its causal agent is the classical swine fever virus (CSFV) from which E2 and Erns glycoproteins are the most immunological,1 both used in DIVA (differentiating infected from vaccinated animals) systems to contribute to CSF eradication.2 Serological diagnosis has showed to be a useful tool to diagnostic of CSFV using the Erns glycoprotein as biological marker.3 In Cuba, This protein has been obtained from Escherichia coli Rosetta (DE3) transformed with pET22-Erns and purified by ion metal affinity chromatography (IMAC). To quality controls of the recombinant protein in downstream process is necessary an anti-Erns antibody (mAb). The objective of this work is to obtain a monoclonal anti-Erns antibody and to optimize purification through protein A and G affinity chromatography.
Three BALB/c mice were immunized with the recombinant protein obtained by the Center for Genetic Engineering and Biotechnology of Sancti-Spiritus. The same was dosified as follow: 1st dose – subcutaneously injection with 300µL of Erns protein (100µg) emulsified with complete Freud’s adjuvant, 2nd dose – subcutaneously injection with 300µL of Erns protein (50µg) emulsified with incomplete Freud’s adjuvant and 3rd dose – intra peritoneal injection with 300µL of Erns protein (20µg) emulsified with incomplete Freud’s adjuvant. The mouse with the highest antibody titer was selected by indirect ELISA and a spleen preparation was performed by collecting the splenocytes in RPMI-1640 medium (Millipore Sigma, USA). For the hybridoma preparation, the splenocytes were fused to myeloma cells from tumor line X63 / AG8 / 653 medium using 50% PEG1450 solution (Millipore Sigma, USA). The fused cells were centrifuged at 1000 rpm for 10 minutes and resuspended in 200mL of RPMI-1640 medium, containing hypoxanthine, aminopterin, and thymidine (Millipore Sigma, USA) and 20% fetal bovine serum (FBS) (Hyclone, Logan, UT, USA). The fused cells were plated (200 µL/well) in 96-well cell culture plates (CELLSTAR®, Greiner Bio-One, Spain). After incubation at 37°C with 5% CO2 for 7 to 10 days, the culture medium in each well was analyzed by indirect ELISA to detect the presence of specific mAb against Erns.
Hybridoma cloning was performed using the limiting dilution procedure method of cells grown in 96-well culture plates. Dilutions of 10; 2 and 0.5 cells/well were made with RPMI 1640 1X medium supplemented with 20% FBS in 96-well culture plates. All experiments were performed at 37°C in a humid 5% CO2 atmosphere. Cloning was monitored to detect the presence of mAbs against Erns by indirect ELISA. Finally, one hybridoma line was selected and frozen. The freezing medium was HT (Millipore Sigma, USA) supplemented with 10% of DMSO.
Generation of mouse anti-Erns mAbPurification of the anti-Erns monoclonal antibody. Purification was carried out through affinity to the bacterial receptors Protein A and Protein G immobilized in the matrix Sepharose 4 Fast flow (Sigma). The ascites obtained was previously filtered by glass wool and 0.45μm. To optimize purification process, were assessed dynamic binding capacity (DBC) and elution capacity on both gels (nProtein A Sepharose 4 FF and nProtein G Sepharose 4 FF). To determine DBC of was performed an experiment where pH (6.0, 7.0 and 8.0), buffer (1.5 M glycine – 3M NaCl and 0.1M Na2PO4) and flow rate (78, 178 and 278cm/h) were evaluated. The sample was always 5mL of ascites mixed with 5 mL of binding buffer (previously calculated to overloading the column). In all treatments was used the ascites at the same concentration and was eluted with 0.1 M Glycine-HCl pH 2.7. To evaluate the elution, two buffers (0.1M citric acid pH 3.0 and 0.1M Glycine-HCl pH 3.0). For statistical analysis, the SPSS 15.0 program was used. Factors (independent variables: buffer, pH and flow rate at DBC) influence was carried out by factorial analysis of variance. To estimate the magnitude of the effect of individual factors and the interaction between them on the dependent variable (DBC), the partial Eta square statistic was used. Multiple comparisons of means associated with the interaction between the three factors was performed using a t test for independent samples, using the Bonferroni adjustment for the level of significance. A critical level of a = 0.05 was used in all cases. To compare DBC in nProtein A Sepharose and n Protein G Sepharose, a t test was carried out.
Protein assay
Protein electrophoresis was performed on a 12% polyacrylamide denaturing gel with 2% Sodium Dodecyl Sulfate (SDS). Samples were diluted in loading buffer (125mM Tris-HCl, pH 6.8, 1% (w/v) SDS, 5% (v/v) glycerol, 10mM Dithiothreitol, 0.005% (w/v) Blue Bromophenol) and boiled for 10 minutes. The samples were run for about 45 minutes at a constant voltage of 200 V in running buffer (25 mM Tris-HCl, pH 8.8; 192mM Glycine; 35mM SDS). The gel was stained with a 0.1% (w/v) Coomassie R-250 solution, 40% (v/v) methanol, 10% (v/v) acetic acid for 20 minutes and the bands were visualized after gel destaining with a 10% (v/v) methanol and 10% (v/v) acetic acid. For western blotting assay, proteins were transferred (100V, for 1h) from the polyacrylamide gel to a PVDF membrane (Roche Diagnostics, Germany). As the primary antibody, the purified anti-Erns monoclonal antibodies were used (5 μg/mL) in skimmed milk powder (1%) - PBS-1X-Tween 20 (0.05%). As the secondary antibody, an anti- mouse IgG conjugated to alkaline phosphatase diluted 1: 20000 (Sigma Aldrich, USA) was used. Colorimetric detection was performed with 5-bromo-4-dichloro-indolyl phosphate and nitroblue tetrazolium (Promega, USA). Protein concentration was determined by Lowry´s method using bovine serum albumin as standard. 4
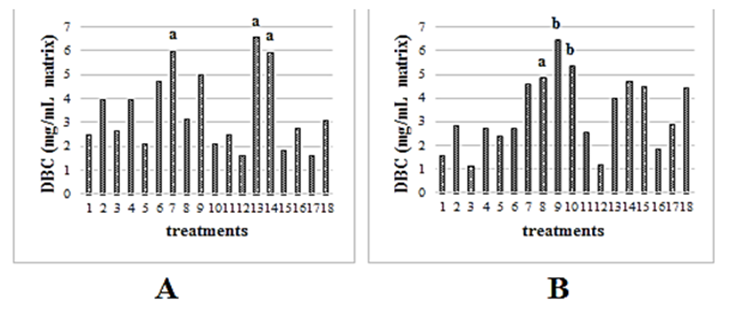
Three factors (pH, flow rate and buffer) were evaluated to set the optimal conditions for binding of the anti-Erns mAb to the beads. According to literature, these factors are the most influential in antibodies purification by Protein A and Protein G affinity chromatography.5 The analysis of each one in a complete factorial design allowed us to detect not only differences between variables, but also the influence of interaction among these three factors. The factorial ANOVA showed that factor ´´buffer´´ did not influence at each of factor combinations. To estimate the effect size of each factor and their interactions on DBC, the partial eta squared statistic was used, which provides a measure of variance explained into design used.6 In the protein A purifications, the most influential factor was ´´flow rate´´ followed by the interactions ´´pH * flow rate´´ and ´´pH * buffer´´. For Protein G ligand, like for Protein A, ´´buffer´´ factor neither did affect variance on purifications data. The most influential variable on protein G purifications was ´´pH´´, unlikely to Protein A purifications. However, the interaction ´´pH * flow rate´´ showed the higher partial eta squared values among all factors and their interactions. The maximal DBC for nProtein A Sepharose (6.6mg/ mL of packed matrix) was obtained with phosphate buffer, pH 8.0 and with flow rate of 78 cm/h (Figure 1A). Nevertheless, these conditions did not showed significant differences using both the same flow rate and the same buffer, but with pH 7.0 neither at treatment pH 8.0, flow rate 78cm/h and glycine-NaCl buffer (t2gl = -0.1; p = 0.930).

Figure 1 Estimated means of dynamic binding capacity (DBC) for both protein A (A) and protein G matrixes (B). Different letters on treatments (factors combination) of higher values imply significant differences between them (p≤0.05) for each matrix respectively. In both graphics the same treatments were used. Treatment 1: α, δ, λ; treatment 2: α, δ, ψ; treatment 3: α, ε, λ; treatment 4: α, ε, ψ; treatment 5: α, κ, λ; treatment 6: α, κ, ψ; treatment 7: β, δ, λ; treatment 8: β, δ, ψ; treatment 9: β, ε, λ; treatment 10: β, ε, ψ; treatment 11: β, κ, λ; treatment 12: β, ε, ψ; treatment 13: γ, δ, λ; treatment 14: γ, δ, ψ; treatment 15: γ, ε, λ; treatment 16: γ, ε, ψ; treatment 17: γ, κ, λ; treatment 18: γ, κ, ψ. (α=pH 6.0; β=pH 7.0; γ= pH 8.0; δ= linear flow rate 78 cm/h; ε= linear flow rate 178 cm/h; κ= linear flow rate 278 cm/h; λ= phosphate buffer; ψ= glycine-NaCl buffer).
Other authors have reported that optimal binding pH of Antibodies to Protein A is pH 8.07 which coincides with the pH established in the highest adsorption treatment. The flow rate at this combination (Treatment 13) was 78cm/h which could influence on DBC due to the increment of residence time on mobile phase enhancing interactions between both antibody and ligand. In DBC using protein Gas ligand, the factors combination which allowed highest adsorption (6.45mg/mL) was treatment 9 (phosphate buffer, flow rate of 178cm/h and pH 7.0) (Figure 1B). The pH and buffer used in this treatment has been reported as optimal conditions for IgG purification through protein G affinity chromatography.8 However, were not found significant differences between phosphate buffer and glycine-NaCl used under the same pH and flow rate conditions. Among the three treatment under which higher DBC was obtained, the treatment 8 (Glycine-NaCl buffer, flow rate 78cm/h and pH 7.0) allowed lower adsorption in comparison with treatment 9 (t1,5gl=13.8; p=0.016) and treatment 10.
Anti-Erns mAb elution by increasing C(H+)
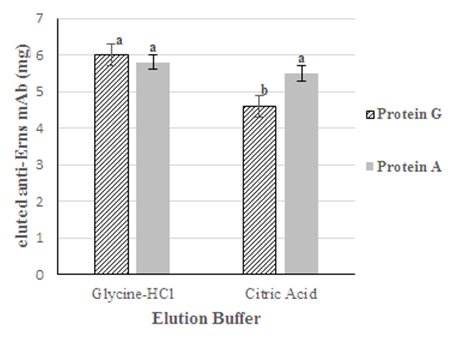
The optimal elution conditions are settled according to, among other factors, the recovery, purity and the activity which could lose under drastic elution conditions. In antibodies purifications through protein A and protein G affinity chromatography, the uncoupling between ligand and protein is generally carried out decreasing pH in the mobile phase.9 The increase of H+ ions lead to create an electrostatic repulsion between coupled proteins due to the positive charge acquired under low pH. Also, other interactions like hydrophobic are depleted, affecting affinity between ligand and antibody.8 In the elution of the anti-Erns mAb, two buffers (citric acid and glycine-HCl) were assessed with each ligand (Protein A and Protein G). Both buffers were used at pH 3.0 to achieve higher uncoupling of the antibody. To avoid irreversible denaturation of the antibodies, the elution’s were neutralized with tris 2M and dialyzed in 20mM Tris- 150mM NaCl, pH 7.0. Five chromatographic runs on each matrix and with both buffers were compared using recovery as dependent variable (Figure 2). Even when were not found significant differences in the nSepharose-Protein A matrix, the t test showed that in nSepharose-protein G, the recovery was different, being superior when the mAb was eluted with glycine-HCl buffer, suggesting that this buffer could be used as elution buffer for both matrixes.

Figure 2 Anti-Erns mAb elution in both matrixes (nProtein-A Sepharose y nPrtotein-G Sepharose) at pH 3.0. Different letters imply significant differences between both buffers for each matrix respectively, according to independent samples t.
Purification of the anti-Erns mAb from mouse ascites
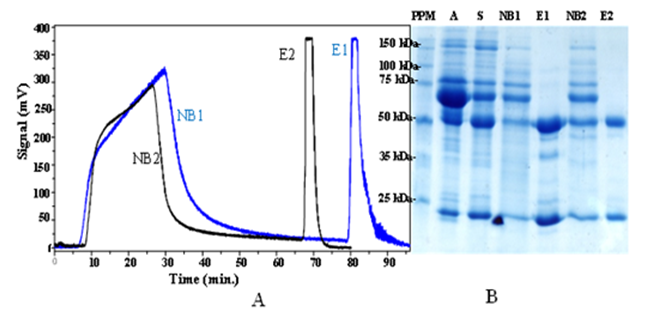
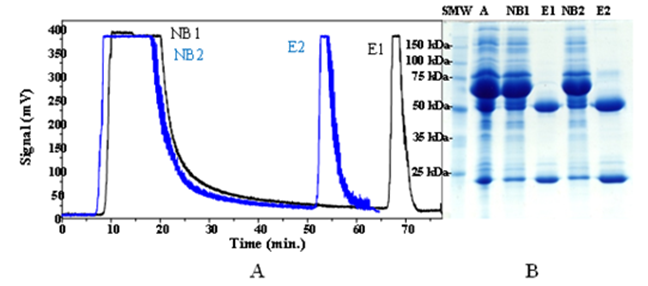
The Ab concentration was calculated quantifying the ascites and then estimating heavy and light chains proportion by densitometry of SDS-PAGE. Once known the amount of antibody in the ascites, was calculated the sample volume to pass through the column assuming 80% of total load following the DBC achieved previously and under the best evaluated conditions for both matrixes. Purification with previous precipitation with ammonium sulfate (Figure 3) was compared with purification without it (Figure 4). A 65kDa contaminant was seen in the elution’s from protein A and protein G purifications. This coeluted protein corresponds with the migration pattern of murine serum albumin and is the most common contaminant in Ab purification.7 Also is observed a 75kDa band which could be murine transferrin protein (80kDa).9 The purifications through protein G were obtained with more purity than for protein A (Table 1). It has been reported the protein gas convenient with respect to protein A for purification of murine IgG.10 However, other researchers report that the Ab-ligand affinity (protein A or protein G) depend on the mAb subclass.11 The elutions of purifications were lightly improved with the ammonium sulfate precipitation for both ligands. In this precipitation, the antibodies lose solubility through a salting-out process and contaminants like albumin and transferrin still in the soluble fraction. This reduces the interaction of the matrix with contaminants. The recovery obtained using protein A as ligand was superior to protein G. It could be due to different ligand density (mg of ligand per mL of matrix) between both matrixes. The recovery was affected when precipitation was carried out before purification with both nSepharose- protein A and nSepharose-protein G (Table 1). The nSepharose- ProteinA 4FF was established as the best option for the anti-Erns mAb purification due to the similar yields obtained and cheapest cost compared with nSepharose-protein G 4FF.

Figure 3 A: Chromatograms corresponding to nSepharose 4 Fast Flow with protein A (in blue) and protein G (in black) with ammonium sulfate precipitation. B: SDS-PAGE of different fractions. SMW: standard molecular weight. NB1: Not bound fraction in protein G affinity chromatography. NB2: Not bound fraction in protein an affinity chromatography. E1: Eluted fraction in protein G affinity chromatography. E2: Eluted fraction in protein an affinity chromatography.

Figure 4 A: Chromatograms corresponding to nSepharose 4Fast Flow with protein A (in blue) and protein G (in black) without ammonium sulfate precipitation. B: SDS-PAGE. PPM: standard molecular weight. NB1: Not bound fraction in protein G affinity chromatography. NB2: Not bound fraction in protein an affinity chromatography. E1: Eluted fraction in protein G affinity chromatography. E2: Eluted fraction in protein an affinity chromatography.
Protein A chromatography without precipitation |
Total proteins (mg) |
IgG (mg) |
IgG / total proteins (mg/mg) |
Purification factor |
Recovery (%) |
Ascites |
47.4 |
8.5 |
0.17 |
1 |
100 |
NB |
41.3 |
1.2 |
0.02 |
0.15 |
14.1 |
Elution |
6.28 |
5.65 |
0.9 |
5.2 |
67.4 |
Protein G Chromatography without precipitation |
Total proteins (mg) |
IgG (mg) |
IgG / total proteins (mg/mg) |
Purification factor |
Recovery (%) |
Ascites |
47.41 |
8.5 |
0.17 |
1 |
100 |
NB |
42.33 |
1.98 |
0.04 |
0.23 |
23.2 |
Elution |
4.97 |
4.73 |
0.95 |
5.5 |
55.6 |
Protein A Chromatography with precipitation |
Total proteins (mg) |
IgG (mg) |
IgG / total proteins (mg/mg) |
Purification factor |
Recovery (%) |
Ascites |
48.76 |
9.3 |
0.15 |
1 |
100 |
Precipitation |
29.45 |
7.8 |
0.2 |
1.3 |
83 |
NB |
20 |
1,02 |
0.05 |
0.33 |
10 |
Elution |
6.3 |
5,92 |
0.94 |
6.2 |
63.2 |
Protein G Chromatography with precipitation |
Total proteins (mg) |
IgG (mg) |
IgG / total proteins (mg/mg) |
Purification factor |
Recovery (%) |
Ascites |
48.76 |
9.3 |
0.15 |
1 |
100 |
Precipitation |
28.69 |
7.8 |
0.2 |
1.3 |
83 |
NB |
18.9 |
2.7 |
0.29 |
1.9 |
29 |
Elution |
3.9 |
3.74 |
0.96 |
6.2 |
40,2 |
Table 1 Recovery of purifications from ascites with and without ammoniumsulfate precipitation
A monoclonal anti-Erns antibody was obtained which was able to detect specific recombinant Erns protein. Purification through Protein A and G affinity chromatography was optimized and was determined that the best condition for antibody- nSepharose Protein A binding was in phosphate buffer, pH 8.0 and with flow rate of 78 cm/h. On the other hand the maximal coupling in nSepharose Protein G was achieved in phosphate buffer, flow rate of 178 cm/h and pH 7.0. The nProtein-A Sepharose matrix allowed 1.21 times more antibody recovery than the nProtein-G Sepharose matrix. However, the elutions obtained with the G-protein were more pure. The activity of the purified antibody was determined showing high specific recognition for recombinant Erns.
The Center for Genetic Engineering and Biotechnology (CIGB) is a Cuban institution of a dynamic development which has reached a high level of research and development of biological products (www.cigb.edu.cu).
None.
The authors declare that they have no potential conflict of interests.

©2020 Torres, et al. This is an open access article distributed under the terms of the, which permits unrestricted use, distribution, and build upon your work non-commercially.