Journal of
eISSN: 2469 - 2786


Research Article Volume 11 Issue 1
Laboratories, Indoor Environmental Consulting and Labs (IECL), Australia
Correspondence: Dr. Alexander D Wilkie, IECL, 5/158 Murarrie Road, Murarrie, Queensland, Australia
Received: February 01, 2023 | Published: February 9, 2023
Citation: Wilkie AD, Venz L, Letters S. Outdoor airborne fungal spores in Queensland, Australia. J Bacteriol Mycol Open Access. 2023;11(1):24-32 DOI: 10.15406/jbmoa.2023.11.00339
We present non-viable fungi concentrations from December 2021 to November 2022 in Queensland, Australia taken from outdoor reference samples collected during mould inspections. Our data indicate an average total mould concentration of approximately 6000 FS/m³ across the December 2021-November 2022 period. Trends in the data indicate higher levels of Aspergillus/Penicillium like spores in the December-May period changing to higher levels of Cladosporium in the July to September period. These data may be useful to mould inspectors in gauging normal mould ecology or unusual spore concentration levels in Queensland, Australia.
Keywords: mould inspection, fungal sampling, non-viable, air sampling, Air-O-Cell, fungi, building inspection, outdoor reference, outdoor comparison
AFD, Air Filtration Devices; ASTM, American Society for Testing and Materials; FS, fungal structures; IEP, Indoor Environmental Professional; IICRC, International Institute of Cleaning and Restoration Certification
Mould growth in living spaces pose a hazard to health and wellbeing of occupants.1,2 Sampling of buildings for mould remains a useful tool in identification of potential hazards to occupants.3,4 Visual inspection of premises for mould contamination may not capture the entire picture.5 Mould exposure has been linked to adverse health reactions6–12 therefore effective monitoring of mould is vital.
The majority of mould sampling to assess buildings for mould contamination in Australia is conducted using non-viable sampling techniques. This involves using spore trap cassettes to collect air samples and surface sampling primarily using tape-lifts. A strong preference for non-viable sampling has been observed worldwide due to the low cost and time effective analysis.13 Non-viable sampling has the benefit that it is able to detect the presence of viable and non-viable mould-both of which have been indicated as potential allergens.2,10,14–16 Fungal fragments have also been indicated as potential contaminants17,18 and inactive fungal material still release toxins long after viability is lost.19
Air sampling of indoor spaces must be accompanied with outdoor reference samples to provide meaningful data.20 In combination with outdoor reference data taken during inspections typical outdoor concentrations of mould are useful to mould inspectors to aid in the interpretation of mould sampling data.20 However, data on mould concentrations is limited and subject to variation from many factors. Publications on outdoor mould concentrations are few, and specific to the sampled locations.21–25 Data specific to regions remains a useful tool for inspectors who conduct sampling in the area in which the data is from. To our knowledge there are no recent articles published on outdoor fungal concentrations in Queensland, Australia, with the most recent study by Rutherford and colleagues in 1997.26
Thorough investigations of data on outdoor mould concentrations may also reveal trends in spore concentrations linked to various environmental conditions such as temperature, relative humidity, windspeed and rainfall.
Outdoor reference samples were collected by mould inspectors around Queensland and submitted to a laboratory for analysis. The data were sorted by months and a minimum of 38 samples for each month were analysed. Observed mould was categorised according to the categories based on ASTM D7391.27
Environmental data on temperature, relative humidity, wind speed and rainfall were obtained from Queensland government environmental monitoring facilities. Data was accessed through the website: https://apps.des.qld.gov.au/air-quality/download/ to be compared to the collected mould data. Data from all sites across Queensland were collected and the monthly averages calculated.
Boxplots were generated using Microsoft Excel (Microsoft Inc.). Mean, standard deviation and interquartile ranges were calculated. Separate experiments were performed N number of times as listed in each figure and table.
In order to provide insight into typical mould concentrations in outdoor reference samples collected in Queensland, Australia, multiple data points from each month were collected and analysed, to determine mould counts and composition. Monthly averages of mould concentrations were determined using a minimum of 38 data points from each month. The compiled monthly average data is presented in Figure 1. These data indicated that the highest mould concentrations were observed in February, March and April months; and the lowest in August and October. Our data indicate that typical outdoor mould concentrations in Queensland average at approximately 6000 FS/m³ and typically range from approximately 4000-22000 FS/m³. Aspergillus/Penicillium like spores were the most commonly observed spore type in the months of January through to June, and October. Cladosporium were the most common spore type in the months of July to September. Ascospores were the most common spore type in November. Basidiospores were the most common spore type in December 2021.
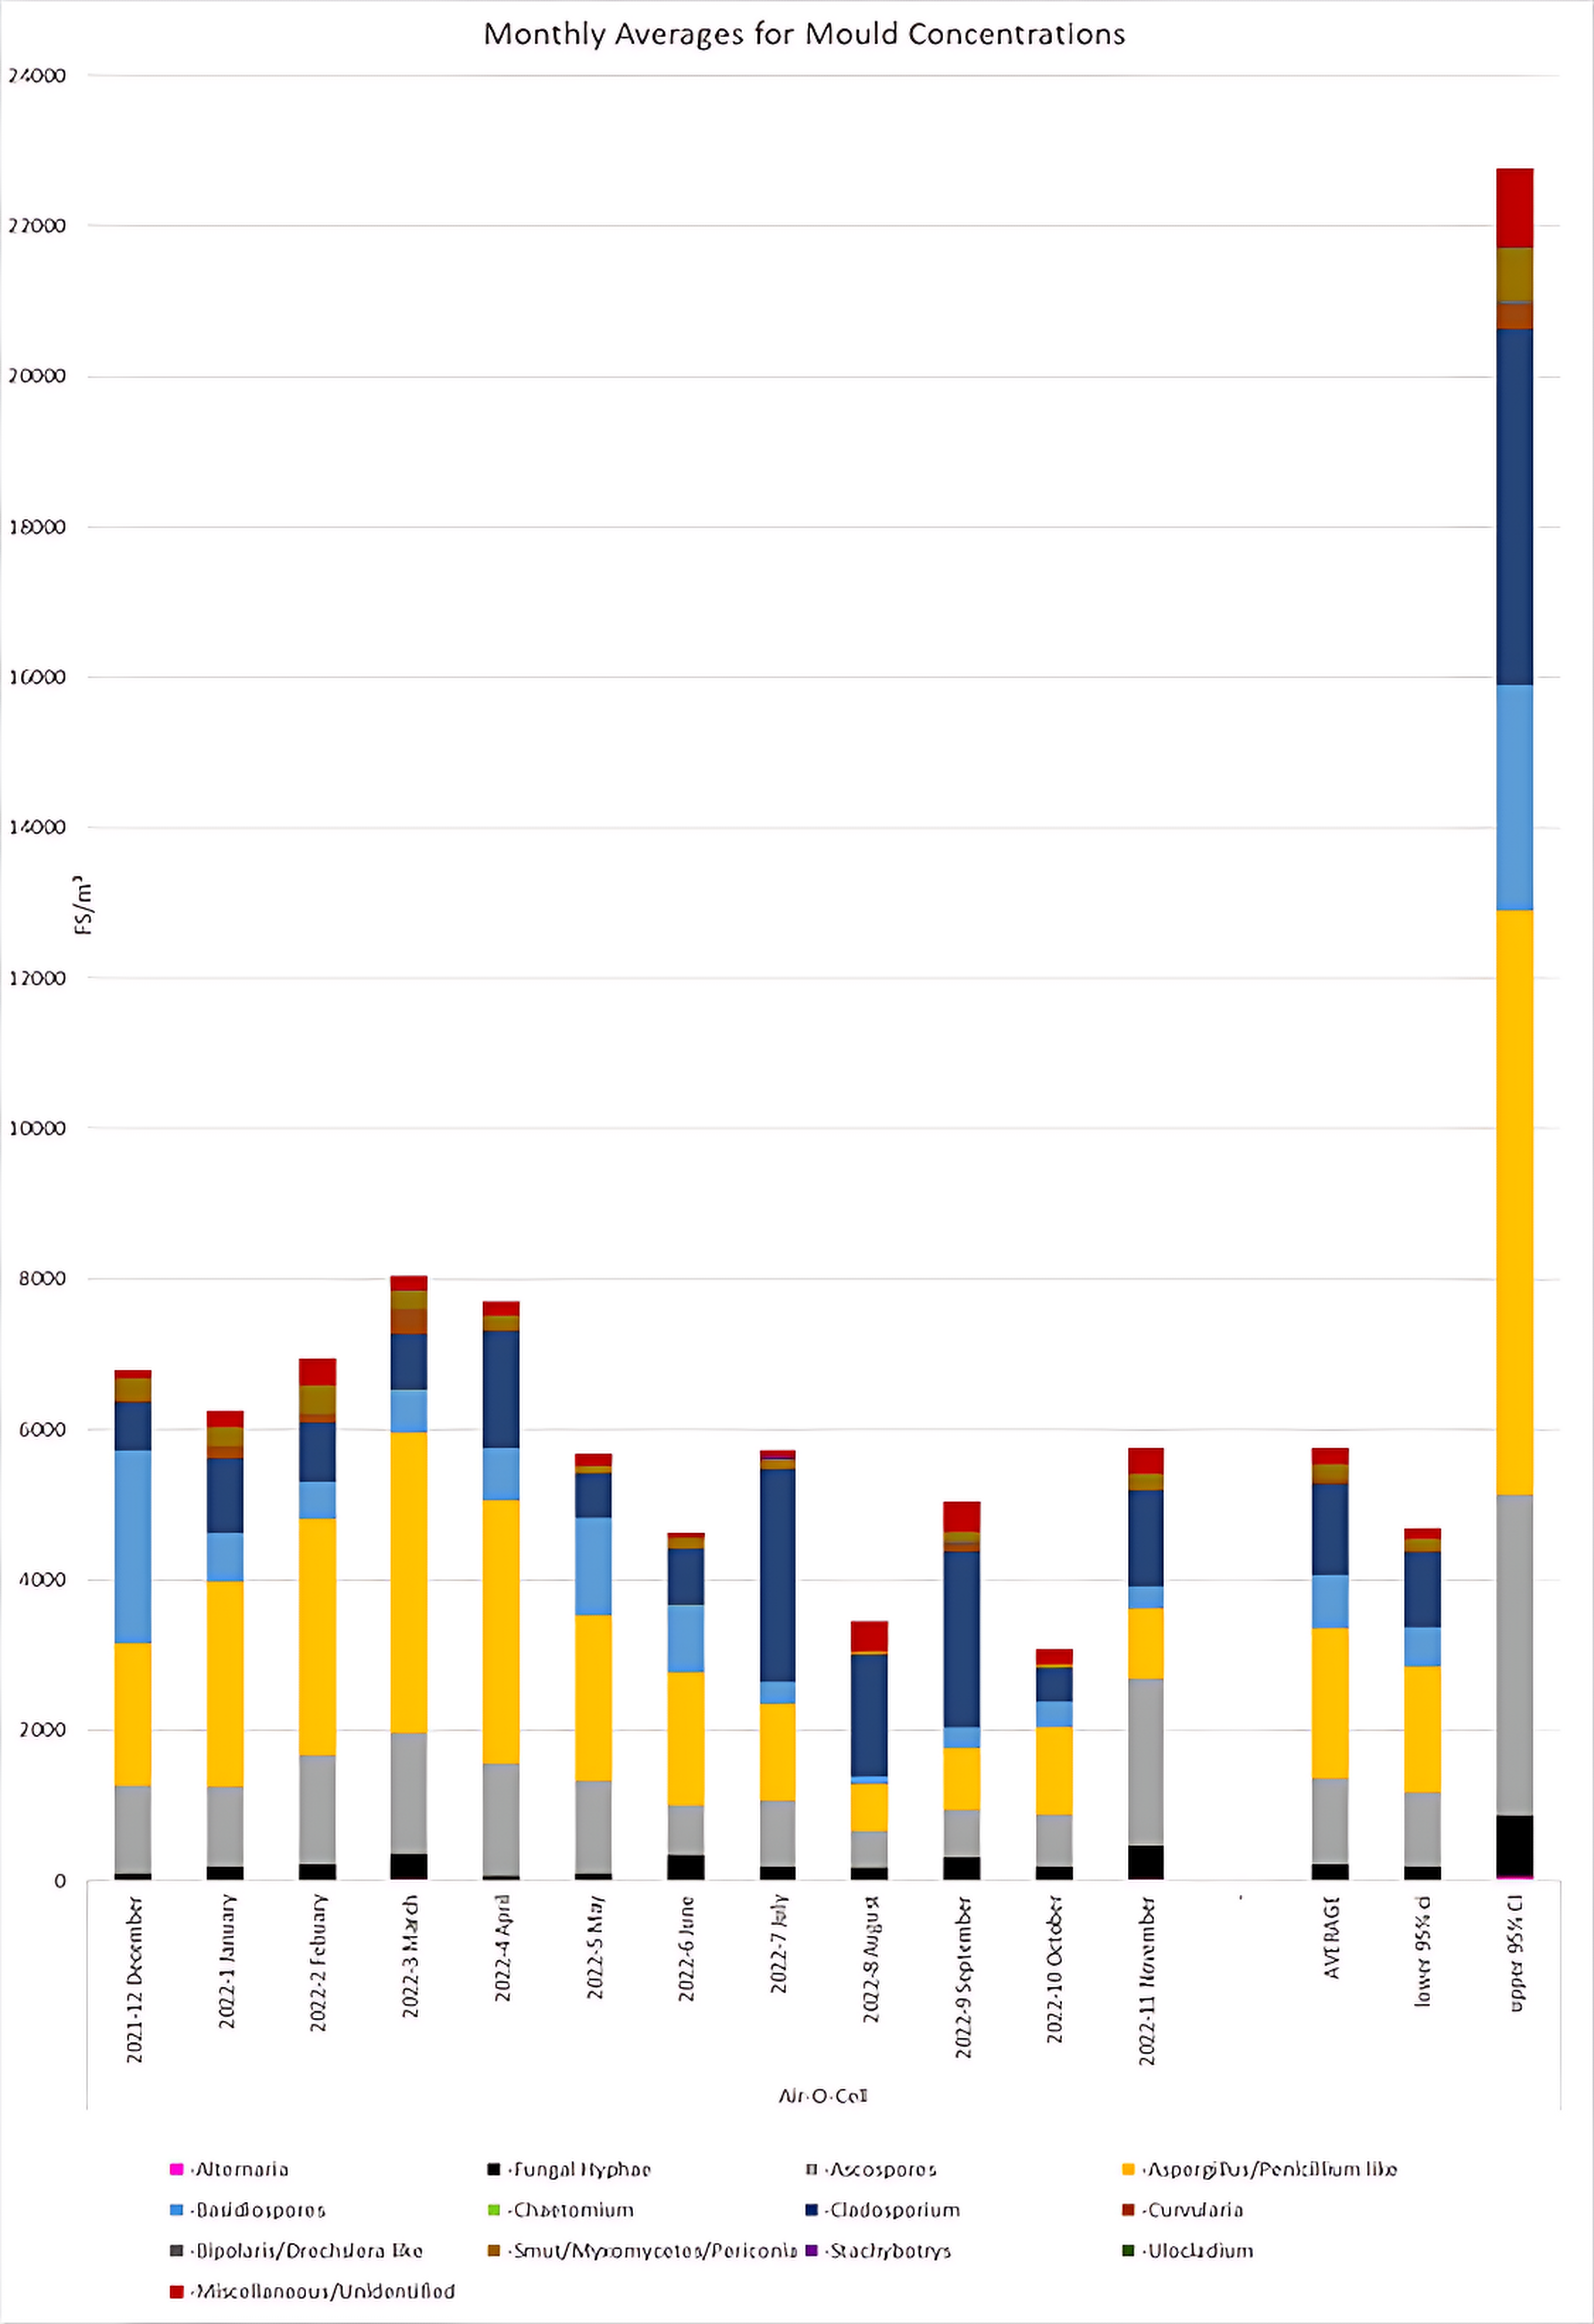
Figure 1 Monthly Average for Mould Concentrations.
Average mould composition calculated for each month according to the categories listed in ASTM D7391. The yearly average and 95% confidence intervals for the yearly average are also shown. N = 38.
Figure 2 shows the data of mould composition in comparison to various environmental conditions including humidity, temperature, rainfall, windspeed and particulate matter in Queensland at the indicated times.
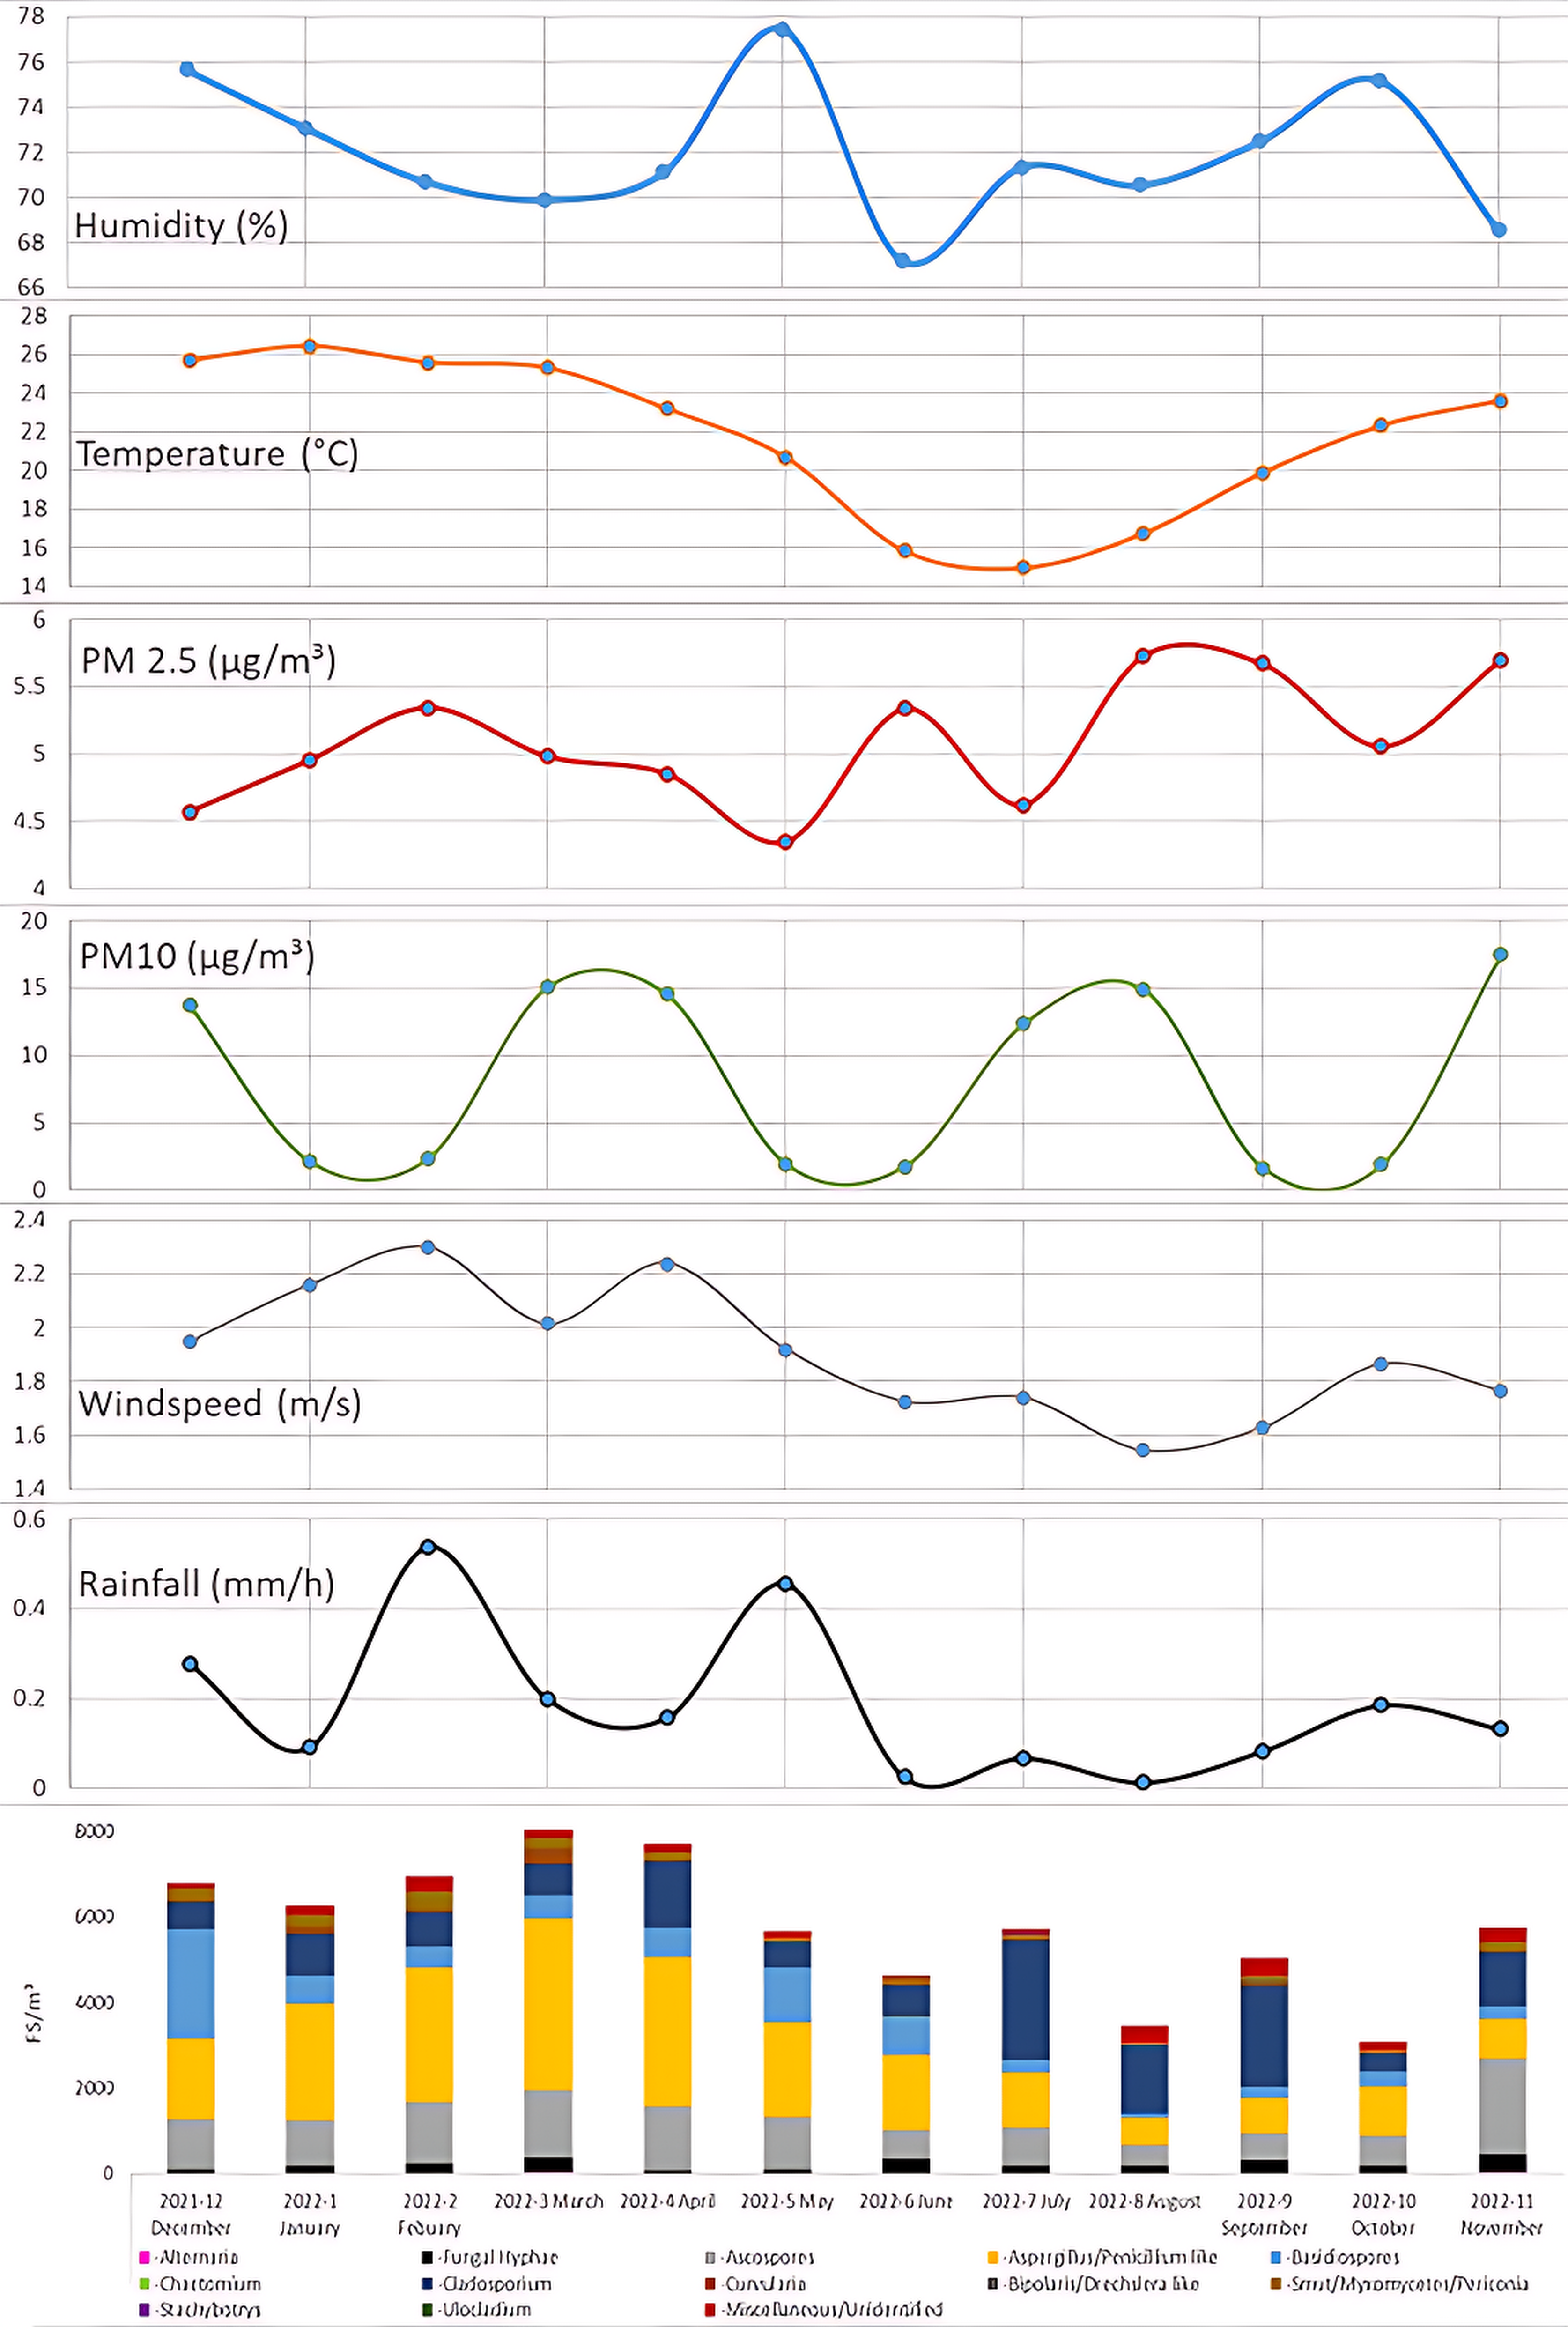
Figure 2 Environmental conditions in relation to mould concentrations.
Environmental parameters recorded in QLD in comparison to the average mould concentrations per month. Environmental data were collected from all sites available in Queensland by the Queensland government. Monthly averages of the environmental data were calculated.
Figure 3a, 3b and 3c shows higher levels of Ascospores, Aspergillus/Penicillium like spores and Basidiospores respectively in the months of December 2021 to May 2022 in comparison to other months. In contrast, Figure 3d shows higher levels of Cladosporium in the months of April, July, August and September 2022 in comparison to other months.

Figure 3a Ascospores Monthly Averages.
Box and whisker plot for ascospores FS/m³ during the December 2021 to November 2022 period. Outliers were present in the 2022-11 Nov sample of 41,164 and 24,192 which are not shown on the graph to maintain a functional scale. N = 38.
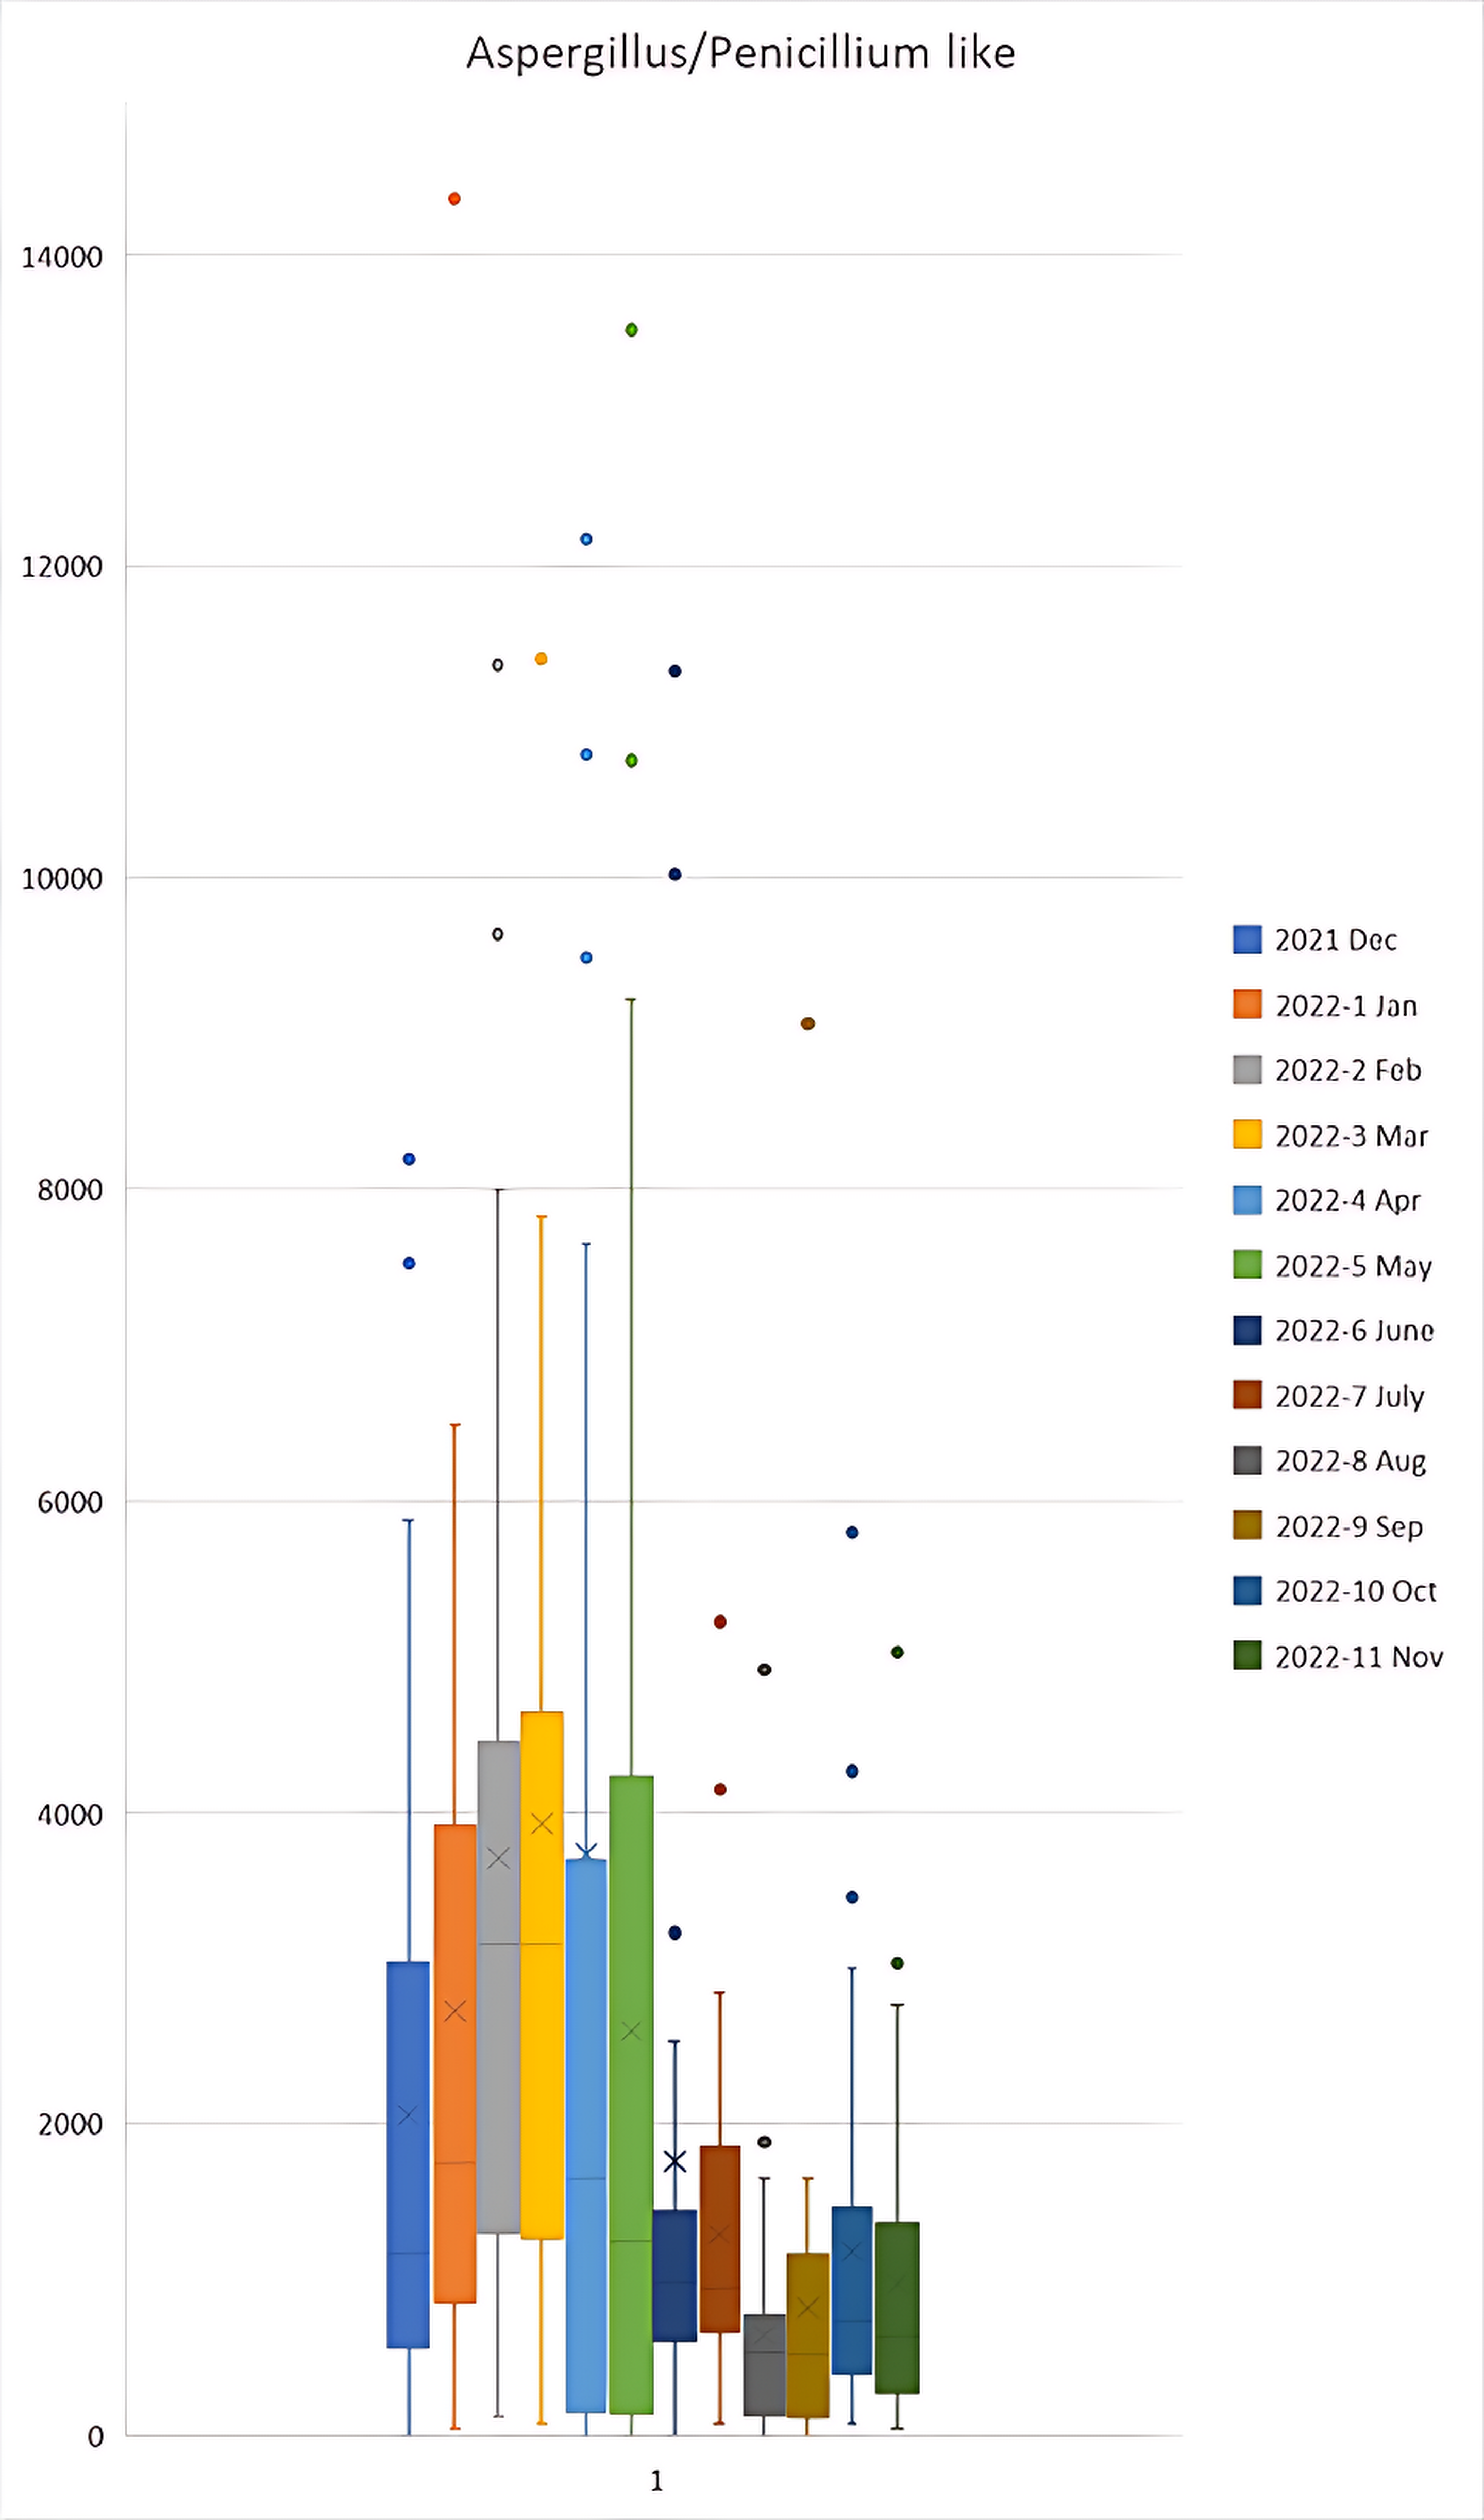
Figure 3b Aspergillus/Penicillium like spores Monthly Averages.
Box and whisker plot for ascospores FS/m³ during the December 2021 to November 2022 period. Outliers were present in the 2022-2 Feb sample of 17,894; 2022-3 Mar of 34,022; and 2022-4 Apr of 29,568 and 20,044 which are not shown on the graph to maintain a functional scale. N = 38.
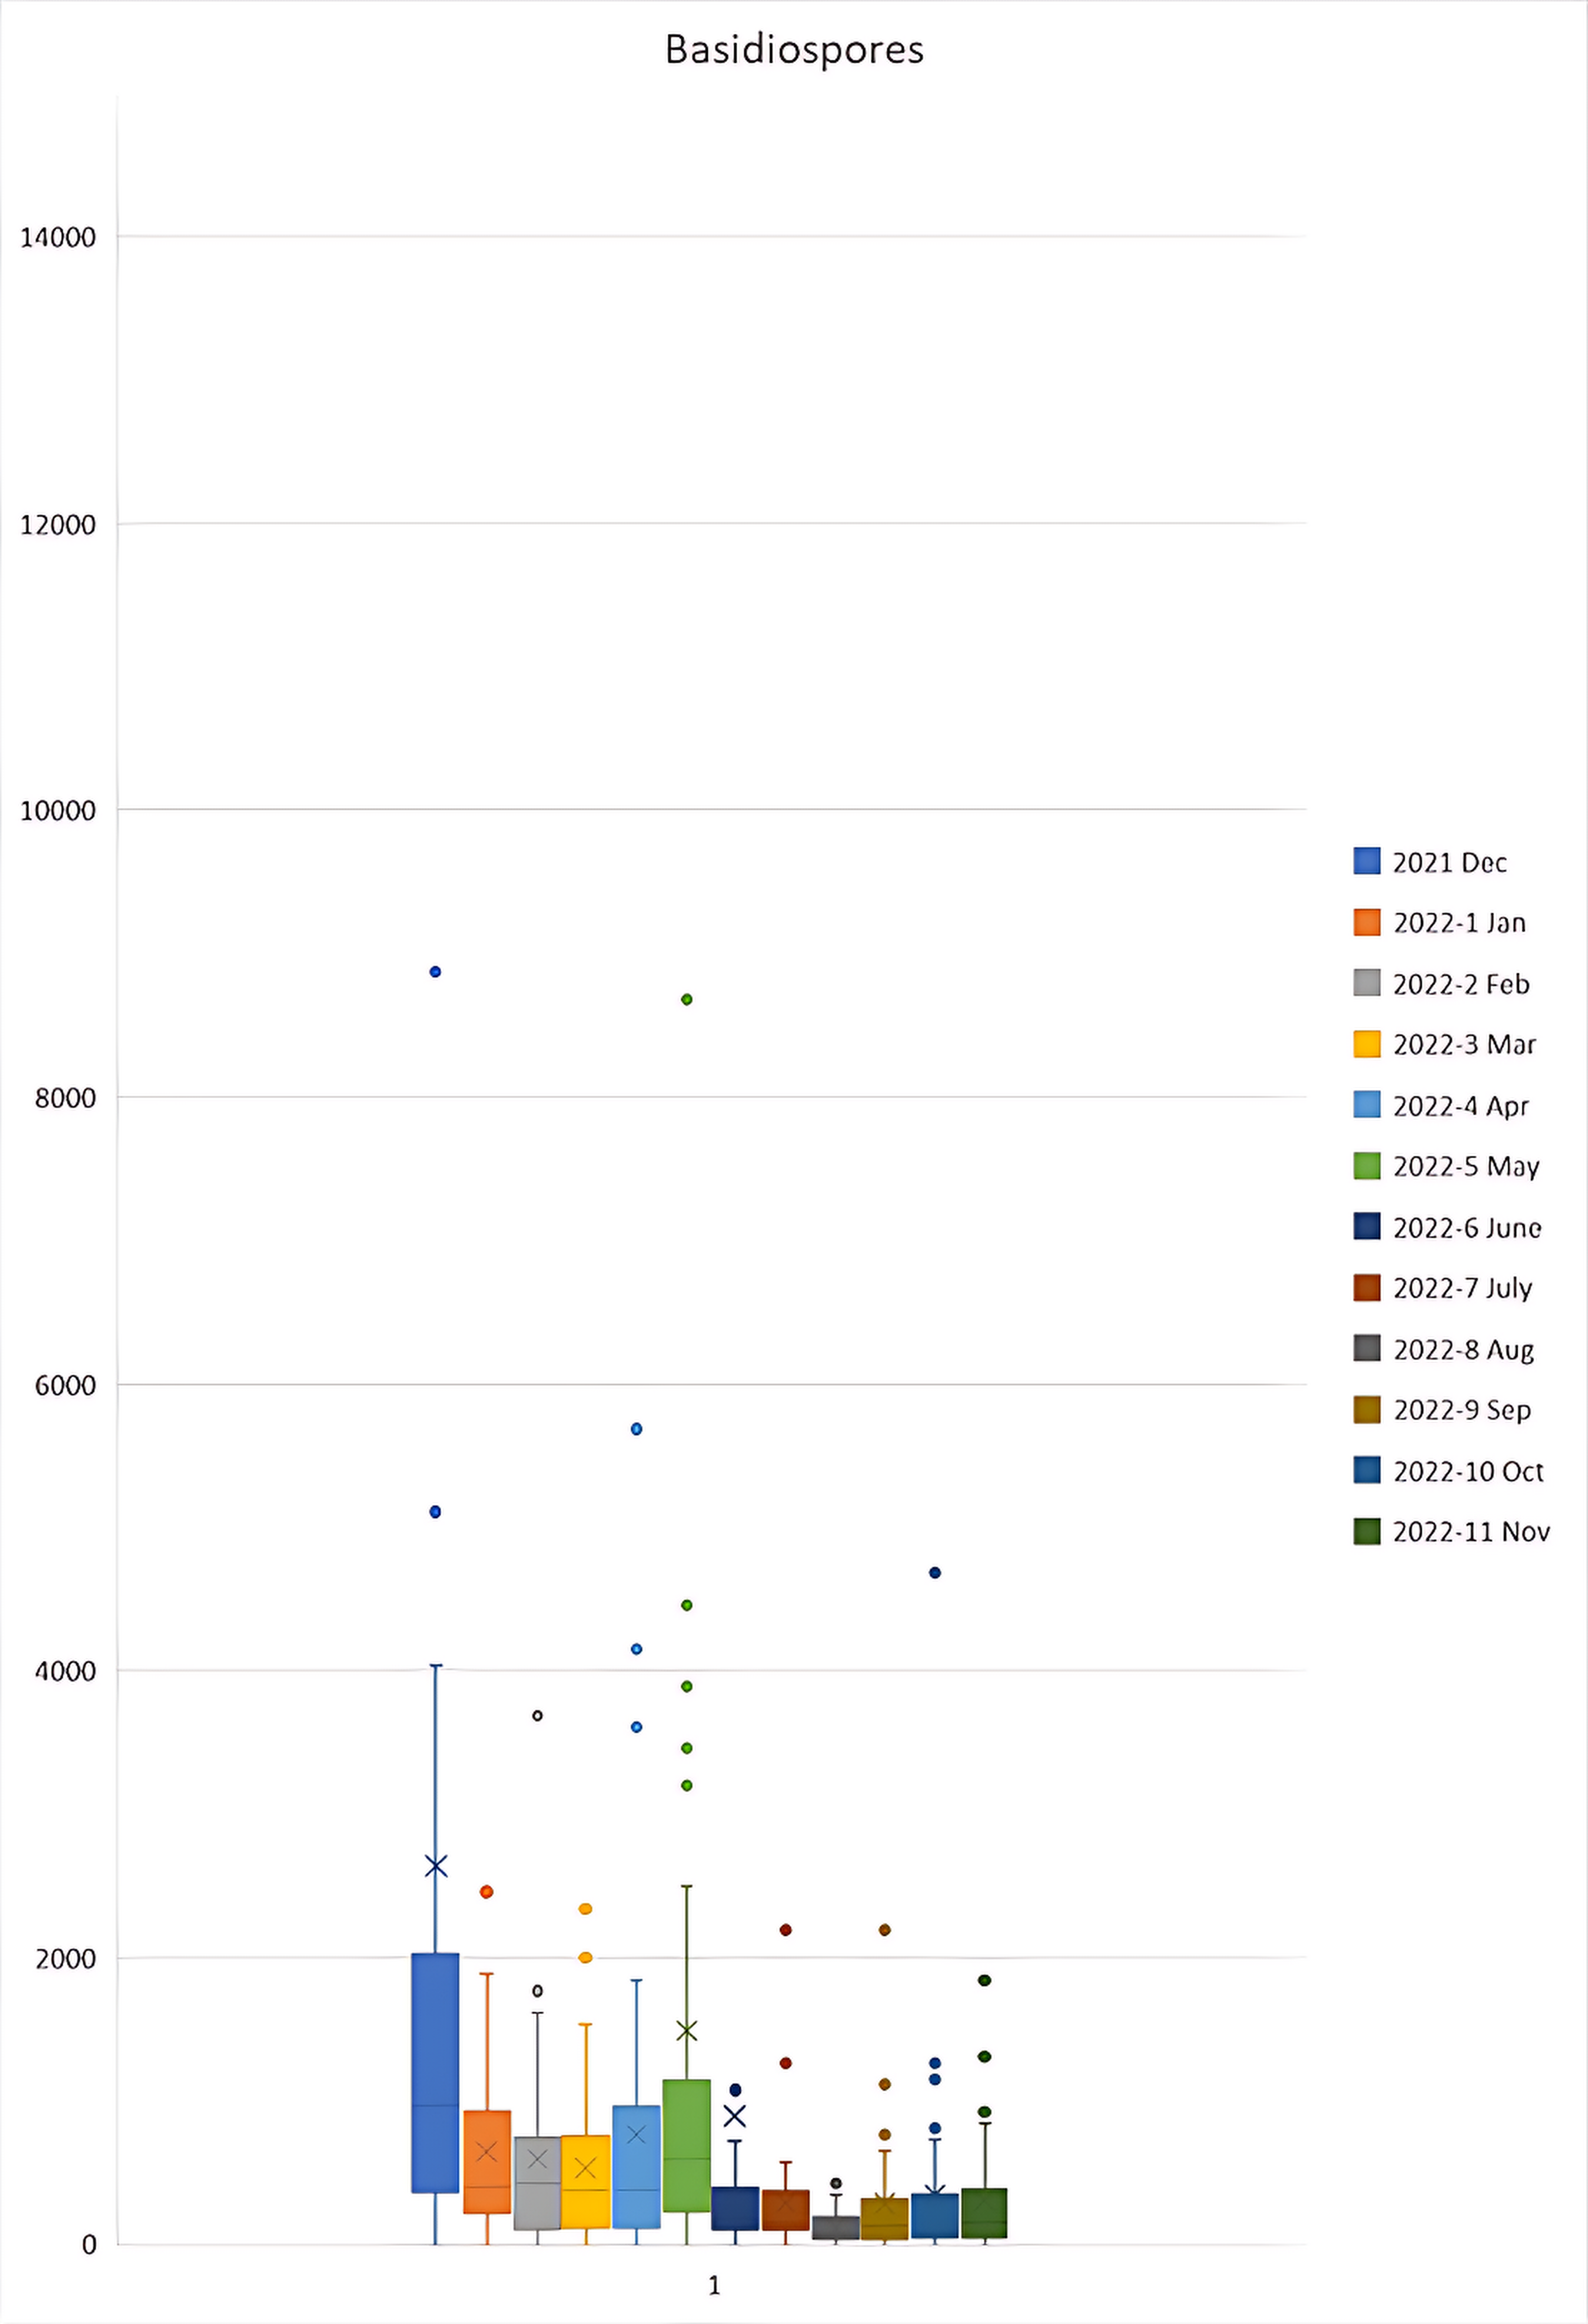
Figure 3c Basidiospores Monthly Averages.
Box and whisker plot for ascospores FS/m³ during the December 2021 to November 2022 period. Outliers were present in the 2021-12 Dec sample of 57,600; 2022-5 May of 15,436; and 2022-6 Jun of 27,264 which are not shown on the graph to maintain a functional scale. N = 38.
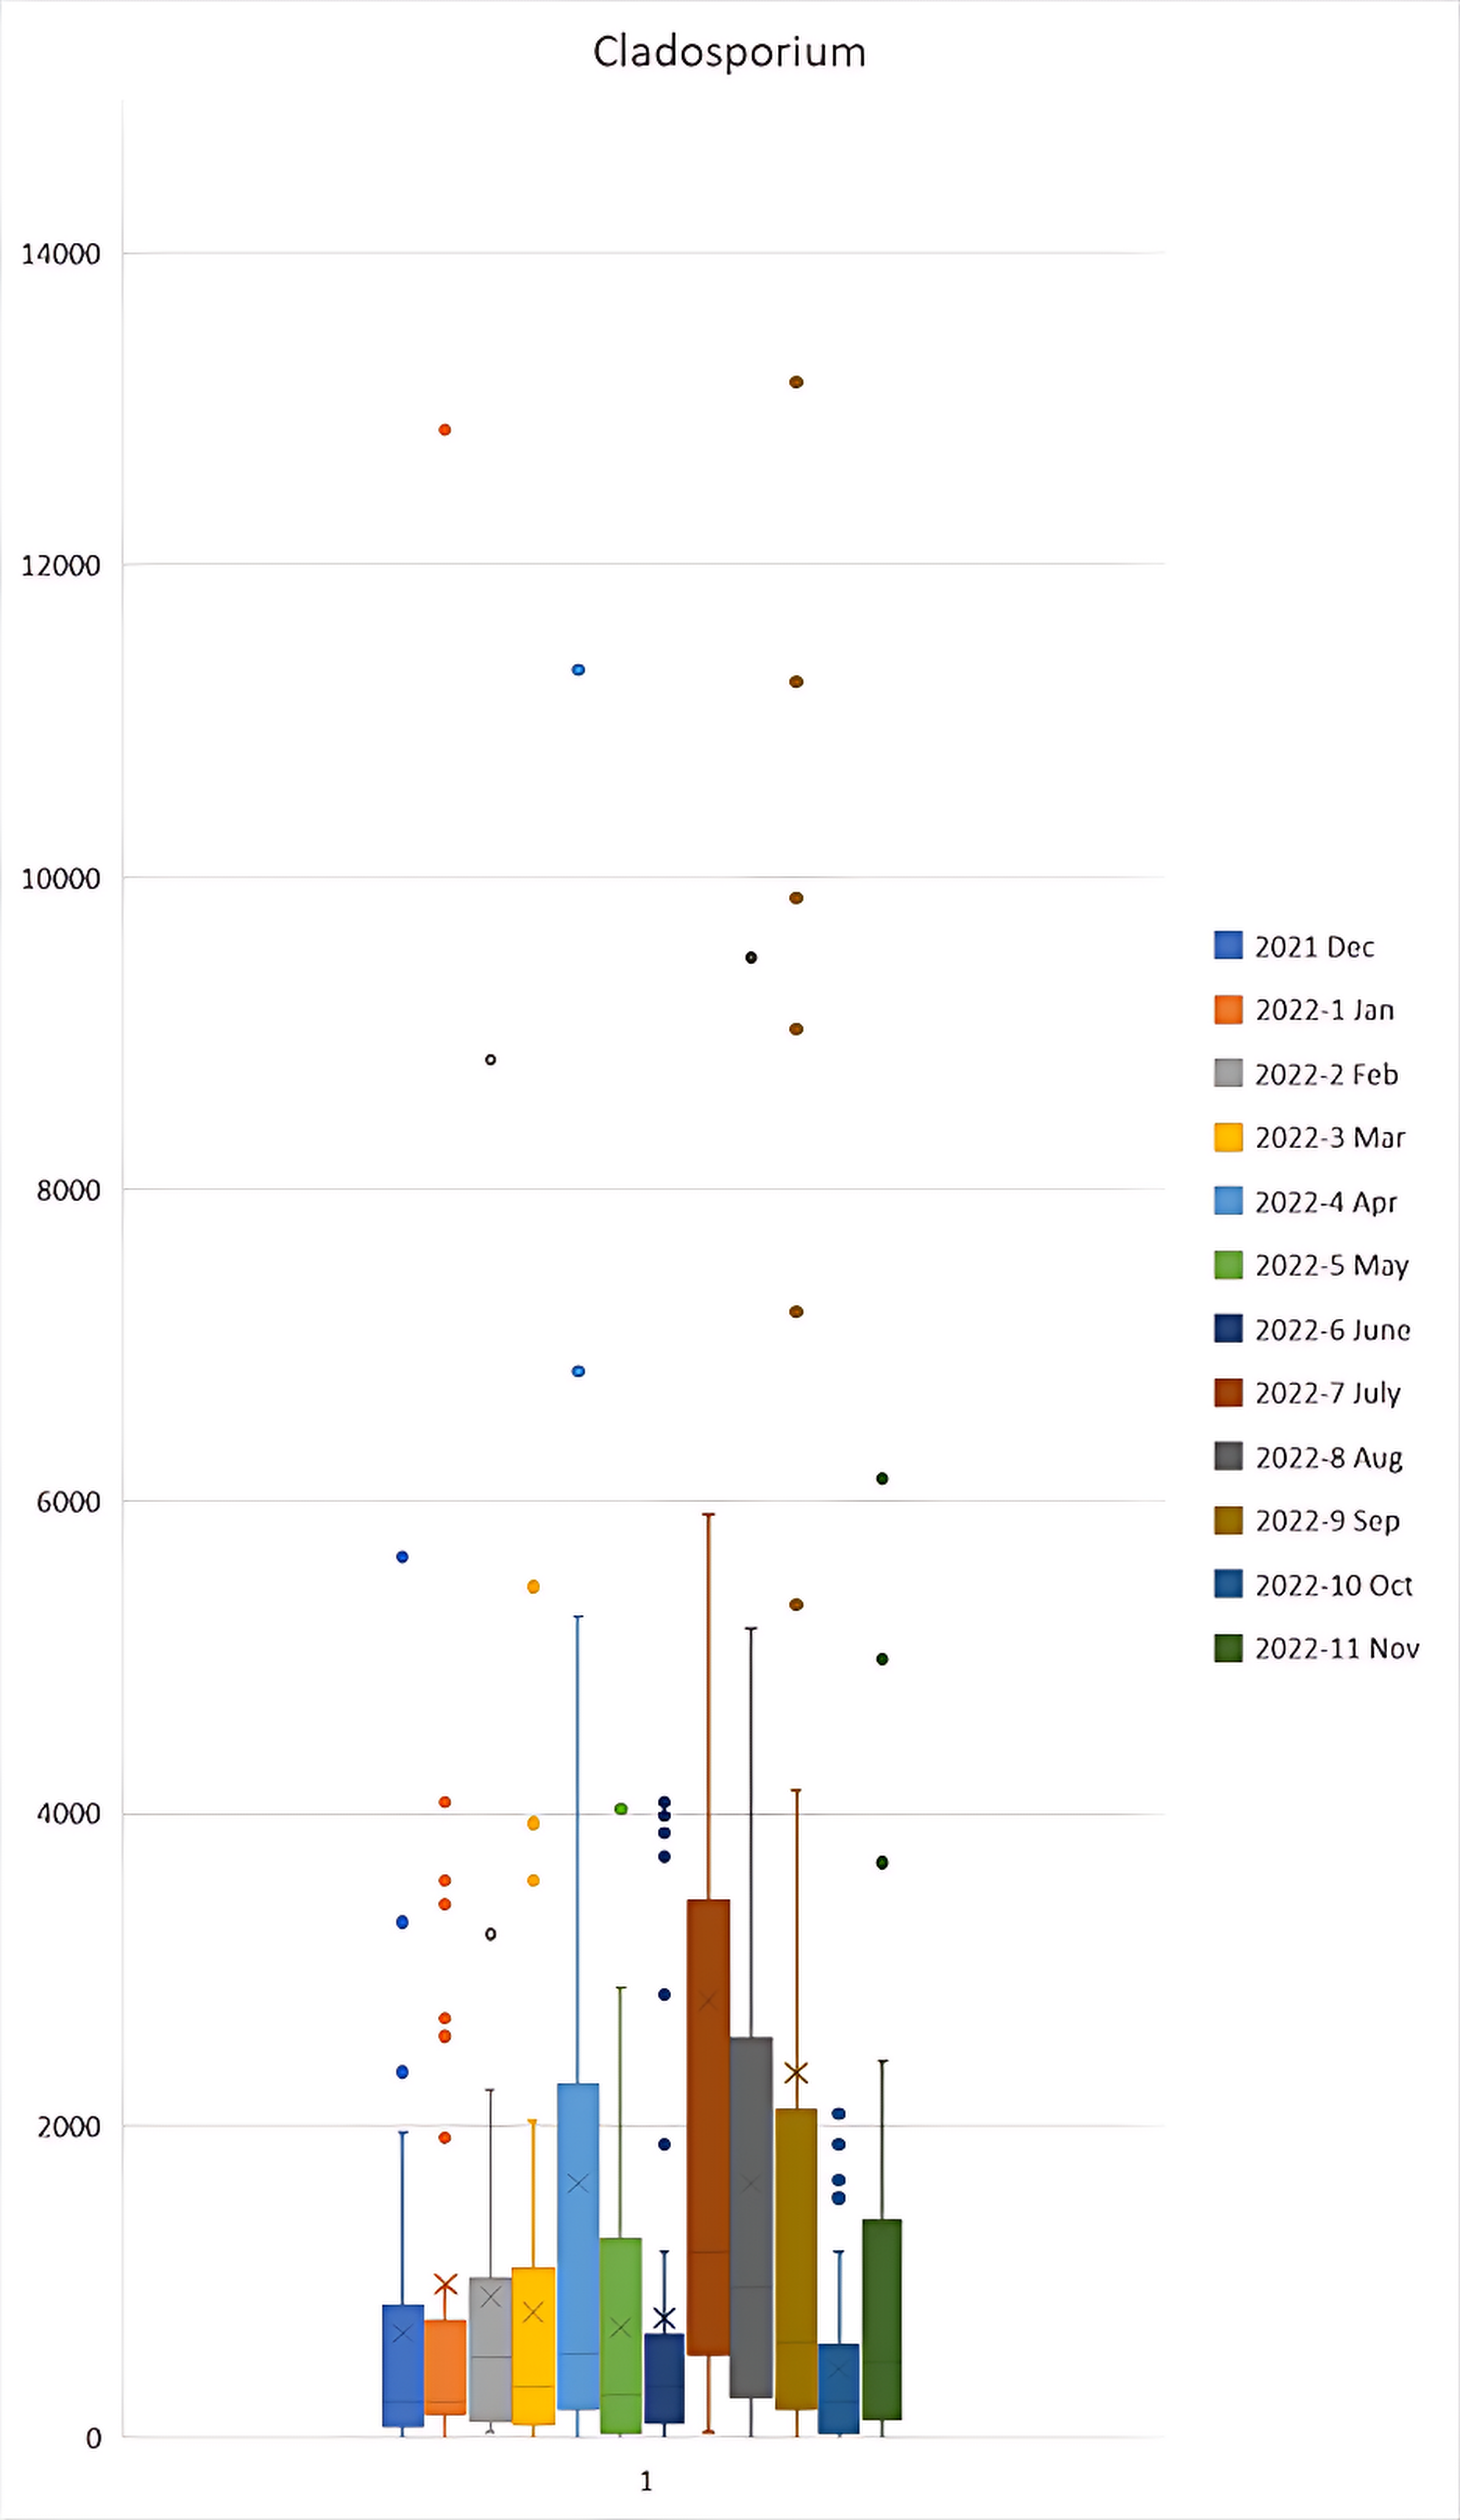
Figure 3d Cladosporium Monthly Averages.
Box and whisker plot for ascospores FS/m³ during the December 2021 to November 2022 period. Outliers were present in the 2022-7 Jul sample of 15,283 and 33,408; and 2022-11 Nov of 15,897 which are not shown on the graph to maintain a functional scale. N = 38.
Mould concentration averages indicated generally higher levels in the months from December 2021 to April 2022, and additionally November 2022. It is difficult to isolate factors contributing to the higher levels observed due to overlapping trends in environmental data. Higher levels of temperature, relative humidity, windspeed and rainfall were all observed in this period. However, very large amounts of rainfall in February may have contributed to the peak in mould levels observed in March.
Generally, higher wind speeds appear to correlate with higher mould levels-28 more specifically Aspergillus/Penicillium like spores (Figure 2) in the months of December 2021 to May 2022. These data are consistent with spore characteristics of Aspergillus/Penicillium like spores -which are known to be easily aerosolized in relation to increasing windspeed.17,29 It should again be highlighted that increases in temperature, relative humidity and rainfall also overlap with this observation. A paper by Kurkela et al (1997) showed increases in levels of airborne Cladosporium in correlation to wind speed, recent rainfall, and increased temperature or decreased relative humidity.30
In contrast to typical observations of mould composition in outdoor samples – Our data showed Aspergillus/Penicillium like spores were the most abundant spore type in summer and autumn, rather than Cladosporium. A recent study indicated higher temperatures correlated with increased levels of Aspergillus.31 Cladosporium is typically considered the most common spore type detected in outdoor samples.21 There are several factors which may have contributed to this finding, the most likely being the typically high temperature and relative humidity consistently experienced in Queensland, Australia during these seasons. Indeed, in the cooler and less humid seasons of Winter and Spring, a shift toward Cladosporium was observed. Other factors which may have contributed to the higher levels of Aspergillus/Penicillium like spores in Summer and Autumn include the floods experienced in Queensland in early 2022, higher average windspeeds and higher average rainfall levels, among other factors as compared to the other seasons.
Cladosporium became the more abundant mould type in the months of July to September. This may be due to the cooler temperatures around this time of the year and Cladosporium being better suited to tolerate and thrive in lower temperatures.32 However, lower levels of humidity, windspeed and rainfall also overlapped with this data. It should also be mentioned that Air-O-Cell sampling cassettes have been reported to underestimate spores of Cladosporium cladosporioides.4
Particulate matter measurements did not appear to coincide with the observed mould levels. This could be due to many factors. Principally, particulate matter counts include all particulate, not just fungal particulate, as such the data can be easily confused by other sources of particulate pollution. These data are consistent with others comparisons of particulate matter and fungal particulate.26 A curious cycle of two months of higher particulate levels followed by two months of lower levels were observed, however a reason for this trend in the environmental data is unknown.
Our data indicates that typical mould concentrations in Queensland average at approximately 6,000 FS/m³ and typically range from approximately 4,000-22,000 during the tested period. The spore concentrations found in these data may make interpretation of indoor samples difficult as outdoor concentrations could easily exceed indoor levels - especially if air filtration devices (AFDs) are employed. Caution is advised for inspectors deeming premises as ‘normal mould ecology’ based on lower levels of mould indoors compared to the outside references. The categories of mould observed indoors should fairly closely resemble the categories of mould observed, and be lower than the comparative outdoor references.3,4,20 However, this is by no means a guarantee that there is no mould issue as others have indicated for example, that spores characterised as Aspergillus/Penicillium like could be Aspergillus or Penicillium (or a host of others) and the indoors may be dominated by Aspergillus while the outdoor reference could be composed primarily of Penicillium.3 We would also comment that in cases where mould levels in outdoor references are high (e.g. reading in excess of 10,000 FS/m³ - which is not an uncommon occurrence) caution should be taken in deeming any indoor samples as ‘normal mould ecology’ despite having lower levels of mould than the outdoor reference because the high levels outside can effectively mask smaller (or not currently sporulating) mould growth issues indoors. Air sampling should not be used as a sole measure for determining mould contamination (or lack thereof) – it should be paired with thorough inspection by IEPs and targeted surface sampling in order to provide reliable data.
Trends in the data indicate the months of December 2021 to April 2022 show the highest mould concentrations whereas August and October 2022 show the lowest mould concentrations. A bias toward Aspergillus/Penicillium like spores was observed in December 2021-April 2022. A bias toward Cladosporium appeared in July 2022 to September 2022. Our data provide useful information to mould inspectors for comparison to indoor samples and providing information as to what mould types are typically observed over the course of a year. Our data highlight the high variability of spore concentrations in outdoor samples in Queensland, Australia. These results further highlight that caution must be taken in interpretation of mould sampling results based on comparisons to outdoor reference samples due to the large amounts of variation and high mould levels observed in Queensland, Australia. Further investigations into links between mould levels and environmental factors should be conducted.
Further investigations for statistically significant associations between environmental conditions and mould composition patterns should be conducted. Further analysis of monthly and annual patterns of mould concentrations should also be conducted to provide a broader data set for composition of mould in outdoor samples for Queensland, Australia.
None.
The authors would like to thank IECL for funding this research.

©2023 Wilkie, et al. This is an open access article distributed under the terms of the, which permits unrestricted use, distribution, and build upon your work non-commercially.