Journal of
eISSN: 2469 - 2786


Research Article Volume 7 Issue 5
1Biological Health Services, Australia
2National Institute of Integrative Medicine, Australia
Correspondence: Dr. Cameron L Jones, Biological Health Services, Level 1, 459 Toorak Rd, Toorak, Victoria, 3142, Australia
Received: October 11, 2019 | Published: October 30, 2019
Citation: Jones CL. Guidelines for the assessment of viable fungal hygiene on indoor surfaces using RODAC petri plates. J Bacteriol Mycol Open Access. 2019;7(5):116-126. DOI: 10.15406/jbmoa.2019.07.00256
It is recognized that damp indoor living and working environments can promote microbial growth from fungi, bacteria and yeasts causing occupant infection, exposure or sensitivity to spores, cellular debris, allergens and a range of inflammatory toxins. Although indoor dampness is recognized as a public health threat causing a variety of adverse effects, defining specific thresholds for identifying potentially unhealthy levels within existing buildings in required. In turn, developing practical guidelines that trigger remediation or other actions is important to minimize or prevent respiratory and other disease. This paper demonstrates how the replicate organism detection and counting (RODAC) plate can be used to bio monitor surfaces in the built environment; especially those that are damp or suspected of being mould contaminated. Several case studies are provided illustrating their use before reviewing some key metrics from the literature. Support for the Australian Mould Guideline is shown by the strong numerical correlation between the assessment of the hygiene ratings using colony forming unit counts on surfaces or from the air. This demonstrates a type of universality between fungal growth and its interpretation in either dimension.
Keywords: water damaged buildings, building and property law, mould assessment, surface hygiene, building microbiology
Studies show that up to 90% of our time is spent indoors within buildings1 and approximately 65% in the home.2,3 An awareness about the microbiology of the built environment and how building characteristics and defects can contribute to adverse health from unwanted leaks, condensation and mould and how this is identified and regulated4‒7 is of increasing importance. This area of public health and its relationship with building disputes was recently examined from the perspective of the relevant Standards, Guidelines and consensus documents that should be used as the basis for quantitative mould inspections and assessments.8 Concentration limits on the total number of indoor airborne fungi and bacteria (bio aerosols) have been recommended by different agencies and organization spanning from 500 colony forming units (CFU/m3) through to 1000 or a multiplier versus the outdoor air that serves as a reference control.9 Such data is commonly used to support or validate the effectiveness of cleaning and remediation efforts or to map and localize known or hidden mould reservoirs in order to effect more efficient ‘source removal’ or prepare alerts to minimize exposure to persons.10‒14 For some stakeholders, there is resistance to the acceptance of numerical risk thresholds on the basis that there is no regulation, but on the other, there is a practical need to measure and verify many aspects of indoor air quality that extends beyond visual and subjective metrics. Despite the need for cautious data interpretation of threshold phenomenon with regard to dose-response causation there is a wealth of data emerging for an association between even self-reported signs of dampness and illness15 and even depression.16 For these reasons, measurements matter!
The purpose of this contribution is to examine the available literature around one method for surface hygiene mould measurement in the built environment. This is illustrated using several case studies. The context for this is the fact that homeowners, occupants and insurers are often concerned about cross contamination from settled spores onto personal property or direct or diffusive moisture causing microbial growth on or in other building elements following unwanted water ingress. Just as there is a pair of methods recommended for air testing onto spore traps or petri plates; there is a pair of methods for surfaces using tape lifts or petri plates. This is formalized as the Australian Mould Guideline (AMG 2010).17 The purpose of such water damage investigations is to measure the extent of any microbial contaminants that may have grown. Although much attention is devoted to air sampling, surface contamination sampling is often under-sampled or sampled in such a manner that conclusions don’t always follow from the data. This paper therefore examines how surfaces should be sampled using RODAC contact petri plates to collect valid and meaningful data. The acronym stands for ‘replicate organism detection and counting’ and is an imprint technique that uses special 55mm diameter petri plates having a raised top surface that is pressed against any flat region of interest for 10sec. using even and constant pressure. The plates are incubated and then the number of colonies are counted and normally reported as CFU/plate or CFU/cm2. They were originally developed for assessing bacterial contamination on surfaces in hospitals and to assess sanitation and cleaning practices.18‒20 Their use continues to this day, where the RODAC plate is used to assess disinfectants against various pathogens.21‒24 As part of water damage building inspections, the method is particularly suitable for pre- and post-remediation verification of porous personal property including clothing, furniture, timber wall framing, truss and bearers, plasterboard, carpet, wall wrap, insulation materials and many other semi-porous and non-porous surfaces that are suspected of having become mould contaminated. The following examples (Figures 1‒7) illustrate how RODAC plates have been used during typical mould inspections and reflects the diversity of applications for which they are suited. Figure 8 then shows two examples of how standard 90mm petri plates and swabs can be used to sample from irregular surfaces and is provided for completeness in the discussion of viable surface sampling.
Surface microbial testing is performed using sterile RODAC agar contact plates with a contact time of 10 seconds per plate. Unknown fungi/general yeast samples can be cultured onto PDA (potato dextrose agar), MEA (malt extract agar), and bacteria onto NA (nutrient agar) or Candida-type yeast to CHROM (chromogenic Candida agar). Any medium can therefore be used to fill 55mm. RODAC plates as required. However, MEA RODAC plates are used in the main for environmental sampling in order to take advantage of the AMG 2010 interpretation scale. Only nutrient media without antibiotics should be used when the AMG 2010 interpretation scale is used. Incubation unless otherwise stated is at 24°C and the number of colony forming units, CFU counted manually after a pre-determined period of time and reported as CFU/plate. Usually this is at 5-days unless otherwise stated and all plates are read or scored at the same time point to ensure consistency between sets of plates if collected or sampled on different days. The counts should all be made from one side of the plate and this should be from whichever side is easier to visualize discrete colonies. Both sides of the plate should be assessed when speciating fungi. Reference controls should be established for specific porous materials. This could take the form of sampling ‘new’ versus ‘suspect contaminated’ materials (e.g. clothing). There may be a need to sample from multiple locations to establish baseline growth results that may be considered ‘normative’. ‘Test materials’ can then be compared to the normative data set. It is also advised to use companion methods like tape lifts or adenosine triphosphate, ATP swabs25 etc. that don’t rely on viability when making determinations about surface hygiene depending on the risk context. Interpretation of CFU/plate for fungal colonies is as per Table 1, ID’s 1 and 4. Sampling from irregular, non-flat materials should use sterile dry swabs streaked directly onto 90mm petri plates containing PDA or MEA media. There is a need to make surface sampling representative of the potentially contaminated area. Therefore, a sufficient number of samples must be collected where the final data set does not show obvious bias or evidence of under-sampling or over-sampling.
|
Quantitative hygiene interpretation systems and thresholds for RODAC Plates |
|||
|
ID |
Interpretation scale or score |
Surface threshold ratings |
Reference |
|
1
|
Low Normal Elevated Contaminated Extreme Contamination |
<12 CFU/plate 12 to 25 CFU/plate >25 to 60 CFU/plate >60 CFU/plate + dominant species >300 CFU/plate + dominant species + confluent growth |
Kemp & Neumeister-Kemp17 |
|
2 |
Class A Class B Class C Class D |
<1 5 25 50 |
EU GMP Annex 1 clean room recommended limits for microbial contamination37,38
|
|
3 |
Operating rooms Other areas |
ISPESL39 |
|
|
4 |
None of very slight (considered excellent) Slight (considered good) Moderate (borderline acceptable) Significant (poor) Heavy (unacceptable) Too numerous to count (unacceptable) |
0–5 CFU/plate 6–15 CFU/plate 16–30 CFU/plate 31–50 CFU/plate >50 CFU/plate TNTC |
Purdue University40 |
|
5 |
Hygiene control end product textiles |
(50 CFU/plate) |
The Netherlands41 |
|
6 |
Hygiene control end product textiles/healthcare linen |
(300 CFU/plate) |
Belgium41 |
|
7 |
Hygiene control end product textiles |
(500 CFU/plate) |
Germany41 |
|
8 |
Acceptable; 0 Acceptable – low contamination rate; 1 Moderate contamination – needs attention; 2 Unacceptable; 3 |
0 CFU/plate 1–5 CFU/plate 6-10 CFU/plate >10 CFU/plate TNTC |
VDX Lab Manual42 |
|
9 |
Insufficient Acceptable Good |
>50 CFU/plate 26–50 CFU/plate 0–25 CFU/plate |
Becton, Dickinson and Company43 |
|
10 |
Excellent sanitation Adequate sanitation Marginal sanitation Unsatisfactory sanitation |
0 CFU 1–10 CFU 11–20 CFU >20 CFU |
University of South Florida44 |
Table 1 Literature review showing different interpretation systems and thresholds for RODAC plates depending on what they are used for
Viable fungal colonies were identified from the following short-list of fungi that form part of the standard operating procedures used to identify environmental fungi of relevance to water damaged buildings. When other fungi having different morphological characteristics are encountered, these are identified as far as is practicable against suitable taxonomic keys: Absidia, Acremonium, Alternaria, Arthrinium, Aureobasidium pullulans, Aspergillus calidoustus, Aspergillus sp. (Genus only), Aspergillus flavus, Aspergillus fumigatus, Aspergillus glaucous complex, Aspergillus nidulans, Aspergillus niger, Aspergillus ochraceous, Aspergillus sclerotium, Aspergillus sydowii, Aspergillus terreus, Aspergillus ustus complex, Aspergillus versicolor, Aureobasidium, Beauveria, Bipolaris, Candida sp., Chaetomium, Chrysosporium, Cladosporium, Coccidioides, Curvularia, Dreschslera australiensis, Eurotium amstelodami, Epicoccum, Emericella anguis, Emericella nidulans, Eurotium, Exserohilum, Fonsecea, Fusarium, Geotrichum candidum, Gliocladium, Malbranchea, Memnoniella echinate, Microsporum sp., Mucor, Neoscytalidium, Nigrospora, Paecilomyces, Penicillium sp. (Genus only), Penicillium brevicompactum, Penicillium chrysogenum, Penicillium corylophilum, Penicillium crustosum, Penicillium marneffei, Penicillium purpogenum, Paecilomyces variotii, Phialophora, Phycomyces, Phoma, Pithomyces, Rhizomucor, Rhizopus, Rhodotorula, Sarcocladium strictum, Scedosporium, Scytalidium, Scopulariopsis, Sporothrix sp., Stachybotrys, Syncephalastrum, Trichoderma, Trichophyton sp., Ulocladium, Unidentified Yeast, Unidentified Fungus, Bacteria.
The following examples illustrate in brief some of the diverse applications where surface sampling has been used as part of mould and water damage inspections. The pairs of photos show the region of interest within the building and the viable growth (or not) that developed at culture. I will provide some background context to this information so the reader can appreciate the nature of the foreseeable problems. Figure 1 (A & B) is from a new home construction where the owner was concerned about the rainwater affecting flooring and timber framing due to the fact the roof did not go on in a timely manner during construction. The builder was of the view that the affected materials would naturally dry out and would soon be sheeted over with plasterboard wall linings. The owners were therefore concerned about mould being effectively sealed into their wall cavities and flooring. The destructive impact of fungal lignin and cellulose degrading enzymes causing timber damage is well known.26,27 Figure 2 (A & B) is from a home where the building warranty was about to expire. The owners had noted that one of their basement rooms was showing severe signs of efflorescence. There was also a strong odour and water could be seen from time to time, leaking through the wall from above. All items of personal property stored in this room showed visible signs of mould. The abutting room was used as an office and the owners were concerned about transfer of mould into that room and sick building syndrome as well as the fact the room showing efflorescence was obviously leaking and a defect. These salt deposits are commonly referred to as efflorescence and are often considered not to be ‘alive’ and just a ‘chemical reaction’. But an important paper28 by Masaphy et al.28 confirmed that efflorescence deposits are extensively contaminated with fungi. Growth in controlled experiments further showed that acids released by the growing fungus were responsible for the biodeterioration effects.
Figure 3 (A & B) is from an apartment which had been freshly painted and the occupant had only moved in 3-weeks prior. In that time, severe mould grew through the bedroom wall and she said her bed felt damp. On inspection, visible mould was found at the rear of the bed abutting the mattress and base as well as on items of furniture. The landlord maintained that the tenant caused the mould, despite clear evidence of rising damp and condensation issues at the apartment complex. Of significance is the common use of concrete render especially common in renovated ageing apartment complexes. Microbial induced concrete corrosion is a well-known example of how biogenic acids damage cement-based construction materials.29 Figure 4 (A & B) is from a house where there were no obvious signs of water ingress or history of any leaks. The occupants were however experiencing a range of adverse health complaints consistent with mould exposure. The home had many down light fittings and sampling in the roof revealed extensive weathering to the truss and signs of dirt and debris and plant litter and vermin waste. Human exposure to mould likely occurs by convective air currents in the roof void leading to migration into the habitable parts of the home around the perimeters of ceiling cut-outs for the down lights. Roof void condensation is a major problem especially in new homes constructed with tight ventilation. If no overt leak events or building defects are found to be contributing factors, then the likely cause in these situations is roof void condensation.4,5
Figure 5 (A & B) shows an example of contents that have been moved from room to room when the Insurance-appointed contractors have first attended following a burst pile and extensive indoor flooding. Many months later as the insurance claim started, then stopped for various reasons, the owners became concerned that their daughter who had an immunosuppressive condition was reacting to her toys. From time to time the parents removed toys from the flooded home and took them to their temporary accommodation. Sampling was conducted to confirm or refute if the contents were in fact contaminated which was vigorously denied by the first responders sent in by the Insurer. Environmental exposure to fungi is known to compromise the respiratory tract even during health and create a cycle of inflammation that can create dysbiosis that is perfect for aspergillosis.30
Figure 6 (A & B) shows an example of how viable mould can grow even within brickwork and behind plaster and within a wall. Following a fire, this home became extensively water damaged. The indoor air quality showed high levels of airborne mould. However, one of the key questions was about whether or not the bricks and mortar were contaminated with mould? If mould had gotten into the brick walls across the mortar joins or into the bricks themselves, then remediation would become extraordinarily difficult, if not impossible. There was a contention that there was only superficial mould damage and that remediation to the ceiling, wall and floor linings would be an achievable outcome. The walls were in some areas covered with wallpaper over aged plaster covering double brick walls. Some stakeholders considered that the mould was only affecting the internal wall linings. To determine if this was in fact the case, the internal plaster, mortar joins, bricks, internal brick surface (when broken open) and the void left by the excised bricks were all tested spanning a large and representative sample across the walls of the home. Remarkably, many examples of active and profuse mycelium were discovered growing deep inside the wall around, into and across the bricks and this was confirmed by culture. This is a fascinating example of fungal biodeterioration and is a practical example of what has only recently been discussed in the literature.31 For example, Yakovela et al.32 showed that two fungi, Aspergillus fumigatus and Penicillium brevicompactum were capable of attacking and colonizing concrete.32 Concrete is a common component of mortar and used to hold the bricks together. After 28-days there was a loss of calcium content of between 32-41% depending on the extent to which the concrete was wetted. This caused in 1-month a 1% loss in concrete stability. Figure 7 (A & B) shows how the internal cross section of a non-water damaged brick does not show abnormal levels of viable mould by way of comparison with many of the excised bricks that showed active moisture discoloration that was shown to penetrate inside. Figure 8 (A & B) shows two further examples of active fungal colonization of the internal wall when it was dissected from inside-out. Very evident mycelium was found in many areas of wall and this mould was confirmed to be viable using a combination of RODAC and standard petri plates at culture.
Surface hygiene assessment
Table 1 shows typical item literature references and standard operating procedures that specifically use RODAC plates for hygiene monitoring. Because RODAC plates are often used for bacteria as well as fungi, there is often no clear specification for one microbial class type over another. The minimum detectable limit is 1 CFU per plate and this refers to discrete colonies that can be seen with the eye. In Australia, the AMG 2010 is regularly cited for guidance by many authors33‒35 and has even be used as the guide for contamination monitoring during human space missions.36 A range of other RODAC scoring systems are also given in Table 1.37‒44 But where do the surface threshold ratings as used in the AMG 2010 come from? To approach this question, the Omeliansky method for air sampling needs to be reviewed following these references45‒47 where:
N=5a x 104 (bt)-1 (Eq1)
where:
N=CFU per m3,
a=CFU counted per plate,
b=petri plate surface area and
t=exposure time in minutes.
For 90mm plates,
b = 3.14 *4.5cm2 and as per the settle plate convention,
t=45.
Although this is for air samples, it provides the transform needed to convert from CFU/plate to CFU/m3. When this is done, the approximate threshold rating bands as used for surfaces in the AMG 2010 emerge. As well, the astute reader should recognize the defacto, approximate risk level of 1000 CFU/cm3 that is shown at a plate count near 60 and 57 CFU in Tables 2 & 3 respectively. Notably we see that CFU thresholds for surfaces defined in the AMG 2010 appear to approximate the numbers of colonies that settle out from the air. Importantly, this appears to be a robust linear relationship between the growth of fungi on settle plates and the RODAC plate surface counts which is similar to the scaling observations made by others.46,48 Some other interesting numerical patterns are also shown in the next section. This information is then used to establish a revision and new Guideline for establishing alert and action levels for fungi measured on surfaces.
Statistical equivalence between active sampling and passive sampling |
|||
Hygiene rating scale |
Plate Count, CFU |
AMG 2010 method for air samples |
Omeliansky method for air samples |
Low – Lower Bound |
0 |
0 |
0 |
Table 2 Statistical equivalence between active sampling and passive sampling for the assessment of room hygiene by air sampling for fungi. Active airborne fungal monitoring in the AMG 2010.49 uses: plate count CFU* 35.3146667210648/2; while the Omeliansky method uses: Eq1
A Continuum for colony forming unit counts
There are additional interesting patterns seen in the AMG 2010 and these are shown in Table 2.49
There are some very interesting and important scaling relationships seen in the AMG 2010, which exemplify a type of biological continuum for fungi. For example:
1,1,2,3,5 ≈ 1 – 12 (Low)
5,8,13 ≈ 13 – 26 (Normal)
21, 34 ≈ 27 – 55 (Elevated)
55,89 ≈ 56 – 144 (High)
144, 233 ≈ 145 – 377 (Extremely High)
1 – 12 (Low)
13 – 28 (Normal)
29 – 57 (Elevated)
58 – 150 (High)
151 – 300+ (Extremely High)
Revised guideline for the assessment of viable fungal hygiene on RODAC plates |
|||
Hygiene Rating Scale |
Plate Count, CFU/plate (RODAC or swab) |
Revised AMG 2010 Method, CFU/m3 |
Omeliansky Method, CFU/m3 |
Low – Lower Bound |
1 |
17.66 |
17.47 |
Table 3 Revised Guideline for the Assessment of viable fungal hygiene on RODAC plates, on air samples or from dry swabs where the rating scale approximates the 500 and 1000 CFU as closely as possible to establish and trigger a relevant alert or action. RODAC plates are preferred over swabs due to the fact that calculating the surface area tested with RODAC plates is easier and more precise than the swab method
The apparent scale-invariance for the thresholds seen between the different systems (air or surface contamination) is an interesting class of universality. This is practically useful, since knowing the contamination threshold for one phase e.g. surface contamination allows an inference to be made about the potential airspace cross-contamination when the surface becomes disturbed. Indeed, this line of thinking is gaining traction in the literature where the impact of micron and sub-micron-sized dusts are considered potentially more of a health risk than the mould spores alone. As such, knowing this information can inform towards the use of correct PPE to manage exposure for emergency or other personnel tasked with remediation or cleanup. RODAC plates also makes the invisible visible and supports other research that similarly concludes that a lack of visible mould does not necessarily mean low air or surface mould concentrations and therefore, one should not rely only on visual inspection.53 The assessment of residential dampness and mould using quantitative viable culture in the home is ultimately supportive of other observational metrics used to develop health protective guidelines or trigger remedial action.54,55 This is especially relevant considering that typical water-damage fungi like Penicillium and Aspergillus show viability for up to 22 years.56 In this latest paper, Górny56 advocates for an ‘environmental philosophy’ where in those situations where ‘a solid link between the concentration of investigated parameters and resulting adverse health effects cannot be effectively established, then—based on the multiple biological agent concentration measurements - the reference values should enable an evaluation of the quality of the environment, as well as determination of ‘what is typical and/or acceptable’ and ‘what is atypical and/or unacceptable’ for a specific type of environment (or for its certain part)’. This paper therefore is a reflection of such thinking. The different case studies showed how the CFU/plate was used to classify surface hygiene. In the timber frame example (Figure 1), the visual results and the extreme level of fungal contamination when brought to the attention of the builder resulted in strip out of all water damaged building elements at the first-floor level. Although an inconvenience for the builder and a cost, the owner was satisfied knowing that source removal had been carried out instead of treating the timbers with biocides or assuming that drying them out would kill the mould. The smaller amount of water damage to timers at ground floor level was addressed through manual remediation including abrasive removal.
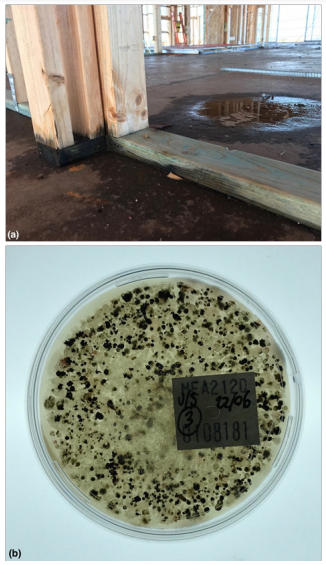
Figure 1 (A) Timber framing that had become wet during construction and (B) corresponding RODAC petri plate (top side view). Species types included: Chaetomium, Stachybotrys, Dreschslera australiensis, Aureobasidium pullulans, Rhodotorula, Unidentified yeast, Unidentified fungus, Bacteria, Candida sp., Nigrospora. The Hygiene rating was assessed overall as: EXTREMELY HIGH (extreme contamination), Hygiene 300+ CFU/Plate + dominant species + confluent growth using the AMG 2010 Guideline and >50 colonies: Heavy (unacceptable), TNTC: Too Numerous to count (unacceptable) using the Purdue University RODAC hygiene rating scale. This is a FAIL result.
The results from Figure 2 were used to demonstrate again to a builder that waterproofing and tanking had failed and that the water ingress was causing mould to grow in this basement room. The tanking was an example of defective work that resulted in a potential health risk which was confirmed by surface hygiene testing of the efflorescence material. Water damage and mould claims under residential or commercial tenancy agreements generally appeal to amenity and health as the basis of contract breach between landlord and occupier. In this situation (Figure 3), the claim by the landlord was that the apartment had just been freshly painted so how could it be mouldy? The claim by the tenant was that the fresh paint concealed a known rising damp problem and that mould was more or less inevitable and could be seen breaking through the fresh paint within the first three weeks of occupancy. The tenant’s case used the surface hygiene results to seek redress as part of a civil claims process. As such the common law rule of Browne v Dunn applies where this is implemented as part of the Evidence Act 2008 (Vic). Courtroom practice means that if party A alleges that X occurred as part of its case against party B and party B as part of its case denies X occurred (and that Y occurred instead), then both parties may need to call witnesses to give evidence. The hygiene data then becomes of central importance as factual evidence. In turn, and under cross-examination, either witness needs to comment on the alternative conflicting propositions and that such efforts must demonstrate fairness to the witness, fairness to the party calling the witness and fairness to the court.57‒59
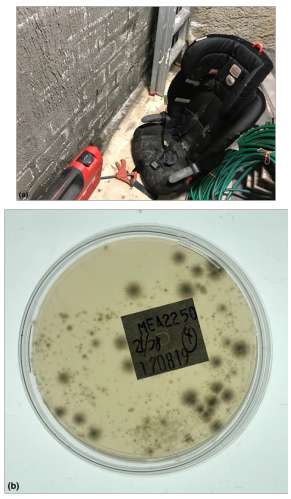
Figure 2 (A) Wall efflorescence that developed in a basement due to defective wall tanking and (B) the corresponding RODAC petri plate (top side view). A single dominant fungus of Aspergillus fumigatus was cultured. The Hygiene rating was assessed overall as: HIGH (contaminated), Hygiene ≥60 CFU/Plate + dominant species using the AMG 2010 Guideline and >50 colonies: Heavy (unacceptable), TNTC: Too numerous to count (unacceptable) using the Purdue University RODAC hygiene rating scale. This is a FAIL result.
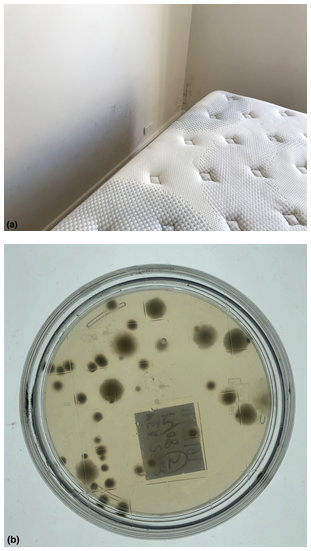
Figure 3 (A) Tenancy related contents mould exposure causing the edge of mattress to become damp due to rising damp across the wall in a ground floor apartment. The mattress did not show any signs of growth and appeared normal in appearance. (B) The corresponding petri plate (bottom side view). Species types included: Aspergillus sydowii, Aspergillus fumigatus, Chaetomium. The Hygiene rating was assessed overall as: ELEVATED Hygiene = 26-59 CFU/Plate + prevailing species using the AMG 2010 Guideline and Significant (poor) using the Purdue University RODAC hygiene rating scale. This is a FAIL result.
Similarly, surface hygiene results are often needed to prove to an owner/occupier that their home is potentially toxic. In Figure 4, the owner and his wife had inherited the property by his parents on their wedding. For the last decade his wife had been increasingly ill with a range of unexplained and other respiratory and cognitive complaints. Her medical practitioner had recommended the owners obtain an indoor air quality and mould assessment to determine if the home was a contributing factor. The surface hygiene results provided compelling evidence that resulted in a scope of works for significant strip out of multiple mould-affected regions of the home, including the roof void. Home contents mould contamination is often dismissed as an over-reaction. Often this can be due to a lack of visual evidence or only odour cues. In this circumstance (Figure 5) the surface hygiene results prompted the Insurer to agree to professional contents remediation or replacement with new as required.
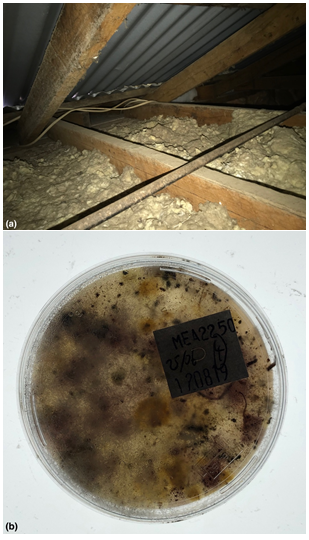
Figure 4 (A) Roof void insulation contamination caused by active water leaks, condensation, ventilation and vapor related issues and (B) the corresponding petri plate (top side view). Species types included: Aspergillus niger, Aspergillus versicolor, Chaetomium, Chrysosporium, Epicoccum, Penicillium chrysogenum, Penicillium purpogenum, Stachybotrys, Syncephalastrum, Unidentified yeast, Unidentified fungus. The Hygiene rating was assessed overall as: EXTREMELY HIGH (extreme contamination) Hygiene ≥300+ CFU/Plate + dominant species + confluent growth using the AMG 2010 Guideline and >50 colonies: Heavy (unacceptable), TNTC: Too numerous to count (unacceptable) using the Purdue University RODAC hygiene rating scale. This is a FAIL result.
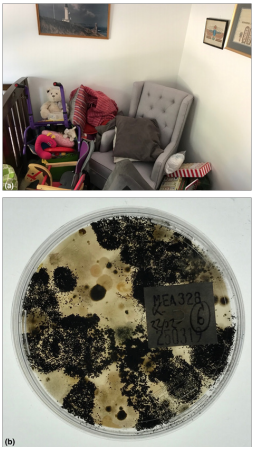
Figure 5 ((A) Often during flood damage claims, personal property is moved away from the source of the water ingress. In this example, the owners were concerned that their personal property was damaged by mould since it now “smelt mouldy”. A series of RODAC plates were used to sample representative items of personal property and (B) one example is shown (top side view). Species types included: Aspergillus niger, Candida sp., Unidentified yeast, Trichoderma, Aspergillus nidulans, Scedosporium, Aspergillus sydowii, Aspergillus flavus, Penicillium brevicompactum, Chaetomium. The Hygiene rating was assessed overall as: EXTREMELY HIGH (extreme contamination) Hygiene ≥300+ CFU/Plate + dominant species + confluent growth using the AMG 2010 Guideline and >50 colonies: Heavy (unacceptable), TNTC: Too Numerous to count (unacceptable) using the Purdue University RODAC hygiene rating scale. This is a FAIL result.
A common lay assumption is that since bricks and concrete are exposed to the elements that they are inert and don’t readily support microbial growth. The issues of biodeterioration are in some cases more extreme depending on context. The examples given in Figures 6-8 demonstrate that mould can grow around, on and inside water-damaged bricks and behind plaster wall render. These surface hygiene results are important for developing appropriate scope of works with regard to which masonry materials can be remediated and those that are unlikely to result in a normal mould ecology after remediation. For example, if a brick is excised from a mouldy wall and the brick itself is found to be mouldy inside, then how can the wall be remediated? Even on a brick-by-brick basis, there is no known method to implement ‘source removal’ even if localized mould killing could be achieved - the allergen risks would still be present to a greater or lesser extent. Without a foreseeable likelihood of passing post remediation verification, any remediation scope excepting strip out and extensive demolition would be unlikely to return the home to a normal mould ecology. This is the truest practical articulation of ‘source removal’ for this circumstance. The surface hygiene results were used to explore the various probabilities attached to different remediation scenarios from a risk management perspective.
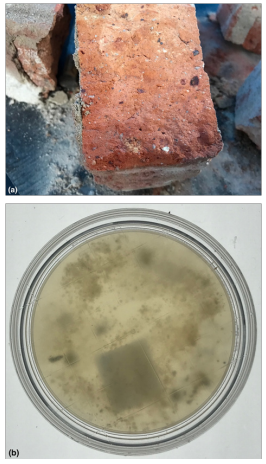
Figure 6 ((A) A brick was excised from the wall and cracked open with a single blunt force to its edge. Note the darkening to the left-hand side of the brick showing the moisture gradient that extends inside. (B) The inside surface was then immediately sampled with a RODAC plate (bottom side). Species types included: Scedosporium, Rhizopus, Aspergillus sydowii, Chaetomium, Bacteria, Candida sp., Unidentified fungus, Unidentified yeast, Penicillium brevicompactum. Number of colonies (either fungi and/or bacteria) showing evidence of confluence. Therefore, accurate numbers cannot be assessed and is very likely to be much higher than can be measured. The Hygiene rating was assessed overall as: HIGH (contaminated) Hygiene =>60 CFU/Plate + dominant species using the AMG 2010 Guideline and >50 colonies: Heavy (unacceptable), TNTC: Too numerous to count (unacceptable) using the Purdue University RODAC hygiene rating scale. This is a FAIL result.
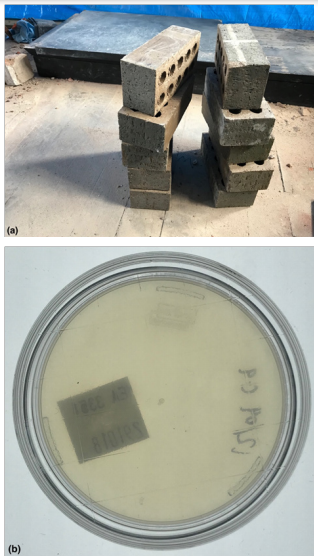
Figure 7 (A) Bricks that were non-water damaged were used as a control. (B) A typical RODAC plate showed no viable fungi inside after culture (bottom side). Species types included: NIL growth. The Hygiene rating was assessed overall as: LOW Hygiene 12using the AMG 2010 Guideline and None or very slight colonies (considered excellent) using the Purdue University RODAC hygiene rating scale. This is a PASS result.
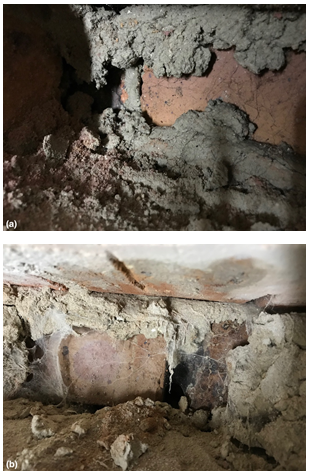
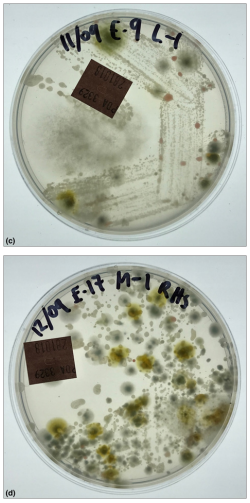
Figure 8 (A & B) Further examples of fungal infestation inside a wall that was covered with plaster and wallpaper. (C-D) When the wall was cut into, some section showed very obvious mycelium and could be sampled instead using swab culture to 90mm petri plates. For (C) Species types included: Trichoderma, Scedosporium, Penicillium brevicompactum, Rhodotorula, Epicoccum, Penicillium corylophilum, Penicillium sp. (Genus only), Unidentified yeast, Bacteria. Hygiene was assessed as: EXTREMELY HIGH (contaminated) Hygiene=151-300+ CFU/Plate + dominant species + confluent growth using the revised AMG 2010 but note that a corresponding risk rating cannot be assessed using swabs since no control is possible. This is a FAIL result. For (D) Species types included: Candida sp., Unidentified yeast, Bacteria, Penicillium brevicompactum, Aspergillus sydowii, Penicillium corylophilum, Penicillium crustosum, Epicoccum, Rhodotorula. Hygiene was assessed as: HIGH (contaminated) Hygiene =58-150 CFU/Plate + dominant species using the revised AMG 2010 but note that a corresponding risk rating cannot be assessed using swabs since no control is possible. This is a FAIL result.
In this article the concept of quantity and magnitude as this relates to the practical measurement of fungi sampled from surfaces and from the air especially following water damage or claims of mould contamination is considered. It has been shown that RODAC plates are like graph paper in a petri plate. They provide valuable microbiological information especially when a claim for clean is only supported by a visual inspection. They are easy to use, transport and score and allow for both sum and taxonomic rankings as well as subculture if required. As well, they make it easy to visually explain the often hidden, microscopic growth on surfaces by showing the culture plate itself. The revised hygiene guideline for indoor mould is therefore important for all building occupants who might have to deal with and explain mould growth using an objective unit of measurement, which turns out to be the discrete distribution patterns of the colonies themselves.
None.
This paper benefitted from extended conversations between the author and Dr. Heike Neumeister. The author thanks the anonymous reviewers for valuable feedback on an early draft of this manuscript.
The author declares that there is no conflict of interest.

©2019 Jones. This is an open access article distributed under the terms of the, which permits unrestricted use, distribution, and build upon your work non-commercially.