Journal of
eISSN: 2473-0831


Research Article Volume 8 Issue 1
1Ameritox, LLC, 486 Gallimore Dairy Road, USA
2Veterans Administration, 1 VA Center, USA
3Premier Biotech, 723 Kasota Ave SE, USA
Correspondence: Gregory McIntire, Ameritox, LLC, 486 Gallimore Dairy Road, Greensboro, NC 27409, Veterans Administration, 1 VA Center, Augusta, ME 04330, Premier Biotech, 723 Kasota Ave SE, Minneapolis, MN 55414, USA
Received: January 24, 2019 | Published: February 25, 2019
Citation: Feng S, Ward L, Parish B, et al. Urine drug testing concentration ranges for select benzodiazepines. J Anal Pharm Res. 2019;8(1):8?13. DOI: 10.15406/japlr.2019.08.00303
Benzodiazepines have been important drugs for the treatment of anxiety and pain since their introduction in the 1950s. Urine drug testing (UDT) is often used to help establish whether the patient is adherent to their prescribed benzodiazepine or is misusing the drug. As such, it is important for physicians to recognize drug levels that are outside expected ranges. However, to date there has been little research into “normal” urine drug ranges for patients prescribed benzodiazepines. This work is designed to present the UDT benzodiazepine results from a large patient population from 6 months of testing, specifically, alprazolam, clonazepam, diazepam, lorazepam, temazepam, and oxazepam. In an effort to make these results useful to the clinician, the raw data are emphasized rather than any mathematical transformations. The ranges from this population are presented as a tool to reduce subjectivity in determining if a patient is likely adherent to their medication or needs additional counselling.
Keywords: benzodiazepine, alprazolam, LC/MSMS, patient results
Benzodiazepines were first synthesized in the 1950s and successfully marketed in the 1960s1,2 leading to a rapid rise in prescriptions of these compounds for the treatment of anxiety, insomnia, and seizures, among other conditions.3 They were seen as safer than, but just as effective as, barbiturates and other older drugs used as sedatives and hypnotics. However, by the 1980s it became clear that they were also saddled with similar liabilities for abuse and dependence as the older medications they were designed to replace.1,4 Despite this risk, as well as the availability of other safer medications with anxiolytic properties, the number of prescriptions written for benzodiazepines has not significantly dropped.1,4
Urine Drug Testing (UDT) is often used to help assess a patient’s adherence to their prescribed medication.5 Benzodiazepines and their metabolites are excreted in the urine as glucuronide conjugates and as such require hydrolysis for analysis.6-8 Benzodiazepine testing can be amenable to rapid analytical techniques.9-11 However, testing is most often accomplished by liquid chromatography- mass spectrometry mass spectrometry (LC-MS/MS)12-14 with limits of quantitation (LOQ) of 20ng/mL or lower.11
When UDT results are returned to the prescribing physician, they can often only confirm that the patient is positive or negative for the drug and/or metabolite(s) tested. However, there is relevance of UDT quantitative values in determining adherence.12-14 Several authors have attempted to draw more information out of UDT than just a positive or negative result, such as clinically relevant ranges. Pesce et al.,15-19 demonstrated the relationship between drugs and metabolites in urine in a number of papers focused on metabolic ratios. The derived ratios were used to differentiate rapid metabolizers from normal and slow metabolizers which can be helpful in determining the optimal drug for a specific patient.15-18 In another paper, he proposed estimates of clinically useful cut-offs for a number of drugs and metabolites.20 Cummings et al.,21 demonstrated normalization and transformation of oral fluid data to illustrate the population nature of these test results. The same modelling process was duplicated for fentanyl and norfentanyl UDT results in another report where the Gaussian nature of the resulting distribution was discussed in the context of determining medication adherence.22 Normalization and transformation have been demonstrated for a number of additional drugs and/or metabolites.23,24
While data modelling has been successful for other drugs and/or metabolite(s), a large number of data points is required (i.e., >4,000). To date, Xanax® or alprazolam, has been the only benzodiazepine to provide enough data points to use traditional modelling.23,24 Therefore, raw UDT concentrations were investigated with the goal to determine if a clinical UDT range of “normal patients” could be determined for benzodiazepines. This range would be analogous to existing blood ranges and assist a physician in quickly estimating whether their patient is consistent with a “normal population” and likely adherent with their prescription. To the best of the author’s knowledge, this is the first time the raw UDT data has been reported for use as a quick reference without the need for any patient demographic input to determine apparent adherence.
The benzodiazepines analysis used in this report is part of a larger method for testing a wide variety of drug classes including opiates, opioids, amphetamines, and others. Details of the full method and validation can be found in an earlier report by Enders et al.25 Alprazolam, α-hydroxyalprazolam, lorazepam, nordiazepam, oxazepam, temazepam, and nordiazepam-D5 standards were purchased from Cerilliant Corporation (Round Rock, TX) as 1mg/mL stock solutions. An enzyme solution was prepared by diluting IMCSzyme® β-glucuronidase solution (IMCS, Irmo, SC) to 10,000units/mL in 0.02M sodium phosphate buffer, pH 7.5. Normal, drug-free urine was purchased from UTAK (Valencia, CA). Samples (30µL) were diluted 6x with 120µL of enzyme solution and 30µL of 1,000ng/mL nordiazepam-D5 internal standard. After dilution, samples were incubated at 60°C for 60 minutes for hydrolysis and then extracted using a solid-phase extraction method. Ultimately, samples were diluted 10x in 300µL of 10% methanol:90% water prior to injection and LC-MS/MS analysis. A morphine-3β-D-glucuronide (Cerilliant, Round Rock, TX) standard was used as a hydrolysis control for the method.
LC-MS/MS method
The LC-MS/MS (liquid chromatography-tandem mass spectrometry) method was originally performed on an Agilent LC-MS/MS 6460 system25 and was later transferred to a Thermo Ultra LC-MS/MS system repeating the same validation experiments and requirements. A summary of the Thermo validation data for the benzodiazepines test is given in Table 1. The current version of this method that runs on the Thermo Ultra LC-MS/MS system uses solvents A (5mM ammonium formate with 0.1 % formic acid [aqueous]) and B (5mM ammonium formate in 75:25 methanol:acetonitrile with 0.1% formic acid). A flow rate of 0.8ml/min was used throughout and yielded a total cycle time of roughly 6.5 minutes. A Phenomenex (Torrance, CA) Kinetex 2.6μm Phenyl-Hexyl 100Å, 50 x 4.6mm (00B-4495-E0) LC column was used in this method similar to the original method.11 The injection volume was set to 15μL and column temperature was set to 30°C. All benzodiazepines produced a quadratic response with 1/x2 weighting, from 20ng/mL to 5,000ng/mL, and a cut-off of 20ng/mL was used, except for lorazepam where the cut-off was 40ng/mL.
|
|
Carryover |
Precision and Accuracy |
|
|
Matrix |
Interference |
|||
|
|
Avg. Conc. (ng/m)L (N=5) |
Avg % target (N=90) |
|
Avg % CV (N=90) |
|
% Matrix Effect |
Interfering Compounds |
||
|
40ng/mL |
150ng/mL |
750ng/mL |
40ng/mL |
150ng/mL |
750ng/mL |
||||
|
7-Aminoclonazepam |
6.88 |
95.3 |
103.7 |
103 |
12.3 |
8.5 |
8.3 |
-3.51 |
None |
|
α-Hydroxyalprazolam |
5.28 |
91.8 |
101 |
103.5 |
10.6 |
8.7 |
6.2 |
-1.62 |
None |
|
Alprazolam |
3.2 |
95.4 |
102.7 |
106.2 |
6.4 |
8.6 |
6.8 |
1.55 |
None |
|
Lorazepam |
0 |
98.2 |
104.6 |
102.9 |
10.2 |
10.2 |
9.7 |
20.1 |
None |
|
Nordiazepam |
1.08 |
97.4 |
103.9 |
101.9 |
8.6 |
6.9 |
5.5 |
-0.55 |
None |
|
Oxazepam |
5.15 |
99.3 |
108 |
106.4 |
10.6 |
6.4 |
5.7 |
9.87 |
None |
|
Temazepam |
2.66 |
93.7 |
106 |
103.8 |
5.2 |
5.3 |
3.8 |
11.2 |
None |
Table 1 Validation summary for benzodiazepines (LOQ/LOD=20ng/mL; ULOL=5,000ng/mL)
Data analysis
In an attempt to identify an adherent population of patients, the test results for the benzodiazepines of interest from this method were curated as follows:
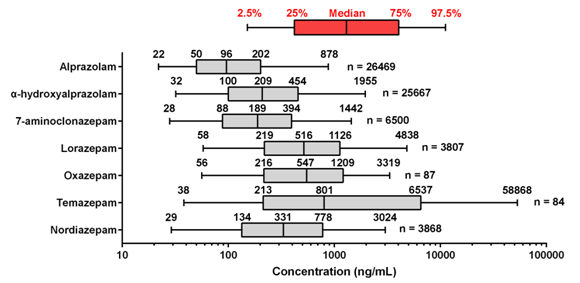
This filtering process took the original 29,203 data points for alprazolam down to 26,469 data points post curation. The data in Figure 1 & Figure 2 were prepared by then taking data within 2.5% and 97.5% of the resulting range of values. This was an attempt to remove “outliers” from the filtered data set and provide a more robust result.

Figure 1 “Box and Whiskers” plot of the Raw UDT data for benzodiazepines. “n” values are for the filtered data sets.

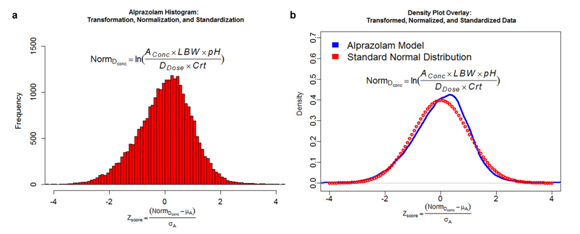
Figure 2 (a) Histogram of the normalized, transformed and standardized raw alprazolam data. (b) Kernel density estimation plot derived from the normalized, transformed and standardized raw alprazolam data overlaid with the least squares minimized best fit Gaussian distribution curve.
Alprazolam was investigated to determine if data modelling could be successful for benzodiazepines as shown in Figure 3. The data analysis and model development for alprazolam were conducted using R Project version 3.3.26 Data smoothing was conducted by kernel density estimation to smooth continuous data (e.g., histograms).27 Model development is detailed in earlier reports22,23 and results in equation 1.

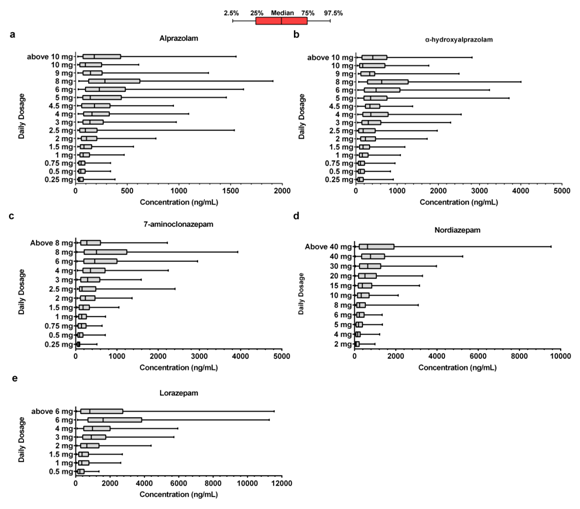
Figure 3 (a) Alprazolam concentration ranges with corresponding dose levels. (b) α-hydroxylprazolam concentration ranges with corresponding dose levels. (c) 7-aminoclonazepam concentration ranges with corresponding dose levels. (d) Lorazepam concentration ranges with corresponding dose levels. (e) Nordiazepam concentration ranges with corresponding dose levels.
[1]
Where ln is the natural log, Aconc is the concentration of the measured analyte in kg/L; LBW is the lean body weight of the subject in kg; pH is the sample fluid pH; DDOSE is the subject prescribed drug dosage in kg; and CREAT is the sample fluid creatinine concentration in kg/L. The calculation of these parameters is given in earlier references.22,23 The value of NORMDconc is then transformed into its corresponding Zscore on the standard normal (e.g., Gaussian) distribution using equation 2:
[2]
where Zscore is the standardized normal value and and are the mean and the standard deviation of the population used to construct the model described in Equation 1. The resulting mean and standard deviation of the standardized normal distribution, Zscore, are “0” and “1” respectively.
Figure 1 illustrates the data post filtering for the benzodiazepines of interest in this work as described above. The graph is displayed on a logarithmic scale so that the plots for all of the benzodiazepines can be displayed in the same graph. However, that is strictly a function of the display and has no bearing on the actual data or how it was calculated. Nothing in this display reflects a “normal” distribution as expected from previous data displays from UDT15-24 and is why box and whiskers plots were chosen to display these data.
Mathematical normalization and transformation of the alprazolam data as per Equations [1] and [2] is shown in Figure 2A. Figure 2B shows the correlating “true” Gaussian Distribution using the mean of 0 and the standard deviation of 1. The near Gaussian distribution that results from this process provides a more traditional model for reviewing population data. Note the x-axis is given in standard deviation units where 68% of the population is between +/- 1 standard deviation, 95% between +/- 2 standard deviations, and 99.7% is between +/- 3 standard deviations.28 Similar normalizations and transformations for 7-aminoclonzepam, lorazepam, oxazepam, and temazepam cannot be achieved at this time due to insufficient sample sizes of < 4,000.
Alprazolam (Xanax®) and its metabolite, α-hydroxyalprazolam exhibit median values of 96ng/mL and 209ng/mL, respectively. When compared with most other benzodiazepine UDT levels, these levels are lower except those of the primary metabolite of clonazepam, 7-aminoclonazepam, with a median value of 189ng/mL. Oxazepam and Temazepam demonstrate the highest levels and are consistent with the fact that they are dosed at higher levels.29 To better understand the UDT range for different benzodiazepine doses, alprazolam data was divided into different daily doses and plotted in Figure 2A. The overlapping ranges make it difficult to use a UDT result to discretely determine dose adherence, and is why the normalization and transformation model is preferred, as dose is included in the calculations (Equation 2).
The impact of dose on the range and median values are as predicted as shown in Figure 2 for alprazolam, alpha-hydroxyalprazolam, 7-aminoclonazepam, lorazepam, and nordiazepam. We did not generate dosage dependent “box and whisker” plots for oxazepam and temazepam as the sample sizes were too small. While the median values of alprazolam increase with dose (Figure 3A), the range increases almost exponentially. Some drug ranges showing unexpected lower or higher ranges than the trend might be due to the small sample size (Table 2) for that dose.
Alprazolam |
Alpha-alprazolam |
7-aminoclonazepam |
Lorazepam |
Nordiazepam |
|||||
Dosage |
Sample size |
Dosage |
Sample size |
Dosage |
Sample size |
Dosage |
Sample size |
Dosage |
Sample size |
0.25mg |
536 |
0.25mg |
514 |
0.25mg |
31 |
0.5mg |
398 |
2mg |
95 |
0.5mg |
2468 |
0.5mg |
2362 |
0.5mg |
707 |
1mg |
949 |
4mg |
111 |
0.75mg |
894 |
0.75mg |
860 |
0.75mg |
29 |
1.5mg |
314 |
5mg |
495 |
1mg |
4844 |
1mg |
4655 |
1mg |
1716 |
2mg |
797 |
6mg |
76 |
1.5mg |
3540 |
1.5mg |
3411 |
1.5mg |
558 |
3mg |
544 |
8mg |
25 |
2mg |
4489 |
2mg |
4367 |
2mg |
1406 |
4mg |
230 |
10mg |
1004 |
2.5mg |
52 |
2.5mg |
52 |
2.5mg |
29 |
6mg |
141 |
15mg |
483 |
3mg |
4943 |
3mg |
4845 |
3mg |
825 |
>6mg |
80 |
20mg |
613 |
4mg |
2570 |
4mg |
2526 |
4mg |
428 |
30mg |
434 |
||
4.5mg |
36 |
4.5mg |
36 |
6mg |
183 |
40mg |
122 |
||
5mg |
77 |
5mg |
75 |
8mg |
51 |
>40mg |
51 |
||
6mg |
1247 |
6mg |
1218 |
>8mg |
99 |
||||
8mg |
523 |
8mg |
506 |
||||||
9mg |
30 |
9mg |
30 |
||||||
10mg |
35 |
10mg |
35 |
||||||
>10mg |
99 |
>10mg |
94 |
||||||
Table 2 Sample size for drugs at various doses
Part of the focus for this paper is to aid physicians in determining patient adherence. To be successful, alprazolam outliers should be readily identified from a comparison with Figure 3A. The ability to differentiate adherence from abuse from this “box and whisker” (Figure 3A) representation of alprazolam data is probably restricted to very low doses where a UDT result above the range presented for that low dose would suggest abuse or possible genetic/metabolic variations. Making decisions from population based data displays is difficult for those patients who fall above, but near the upper limit of the “normal range” and should be made in conjunction with other clinical observations of the individual patient.
The verification of urine drug screen results by LC-MS/MS for routine monitoring of patients prescribed benzodiazepines is not currently standard of care in most mental health clinics or primary care practices (where the majority of benzodiazepines are prescribed).30 These medications carry significant abuse-potential and the risk of lethal overdose. The ability to quickly compare UDT results without further mathematical manipulation to results from a large test population may help physicians determine patient adherence from their UDT data. While various normalizations and transformations have been reported,15-24 they all require additional mathematical manipulations often using demographic data that may or may not be available. Thus, direct comparison of individual patient data with raw data ranges (albeit filtered for inconsistent results) may be the easiest and most impactful way to help assess patient adherence.
This paper and the data contained within provide an important step forward in a clinicians' ability to monitor the safety and effectiveness of treatment for anxiety/panic disorders with benzodiazepines. Given the recent rise in deaths attributable to multi-drug overdoses, many of which include benzodiazepines,31 it is imperative that prescribers are well equipped to determine how patients are using these medications. Well-defined reference ranges are integral in this endeavor.
The Authors acknowledge the assistance of Mr. Jeremy Smith and Mr. Vimal Lawrence in gathering these data for analysis.
The authors do not have any conflicts of interest with this work.

©2019 Feng, et al. This is an open access article distributed under the terms of the, which permits unrestricted use, distribution, and build upon your work non-commercially.