Journal of
eISSN: 2473-0831


Research Article Volume 6 Issue 2
Correspondence: Milan Meloun, Department of Analytical Chemistry, University of Pardubice, CZ 532 10 Pardubice, Czech Republic, Tel 4.20466E+11, Fax 4.20466E+11
Received: August 21, 2017 | Published: September 27, 2017
Citation: Meloun M, Mikešová V, Pekárek T, Jav?rek M (2017) The Thermodynamic Overlapping pK a of the Antitumor Drug Ibrutinib Using Multiwavelength UV/VIS-Spectroscopy and Potentiometry. J Anal Pharm Res 6(2): 00173. DOI: 10.15406/japlr.2017.06.00173
Potentiometric and spectrophotometric pH-titrations of the antitumor drug Ibrutinib for dissociation constants determination were compared. Ibrutinib is targeting B-cell malignancies, for treatment of chronic lymphocytic leukemia, and Waldenström's macroglobulinemia. Chemometrics approach to the nonlinear regression of the pH-spectra (REACTLAB, SQUAD84) and pH-titration (ESAB) determines four dissociation constants. Ibrutinib exhibits four protonatable centers in a pH range of 2 to 10, where only two pK are well separated (ΔpK > 3), while the others are near dissociation constants of overlapping equilibria. The molecule LH2 can protonate to sparingly soluble cations LH3+ and LH42+ and dissociate to anions LH- and L2-. The set of spectra for pH from 2 to 11 in 220 to 300nm exhibits chromophore sensitivity to a pH change. Since pH above 10 and pH below 5 occurs in a titrated solution of a very fine precipitate of Ibrutinib, this part of the potentiometric titration curve pH over 10 and pH below 5 did not undergo regression analysis to estimate pKa´s. Depending on ionic strength the thermodynamic dissociation constants were estimated at 25°C and 37°C: pKa1T = 3.22 and 3.22, pKa2T = 4.17 and 5.21, pKa3T = 6.77 and 6.77, pKa4T = 9.82 and 9.81.
Keywords: dissociation constants, ibrutinib, spectrophotometric titration, reactlab, squad84, esab
Ibrutinib(, also known as PCI-32765 and marketed under the name Imbruvica) (Figure 1) of formula C25H24N6O2 and molar mass 440.497 is an anticancer drug targeting B-cell malignancies. It was approved by the US Food and Drug Administration (FDA) in November 2013 for the treatment of mantle cell lymphoma and in February 2014 for the treatment of chronic lymphocytic leukemia. Ibrutinib is currently under by Pharmacyclics, Inc andJohnson & Johnson's Janssen Pharmaceutical division for additional B-cell malignancies including diffuse large B-cell lymphoma and multiple myeloma.1,2 In January 2015, Ibrutinib was approved by the FDA for treatment of Waldenström's macroglobulinemia, a form of non-Hogkin´s lymphoma.
Ibrutinib (Imbruvica) is a small molecule drug that binds permanently to a protein, Bruton's tyrosine kinase (BTK), that is important in B cells. In preclinical studies on chronic lymphocytic leukemia (CLL) cells, Ibrutinib has been reported to promote apoptosis, inhibit proliferation, and also prevent CLL cells from responding to survival stimuli provided by the microenvironment.1,2 In early clinical studies, the activity of Ibrutinib has been described to include a rapid reduction in lymphadenopathy accompanied by transient lymphocytosis, suggesting that the drug might have direct effects on cell homing or migration to factors in tissue microenvironments.3
Knowledge of the possible ionization states of a pharmaceutical substance, embodied in the logarithm of the mixed acid dissociation constant pKa, is vital for understanding many properties essential to drug development.4 As the majority of drugs are weak acids and/or bases, knowledge of the dissociation constant in each case helps in understanding the ionic form a molecule will take across a range of pH values and the level of general interest in such ionization phenomena is evident from the large number of recent publications on the topic.5-8 pKa values can be either experimentally measured or theoretically predicted:
The aim of our study was to examine and verify the spectrophotometric analysis of the pH-absorbance matrix and to carry out a potentiometric determination of the protonation model to find suitable conditions for a reliable regression determination of dissociation constants from the spectra of the Ibrutinib antitumor drug. Here we are reporting our obtained experimental results that were also evaluated by two different LFER based pKa predictions tools, MARVIN and ACD/pK software.
Data analysis
The procedure of spectrophotometric study of the acid-base equilibria of Ibrutinib was described previously.16,17 The general procedure used to build the protonation model with SPECFIT32, REACTLAB or SQUAD84 was described in.15,31,32 Two programs for the numerical analysis of spectra were used, REACTLAB and SQUAD84, which compared the consensus found in numerical parametric estimates and in a fitness of the predicted absorbance spectra through measured absorbance data. The potentiometric determination with the use of ESAB program was described previously.33-35
Reliability of pKa,j estimates obtained by the goodness-of-fit test
A detailed procedure of the graphical and numerical analysis of residuals is described in.13,16,17 The vector of residuals in each spectrum and finally in the entire absorbance matrix is statistically analyzed and the closest fit of the data is proven. The adequacy of a proposed regression model with experimental data and the reliability of found parameter estimates, bj, j = 1,..., m, may be examined by the goodness-of-fit test, cf. page 101 in ref.36 The statistics of residuals can be used for a numerical goodness-of-fit evaluation, cf. page 290 in ref.37
Chemicals and solutions
Ibrutinib donated by ZENTIVA GROUP, Ltd. (Prague) with declared purity checked by a HPLC method and alkalimetrically, was always >99%. This drug has been weighted straight to a reaction vessel to reach a resulting concentration of about 5.8×10⁻⁵ mol. dm-3 Other chemicals were described previously.14,38
Apparatus and procedure
The apparatus used and the both titration procedures have been described previously in detail.15,16,31. The experimental and computation scheme to determine the dissociation constants of the multi-component system is taken from Meloun et al.36 and the five steps are described in details.16
Computation and software
Estimation of dissociation constants was performed by regression analysis of the UV/VIS spectra using the SQUAD84, REACTLAB and ESAB programs and the spectra interpretation with the use of the INDICES programme.39 aims to evaluate the quality of the dataset. Most graphs were plotted using ORIGIN 9.40 and S-Plus. ACD/pK and MARVIN programs for predictions are based on the structural formulae of drug compounds.
Computational prediction of pK
Ibrutinib has six functional groups (denoted with letters A, B, C, D, E, F in the upper part of Figure 2) that can be associated with dissociation constants; two ionizations are associated with the oxygen and four ionization with the nitrogen atom.
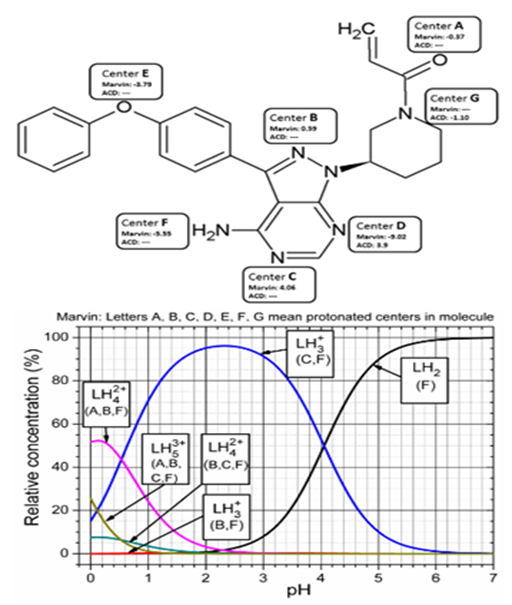
Figure 2 Schematic representation of the consecutively protonated molecular structure of Ibrutinib (Upper panel) and the Marvin-distribution diagram of the relative concentration of variously protonated ions according to MARVIN prediction (Lower panel) describes the protonated centers: LH2 (F) means that center F is protonated, LH3+(C, F) means that centers C, F are protonated or the centers B, F in tautomeric form are protonated, LH42+(B, C, F) means that centers B, C, F are protonated or the centers A, B, F in tautomeric form are protonated, LH53+(A, B, C, F) means that centers A, B, C, F are protonated.
The macrodissociation constants of Ibrutinib were predicted according to the chemical structure analyzed by two reliable pKa prediction tools. ACD/Percepta.26 was run using the GALAS model, which uses an internal training set of >31000 individual pKa values for approximately 16000 compounds in aqueous solutions, experimental data of 2000 molecules in nonaqueous solvents and gives more detailed information about macrospeciation. Marvin pKa predictions.41 are based on the calculated partial charge of the atoms located in the analyzed structure, using the Hammett-Taft approach (Figure 2).
Beside macrodissociation constants, the ionic species distribution diagram of Ibrutinib was also predicted using ACD/Percepta software (lower part of .). The most significant species (>10% in solution) were obtained for Ibrutinib. Once the solution pH increased, the following ionization sequence was obtained: LH2 (F) means that center F is protonated; LH3+(C, F) means that centers C, F are protonated or the centers B, F in tautomeric form are protonated; LH42+(B, C, F) means that centers B, C, F are protonated or the centers A, B, F in tautomeric form are protonated; LH53+(A, B, C, F) means that centers A, B, C, F are protonated. According to the Marvin-distribution diagram in Figure 2, Ibrutinib is supposed to behave mostly as a neutral molecule LH2 in biological relevant pH from 5 to 8. We also performed an ionic distribution analysis using Marvin and the obtained data were similar to the ones obtained with ACD/percepta. The structural prediction of dissociation constants of Ibrutinib was performed using the MARVIN program to specify protonation locations, (Figure 2).
Spectra analysis
The strategy for efficient experimentation in dissociation constants determination followed by spectral data treatment was used according to the published Tutorial.16 A qualitative interpretation of the spectra aims to evaluate the quality of the data set, remove spurious data, and estimate the minimum number of factors, that is contributing aqueous species, which are necessary to describe the experimental data.
Determination of the number of light-absorbing species: Ibrutinib contains a complicated molecular structure introduced in Figure 1 & 2 and several protonation equilibria were monitored spectrophotometrically to analyze a spectra set in two steps (Figure 3): first, the spectral data in the form of a data matrix were subjected to principal component analysis to determine the number of independent light absorbing species using the INDICES algorithm.39
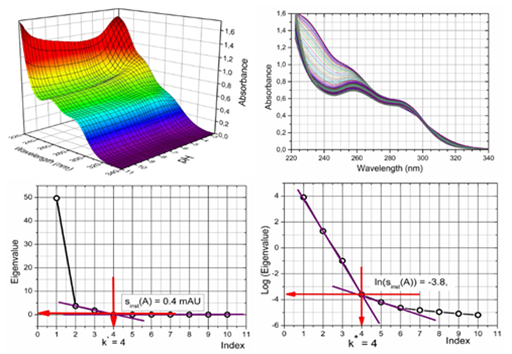
Figure 3 The 3D and 2D-absorbance-response-matrix concerning UV/VIS-absorption spectra of protonation equilibria for Ibrutinib on pH at 25℃ represents the input for the SQUAD(84) and REACTLAB programs (upper part). Cattel’s scree plot sk(A)=f(k) of the Wernimont-Kankare criterion of singular value decomposition (SVD) to determine the rank of the absorbance matrix of Ibrutinib k*=4 which leads to four light-absorbing species in the mixture, nc=4, and the actual instrumental error s(A) of the spectrophotometer used sinst(A) = 0.4mAU, (lower part).
Conditions: Solution of 5.8×10⁻⁵ M Ibrutinib in phosphate buffer (I=0.004 adjusted with KCl) at 25°C was titrated with 0.814M KOH or 1.044M HCl to get the absorbance matrix of ns=70 spectra measured at nw=63 wavelengths, (INDICES in S-PLUS).
The INDICES indicate the position of break points on the sk(A) = f(k) curve in the screen plot using the most reliable approaches by Kankare´s s(A).12,39) and gives k = 4 with the corresponding co-ordinate s4(A) = 0.4 mAU (Figure 3c). This value also represents the actual instrumental error sinst(A) = 0.40mAU of the spectrophotometer CINTRA 5 (GBC, Australia). The number of light-absorbing species helps to establish a protonation model. This means that four dissociation constants will be preferred and five species LH42+, LH3+, LH2, LH- and L2- are supposed to be present. For the large variations in the indicator values, these latter graphs are plotted on a logarithmic scale and the number of light-absorbing species p can be predicted from the index function by finding the point p = k where the slope of index function PC(k) = f(k)changes, or by comparing PC(k)values with the instrumental error sinst(A) = 0.40mAU when log sinst(A) = -3.4, (Figure 3).
Search for the protonation model: The search for the best chemical model containing either 3, 4 or 5 dissociation constants is shown in Figure 4: The spectra set of useful analytical wavelengths ranges was examined to indicate the best wavelengths range in which the actual chromophore is active and reflects the protonation/dissociation in the molecule. The best regression model was sought by testing three working hypotheses about the protonation model: the first concerning three and the others with four or five dissociation constants. The criterion of reliability between both hypotheses was the goodness-of-fit test. At the same time the estimates of the dissociation constants using two regression programs were compared, i.e. SQUAD84 and REACTLAB, (Table 1). The standard deviation of residuals and the Hamilton R-factor of relative fitness generally showed that better fit of the calculated spectra was always achieved for the protonation model with 4 dissociation constants.
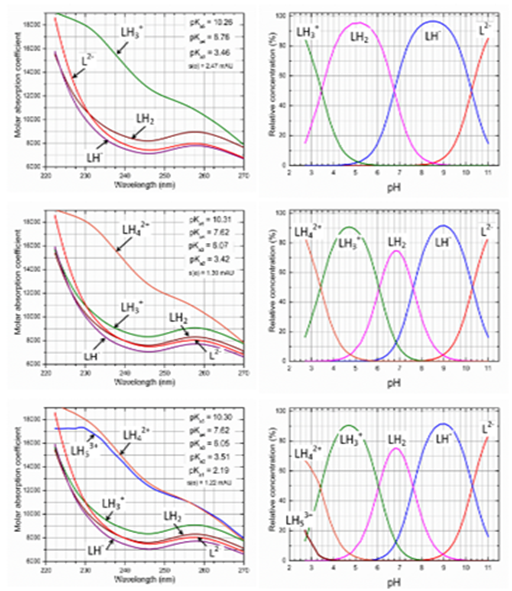
Figure 4 Typical SQUAD84 working environment testing the best protonation model of Ibrutinib in the pH range from 2 to 11 for the hypotheses of three, four and five dissociation constants pKa1, pKa2, pKa3, pKa4, pKa5 using 5.8×·10-5M Ibrutinib at I=0.002 at 25°C. Left panel: pure spectra profiles of molar absorptivities vs. wavelength (nm) for all of the variously protonated species. Right panel: distribution diagram of the relative concentrations of all of the variously protonated species depending on pH. Upper row: the hypothesis of three pKa´s. Middle row: the hypothesis of four pKa´s. Lower row: the hypothesis of five pKa´s, Conditions: the same as in Figure 2, (SQUAD84, ORIGIN).
|
Protonation model contains |
Five pKa´s |
Four pKa´s |
Three pKa´s |
|
|
Cattel´s scree plot indicating the rank of the absorbance matrix (INDICES) |
||||
|
Number of spectra measured, ns |
63 |
|||
|
Number of wavelengths, nw |
70 |
|||
|
Number of light-absorbing species, k* |
4 or 5 |
|||
|
Residual standard deviation, sk*(A)[mAU] |
0.53 or 0.44 |
|||
|
Estimates of Dissociation Constants in the Searched Protonation Model |
||||
|
Dissociation constant |
Program |
|||
|
pKa1(s1), LH53+=H++LH42+ |
SQUAD84 |
2.08(774) |
XX |
XX |
|
ReactLab |
1.88(116) |
XX |
XX |
|
|
pKa2(s2), LH42+=H++LH3+ |
SQUAD84 |
3.40(04) |
3.42(02) |
XX |
|
ReactLab |
3.39(03) |
3.42(00) |
XX |
|
|
pKa3(s3), LH3+=H++LH2 |
SQUAD84 |
6.04(02) |
6.08(02) |
3.46(01) |
|
ReactLab |
6.04(01) |
6.07(01) |
3.46(00) |
|
|
pKa4 (s4), LH2=H++LH- |
SQUAD84 |
7.61(01) |
7.62(01) |
6.76(01) |
|
ReactLab |
7.62(03) |
7.62(01) |
6.76(01) |
|
|
pKa5(s5), LH-=H++L2- |
SQUAD84 |
10.30(01) |
10.31(01) |
10.26(01) |
|
ReactLab |
10.30(01) |
10.31(01) |
10.26(01) |
|
|
Goodness-of-Fit Test with the Statistical Analysis of Residuals |
||||
|
Mean residual E│ē│ [mAU] |
SQUAD84 |
0.77 |
0.79 |
1.79 |
|
ReactLab |
0.6 |
0.62 |
1.3 |
|
|
Standard deviation of residuals s(ê) [mAU] |
SQUAD84 |
1.23 |
1.27 |
2.51 |
|
ReactLab |
0.84 |
0.89 |
1.64 |
|
|
Sigma from ReactLab [mAU] |
SQUAD84 |
--- |
--- |
--- |
|
ReactLab |
1.26 |
1.3 |
2.51 |
|
|
Hamilton R-factor from SQUAD84 [%] |
SQUAD84 |
0.28 |
0.3 |
0.6 |
|
ReactLab |
XX |
XX |
XX |
|
|
Hypothesis about the protonation model is |
Rejected |
Accepted |
Rejected |
|
Table 1 The search for the best protonation model of Ibrutinib in the pH range from 2 to 11 tested models up to five dissociation constants pKa1, pKa2, pKa3, pKa4, pKa5 with SQUAD84 and REACTLAB at 25℃. Solution of 5.8·10-5M Ibrutinib at I=0.004 at 25°C, for ns spectra measured at nw wavelengths for nz=2 basic components L and H forms variously protonated species. The standard deviations of the parameter estimates are in the last valid digits in brackets. The resolution criterion and reliability of parameter estimates found are proven with goodness-of-fit statistics such as the residual standard deviation by factor analysis sk(A) [mAU], the mean residual E│ē│[mAU], the standard deviation of absorbance after termination of the regression process s(ê) [mAU], the sigma s(A) [mAU] from REACTLAB and the Hamilton R-factor of relative fitness [%] from SQUAD84.
Four dissociation constants pKa1, pKa2, pKa3, pKa4 and five molar absorptivities of Ibrutinib ɛL, ɛLH, ɛLH2, ɛLH3, ɛLH4, were estimated using SQUAD(84) and REACTLAB in the first run. The reliability of the parameter estimates may be tested using the following diagnostics as was published.16 (Figure 4).
The first diagnostic value indicates whether all of the parametric estimates pKa,r and ɛr have physical meaning and reach realistic values. As the standard deviations s(log pKa,r) of parameters log pKa,r and s(ɛr) of parameters ɛr are significantly smaller than their corresponding parameter estimates, all the variously protonated species are statistically significant at a significance level of α=0.05. Figure 4 shows the estimated molar absorptivities of all of the variously protonated species ɛL, ɛLH, ɛLH2, ɛLH3, ɛLH4, ɛLH5 of Ibrutinib with regard to wavelength. The curves of ɛLH4 and ɛLH5 seemed to be the same and therefore the cation LH53+ was denoted as the computer species not having chemical sense.
The second diagnostic examines whether all of the calculated free concentrations of variously protonated species on the distribution diagram of the relative concentration expressed as a percentage have physical meaning, which proved to be the case (right panel of Figure 4). The distribution diagram shows the protonation equilibria of LH42+, LH3+, LH2, LH- and L2-. At neutral pH from 5 to 8 Ibrutinib prevails as the neutral molecule LH2 and cation LH3+, and from pH 6 to pH 9 it does so in the form of anions LH-. In the pH range of 6 to 10 the neutral molecule LH2 deprotonates to the anions LH- and L2-. Acidification of the neutral molecule LH2 first creates the cation LH3+, which in a solution of pH 2 to pH 4 predominates to 80% LH42+. Further acidification of the cation LH42+ could create the cation LH53+ from pH 4 to pH 1. At concentrations of 10-4 to 10-6 M the Ibrutinib is sufficiently soluble and all its dissociation constants can therefore be spectrophotometrically determined.
The next diagnostic concerns the goodness-of-fit. Although this statistical analysis of residuals.16 gives the most rigorous test of the degree-of-fit, realistic empirical limits must be used. The statistical measures of all residuals e prove that the minimum of the elliptic hyperparaboloid RSS has been reached (Table 1): the standard deviation of residuals s(ê) and the mean residual E│ē│ always have sufficiently low values, lower than 2 mAU, which is less than 0.2% of measured absorbance value proving a good fitness (Figure 5).
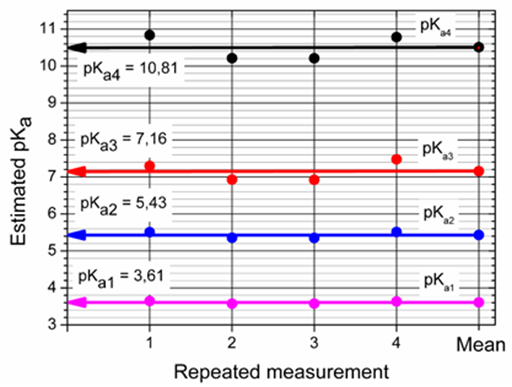
Figure 5 Reproducibility of found four dissociation constants pKa1, pKa2, pKa3, pKa4 with the regression analysis of pH-absorbance matrix of 5.8×·10-5M Ibrutinib at I=0.004 at 25°C with SQUAD84 and REACTLAB.
Dissociation constants estimated with SQUAD84 and REACTLAB are in good agreement. The SQUAD approach has a great advantage in a rigorous goodness-of-fit test made by the statistical analysis of residuals. Reproducibility of four experimental spectra sets with the use of two regression programs shows that three from four dissociation constants pKa1 3.61, pKa3 7.16 and pKa4 10.81 are well-conditioned in the regression model, and therefore their numerical evaluation is quite reliable. The second dissociation constant pKa2 5.43 is ill-conditioned in the regression model, the hyperparaboloid shape on this parameter is rather saucer-like without a distinctive minimum. Numerical enumeration of all coordinates of this minimum is more difficult, and the parameter estimates are therefore less reliable and pKa2 is rather uncertain.
Figure 6 presents six following figures from pH=4.06 through pH=10.54 to show the consecutive deprotonation response in spectra, when each spectrum was decomposed into the spectrum of differently protonated species in a mixture of Ibrutinib. At pH = 4.06 the cation LH3+ accompanying cation LH42+ predominates in the solution. At pH=5.34 together with the neutral molecule LH2 one species LH3+ exhibits absorption band at the same of the absorption maximum λmax. At pH = 6.13 and 6.96 the experimental spectrum is decomposed to two absorption bands concerning the neutral molecule LH2 which dissociates to anion LH-. At pH=9.69 the anion LH- occurs with anions LH2- and L2-, and concentration of L2- in the solution increases up to pH=10.54.
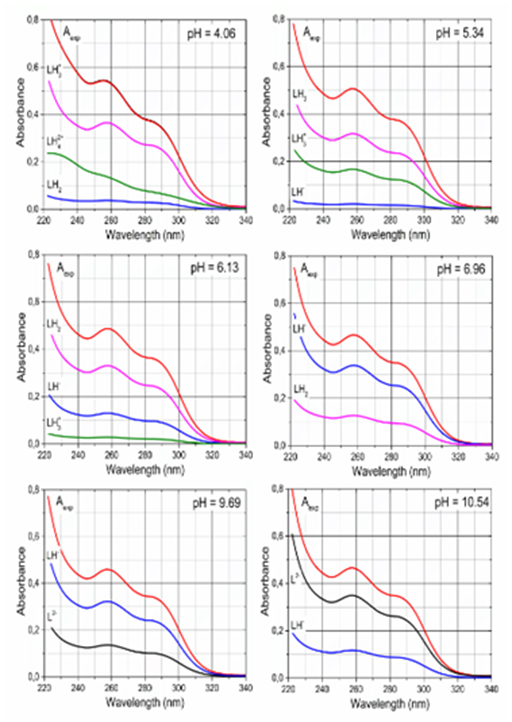
Figure 6 Deconvolutio n of the each experimental spectrum of 5.8×·10-5M Ibrutinib at I=0.004 at 25°C into the spectra for the individual variously protonated species in a mixture for pH equal to: 4.06, 5.34, 6.13, 6.96, 9.69, 10.54 using SQUAD84, Conditions: the same as in Figure 2.
Signal-to-Noise Ratio (SNR) and small changes in spectra: To express small changes of absorbance in the spectral set, the absorbance differences for the jth wavelength of the ith spectrum Δij = Aij – Ai,acid were calculated.17 (Figure 7). The plot of small absorbance changes in the spectrum of the drug studied means that the value of the absorbance difference for the jth wavelength of the ith spectrum Δij = Aij – Ai,acidis divided by the instrumental standard deviation sinst(A), and the resulting ratios SER = ∆/sinst(A) are plotted according to wavelength λ for all absorbance matrix elements, where Ai,acid is the initial spectrum of the acid form of the drug being measured for the starting pH value of the pH range studied. This SER ratio is then, for example, compared to the limiting SER value to test if the absorbance changes are significantly larger than the instrumental noise. When the SER is larger than 10, a factor analysis is able to predict the correct number of light-absorbing components in the equilibrium mixture. To prove that non-linear regression can analyze such data the residuals set was compared to the instrumental noise sinst(A). Figure 7 shows a comparison of the ratio e/sinst(A) according to wavelength for the measured Ibrutinib. It is clear from the figure that most of the residuals are of the same magnitude as the instrumental noise.
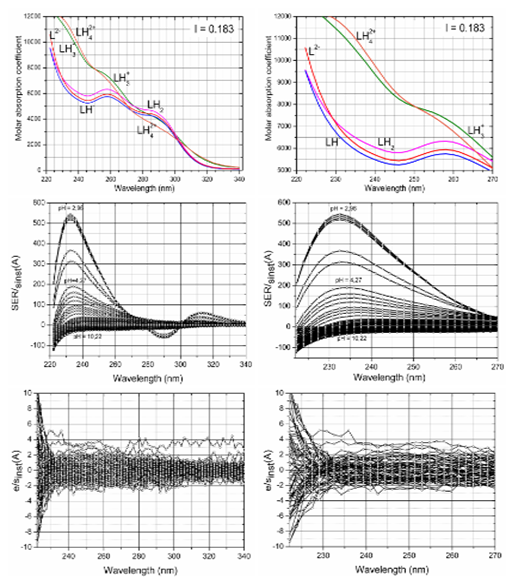
Figure 7 Plot of small absorbance changes in the Ibrutinib spectrum within pH-titration. Left panel: Spectrum range 220-340 nm. Right panel: Spectrum range 220-270nm. Upper row: The plot of molar absorption coefficient of variously protonated species vs. wavelength λ (nm). Middle row: The value of the absorbance difference for the jth-wavelength of the ith-spectrum Δij=Aij–Ai,acid is divided by the instrumental standard deviation sinst(A), and the resulting ratios SER/sinst(A) are plotted in dependence of wavelength λ for all absorbance matrix elements, where Ai,acid is the limiting spectrum of the acid form of the drug. Lower row: Plot of the ratio e/sinst(A), i.e. the ratio of the residuals divided by the instrumental standard deviation sinst(A) versus the wavelength λ for all the residual matrix elements for Ibrutinib tests if the residuals are of the same magnitude as the instrumental noise, Conditions: the same as in Figure 2, (SQUAD84).
Determination of the thermodynamic dissociation constants: Examining the effect of the ionic strength on protonation of chromophore it is obvious from the dependence of the spectra shape on the ionic strength that at a low value of ionic strength the chromophore of three species LH2, LH- and L2- is not significantly affected by the change of pH (Figure 8). Two cations LH3+ and LH42+ differ in spectra in pure water but with increasing ionic strength the difference between ɛLH3 and ɛLH4 decreases and for ionic strength I=0.2 both spectra are nearly the same (Figure 8).
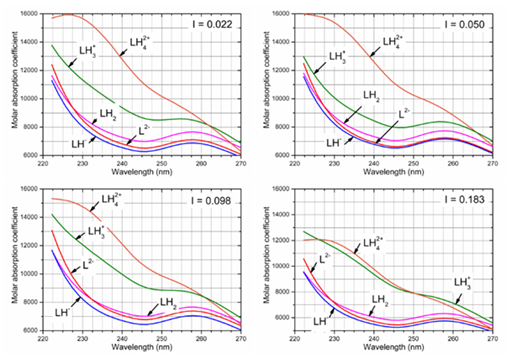
Figure 8 The influence of ionic strength (KCl) on protonation of the chromophore in 5.8·10-5 M Ibrutinib at 25°C leads to some changes of the molar absorption coefficients depending on the wavelength (nm) analysed with SQUAD84 and REACTLAB, Conditions: the same as in Figure 2, (SQUAD84).
The limited form of the Debye–Hűckel equation to the data for aqueous solutions and 25◦C was applied so that the mixed dissociation constant pKa is a dependent variable while the ionic strength I stands for the independent variable. One unknown parameter pKaT is estimated by a minimization of the sum of squared residuals. The nonlinear estimation problem is simply a problem of optimization in the parameter space in which the pKa and I are known and given values while the parameter pKaT is an unknown variable to be estimated using extrapolation to zero value of ionic strength (Figure 9).
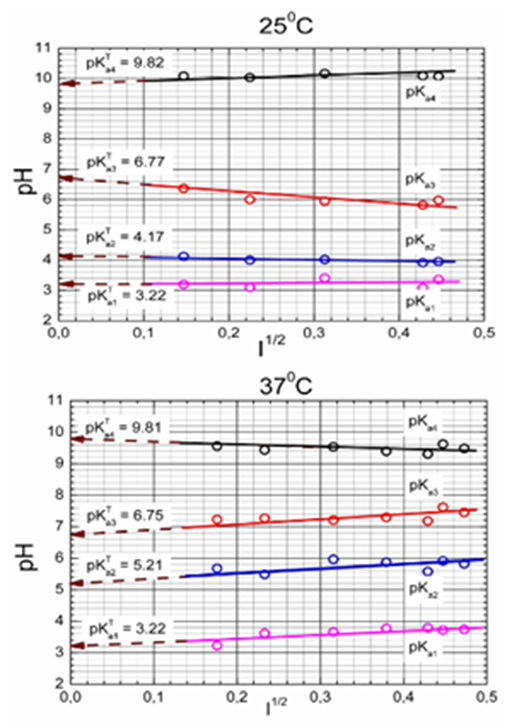
Figure 9 Dependence of the mixed dissociation constant pKa of Ibrutinib on the square-root of the ionic strength leading to the thermodynamic dissociation constant pKaT at 25◦C.
Potentiometric titration data analysis
The potentiometric titration of a mixture of HCl and Ibrutinib with potassium hydroxide was carried out at 25℃ and also 37℃ for the adjusted value of ionic strength (Figure 10). The initial tentative value of the dissociation constant of the Ibrutinib antitumor drug studied, corresponding to the midpoint value in each plateau of the potentiometric titration curve, was refined by the ESAB program.
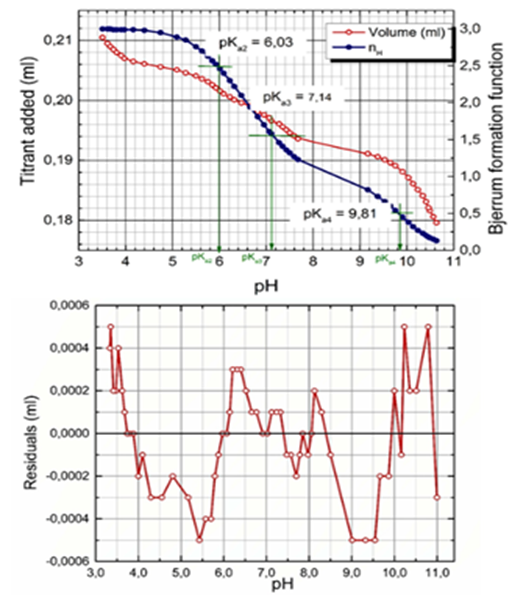
Figure 10 The potentiometric titration curve of acidified Ibrutinib plus HCl titrated with KOH is plotted with the Bjerrum protonation function indicating pK values and analyzed with ESAB (Upper row). Plot of residuals vs. pH proves the reliability of the regression process performed (Lower row).
Conditions: Common parameters refined: pKa2=6.03, s2=0.03, pKa3=7.14, s3=0.04, pKa4=9.81, s4=0.07. Group parameters refined: L0=0.0003868mol. dm-3. Constants used: HT=-0.8138 mol. dm-3, t=25.0oC, pKw=13.9799, V0=20.22mL, s(V)=sinst(y)=0.0001mL, s(pH)=sinst(y)=0.01, I0=0.004 (in vessel), IT=0.8138 (in burette KOH) or 1.0442 (in burette HCl), (ESAB, ORIGIN).
Since Ibrutinib exhibits three close consecutive dissociation constants, their numerical estimation is rather difficult and even impossible without the use of a computer-assisted nonlinear regression. A regression analysis was employed by using a plateau of the middle part titration curve which concerned an alkalized Ibrutinib titrated with hydrochloric acid, followed by a subsequent retitration with potassium hydroxide. Also calculated on the assessed point titration curve was the Bjerrum formation protonation function, which is shown in the graph in Figure 10. The estimates of three dissociation constants pKa2, pKa3, pKa4 are plotted on the Bjerrum formation curves. Since pH above 9 and pH below 5 occurs in a titrated solution, a very fine precipitate of Ibrutinib which is initially forming a slight opalescence, this part of the titration curve pH over 9 and pH below 5 did not undergo regression analysis only for estimating pKa2, pKa3, pKa4 (Figure 11).
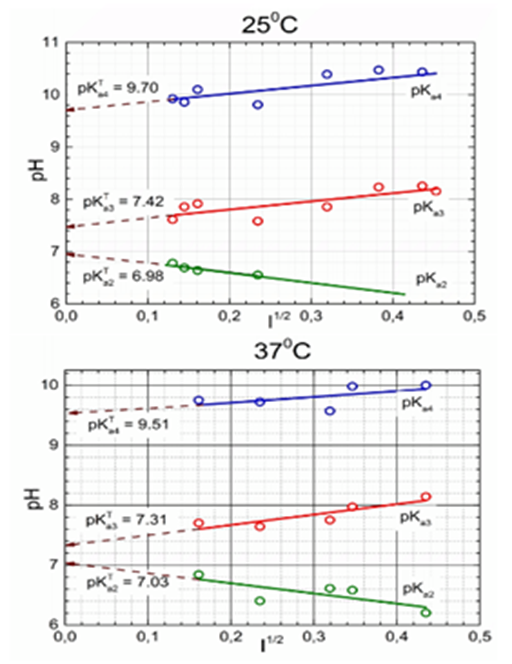
Figure 11 Dependence of the mixed dissociation constants of Ibrutinib on the square root of ionic strength for three dissociation constants leading to the thermodynamic dissociation constant pKaT at 25°C and 37°C.
Since it is a difficult task in regression analysis to estimate such close dissociation constants, the ESAB computer program was used and the resulting pKa estimates were compared. The ESAB residuals are defined as the difference between the experimental and calculated titrant volume. The goodness-of-fit test is performed with the statistical analysis of residuals. As further group parameters are refined, the fit is improved. A quite sensitive criteria of the reliability of the dissociation constants estimated is the mean of absolute values of residuals E│ē│. Comparing residuals with the instrumental noise, sinst(y), represented here by either sinst(y) = s(V)= 0.0001mL, an excellent fit is confirmed since the mean E│ē│ and the residual standard deviation s(ˆe) are nearly the same and are lower than the experimental noise sinst(y). Here, E│ē│= 0.0001mL and s(ˆe) = 0.0002mL are similar and both are lower than the microburette error s(V) = 0.0001mL. All residuals oscillate between lower -0.0005mL and upper 0.0005mL of Hoaglin´s inner bounds and therefore no outlying residuals lay outside these bounds.42 The estimates of the dissociation constants estimated by ESAB are reliable. The curve-fitting is significantly improved using the refinement of the group parameter L0, the concentration of the titrated drug Ibrutinib.
Spectroscopic titration has been utilized as an alternative to determine pKa values of substances with large molar absorptivities because of its high sensitivity at concentrations of substance as low as 10-6 M. However, the compound under investigation must posses chromophore(s) in proximity to the ionization center(s) so that the protonated and deprotonated species exhibit sufficient spectral dissimilarity. In UV titration, the spectral data of Ibrutinib measured are a series of spectra acquired at different pH values. Acidifying the solution of the neutral molecule LH2 leading to cations LH3+, LH42+ and LH53+ may be disturbed by Ibrutinib precipitation which manifests itself especially at higher concentrations in potentiometric determination. For this reason, in potentiometric concentration 0.0005 M the dissociation constant pKa1 is not available since Ibrutinib precipitates in an acidic solution. Both programs SQUAD84.11,18,19 and REACTLAB.20 or its previous version SPECFIT.21 for spectra analysis produce for spectrophotometric concentration 5.8×10⁻⁵M Ibrutinib the same estimates of all four dissociation constants which exhibit identical goodness-of-fit test.The influence of temperature at 25℃ and 37℃ does not seem to be significant here.
The ESAB program.33-35 minimizing residuals ei = (Vexp, i - Vcalc, i) reaches 0.1 or 0.2 microliters, thus proving an excellent fit. It may be concluded that the reliability of the dissociation constants of Ibrutinib was proven even when group parameters L0, HT were ill-conditioned in a model. The goodness-of-fit proved sufficient reliability of the parameter estimates for four dissociation constants of the drug Ibrutinib at 25°C and 37°C.
It was proven that the most reliable regression estimate of the dissociation constants comes from reliable experimental data. In the case of close dissociation constants, a higher degree of uncertainty in estimates should be expected and therefore two independent instrumental methods should usually be applied and the results calculated using several independent programs compared.
All determined dissociation constants are not in a good agreement with the predicted values from program MARVIN.25,27 as stated in the results and conclusion chapter. This discrepancy might be caused by unclear resonance structure of the heterocyclic molecule core, and, consequently, different electrones distribution, which can further lead to different predicted values according to the proposed structure. Moreover, these values can differ from the experimentally determined dissociation constants. In such cases prediction programs MARVIN.25,27 and ACD/pK.24-26 may fail and experimental laboratory detemination is needed. As both potentiometric and spectrophotometric results are similar and regarding the goodness of fit tests one can conclude the obtained experimental results are reliable and they show the real dissociation of the substance.
Spectrophotometric and potentiometric pH-titration allowed the measurement of four dissociation constants of Ibrutinib, but worse solubility at pH above 10 and also pH below 5 for the Ibrutinibconcentration of micromoles leads to the conclusion that an estimation of the pKa higher than 10 and in potentiometry lower than 5 is not reliable enough.
None.
None.

©2017 Meloun, et al. This is an open access article distributed under the terms of the, which permits unrestricted use, distribution, and build upon your work non-commercially.