Journal of
eISSN: 2473-0831


Research Article Volume 7 Issue 1
Correspondence: Márcio Robert Mattos da Silva, Department of Medicines, Faculty of Pharmacy, Federal University of Rio of Janeiro, University Pharmacy, Center of Health Sciences, Block K, room 50, 2o floor, RJ, Zip code: 21941-590, Brazil
Received: December 27, 2017 | Published: January 17, 2018
Citation: Silva MRM, Santos EP, Barros RCSA, Garcia S, Albuquerque MG et al. (2018) The Development of a New Complexation Technique of Hydrocortisone Acetate with 2-Hydroxypropyl-?-Cyclodextrin: Preparation and Characterization. J Anal Pharm Res 7(1): 00194. DOI: 10.15406/japlr.2018.07.00194
In the present study, an inclusion complex composed of hydrocortisone acetate (HA) and 2-hydroxypropyl-β-cyclodextrin (HPβCD) was prepared according phases solubility diagram of Higuchi & Connors and by a method described by Filipović-Grcić J et al..1 with minor modifications to improve the HA water solubility. This new method improved percentage of inclusion reaching the maximum percentage of inclusion (91.52±0.92%) using 5.75mM HA and 135mM HPβCD. This percentage of inclusion was higher than that found by Filipović-Grcić J et al..1 which was 25%. The complex HA/HPβCD was characterized by 1H-NMR through chemical shifts in 1H NMR spectra after the inclusion of HA into the HPβCD cavity, especially H-3, H-5 and H-6 protons was observed to the formation of molecular inclusion complex. Other technique used to characterize the inclusion complex was FT-IR, which showed in the FT-IR spectra of inclusion complex no features bands similar to pure HA molecule; the spectrum is very similar to the HPβCD. The molecular modeling studies results are in agreement with the experimental data that estimates a HA/HPβCD molar ratio of 1:1. The calculated apparent stability constant (KS) was 484 M-1. The results indicate that the HA/HPβCD inclusion complex is more water soluble than HA crystalline powder (pure), the AH solubility was increased on the order of 64 times.
Keywords:2-hydroxypropyl-β-cyclodextrin; Hydrocortisone acetate; Inclusion complex; FT-IR; 1H-NMR and modeling molecular
The Hydrocortisone acetate (Figure 1) is a white crystalline powder; it melts at about 220°C with decomposition and is practically insoluble in water 1mg/100mL.2 One method to overcome the poorly water solubility of HA is the use of cyclodextrins (CDs), which have been extensively studied.3 CDs have been extensively used as complexing agents to improve the solubility of a variety of poorly soluble drugs.4 CDS are regarded by pharmaceutical scientists as a new group of pharmaceutical excipients.5
CDs are macrocyclic torus-shaped molecules formed by D - (+) - glucopyranose units. CDs size and shape are correlated to the type and number of (1,4) linkages between those units and contain a somewhat lipophilic central cavity and a hydrophilic outer surface. CDs are capable of forming inclusion complexes with various types of organic compounds with improve solubility or other physicochemical properties.3 Due to the unique truncated cone structure of CDs, it can accommodate hydrophobic guest molecules inside the cavity6 (Figure 2A). The size and geometry of the molecule to be included in the CD must be adequate for the size and shape of the non-polar cavity. In general, organic compounds with molecular weights between 200 and 800 g/mol can be included in one of the three cavities formed by the (α, β and γ) CDs. Inclusion complexes may occur in solid or in solution.7 The organic compounds enter partly or entirely into the relatively hydrophobic cavity of CDs simultaneously expelling the few high-energy water molecules from inside.7 The driving forces for complex formation are van der Waals, hydrophobic or hydrogen bond interactions.9,10
The 2-hydroxypropyl-β-cyclodextrin (HPβCD) is a chemical modified CD, where the group 2-hydroxypropyl replaces hydrogen atoms of the free groups (Figure 2B).3 The HPβCD which is known for its good aqueous solubility and low toxicity11 and the cost is within the range of common surfactants.12
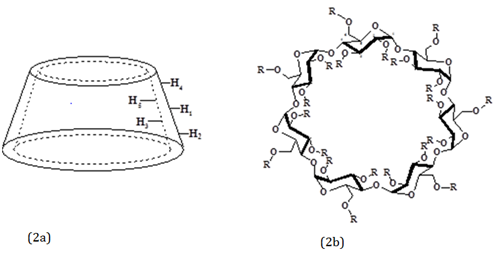
Figure 2 (A) Schematic representation of the truncated cone structure of the CDs. (b): HPβCD (R = CH2CHOHCH3)
There are few reports on the inclusion complex of HA and HPβCD in the scientific literature. Previous studies have discovered that the water solubility of HA can be largely enhanced by complexation with HPβCD.1 In that work the inclusion complex of HA with HPβCD were performed as the following technique; HA and HPβCD (1:1 ratio molar) were dissolved separately in ethanol and purified water, respectively. The solutions were mixed together, sonicated for 15 minutes to produce a clear solution and subjected to spray-drying, achieving 25% inclusion of AH.
The aim of the present work was development a new technique of complexation of HA with HPβCD to increase the inclusion percentage and the solubility of HA molecule. The best correlation of HA inclusion in HPβCD, stoichiometry, apparent stability constant (Ks) and quantification of yield of the freeze-drying inclusion complex were determined. The inclusion complex was analyzed by different analytical techniques including Fourier transform-infrared spectroscopy (FT-IR) and 1H Nuclear magnetic resonance (1H-NMR). Molecular modeling studies were performed to investigate the mode of binding of AH in HPβCD.
Reagents
2-hydroxypropyl-β-cyclodextrin was supplied by Cargill (E.U.A), hydrocortisone acetate standard and deuterated dimethyl sulfoxide (DMSO-d6) were purchase from (Sigma®). All solvents used were of analytical reagent grade.
Apparatus
Analytical balance Mettler-Toledo AG-204, destilator Quimis, pH meter Digimed DME-CV-4, UV-Visible spectrophotometer Shimadzu UV-2401-PC, Fourier Transform Infrared Spectrometer Shimadzu FT-IR-8300, freeze dryer Labconco 603886, thermostatic bath Thornton T14 and spectrometer of nuclear magnetic resonance Bruker-Spectrospin DRX 400MHz.
Preparation of the inclusion complex AH/HPβCD and quantification of the inclusion percentage
In this work, we have prepared an inclusion complex of HA with HPβCD according phases solubility diagram of Higuchi & Connors and a method described by Filipović-Grcić J et al..1\ with minor modifications, changing the solvent ethanol by water and using freeze-drying as a drying technique. Were accurately weighed 50,0mg of HA in a conical flask of 125mL and in each flask was added slowly HPβCD aqueous solution of increasing concentration (20, 50, 70, 75, 80, 85 and 135mM). All samples had the final fixed concentration of HA 2mg/mL. The total volume inside the flasks was 25,0mL. The flasks were sealed and protect from the light with aluminum foil. The mixture was stirred at 37°C under water bath during 1 hour. This time and temperature were determined after the development of other conditions. After, the samples were filtered (Whatman® n°41). Clear solutions were suitably diluted in ethanol with theoretical final concentration of HA 20mg/mL and analyzed by UV-vis spectrophotometry, measuring the absorbance at 241,5 nm wavelength (REF). The percentage of inclusion of HA were determined from a calibration curve of HA standard (y= 0,0405x+0,0256; r= 0,9941). The residue of filtrate with the highest percentage of inclusion of AH in HPβCD was freeze-dried and the resulting powders were directly used for quantification of yield and characterization of the inclusion complex.
Determination of stoichiometry, apparent stability constant and increase of solubility
The stoichiometry of HA/HPβCD complex in solution was determined by the solubility technique. According to Higuchi and Connors’s theory,13 if the saturation concentration of HA versus the concentration of HPβCD in solutions yield a linear relationship this may be attributed to the formation of a 1:1 inclusion complex between HA and HPβCD.8
The apparent stability constant (Ks) of the inclusion complex formed was calculated from the straight-line portion of the phases solubility diagram using the equation (1), where S0 is the AH solubility in the absence of HPβCD (intercept).14
Equation 1: KS = Slope / S0 (1 – slope)
The increased solubility (n) of HA was calculated as the ratio between the maximum solubility of the complex (Smax) and the solubility of HA in the absence of HPβCD (S0).
Quantification of yield and characterization of the freeze-dried inclusion complex
The yield of the freeze-drying inclusion complex was calculated. The inclusion complex of HA/HPBCD was characterized by the following techniques.
Fourier transform infrared spectroscopy (FT-IR)
Fourier transform infrared spectroscopy (FT-IR) spectra of HA, HPβCD, the physical mixture and the inclusion complex were collected from 4000 to 500 cm-1 using KBr disk technique. The samples were ground with spectroscopic grade potassium bromide (KBr) powder during 5 minutes and then pressed into pellets (3 mg of sample per 300 mg dry KBr). A blank disk was used as background.
1H Nuclear magnetic resonance (1H-NMR)
1H Nuclear magnetic resonance (1H-NMR) spectra of the physical mixture and the inclusion complex were dissolved in DMSO-d6 and analyzed at 400 MHz. Chemical shifts were expressed per million.
Molecular modeling studies
Molecular structure of the inclusion complex that showed the higher percentage was established using computational modeling technology HyperChem 7.5 program (Hyperchem 2002) to visually illustrate the formation of AH/HPβCD complex. The HPbCD and HA structures were submitted to the geometry optimization process simulating each molecule in vacuum.15 and without any geometric restriction, using the molecular mechanics forcefield.16 MM+ of the HyperChem program, up to the lower gradient norm at 10-2 kcal mol-1 Å-1. The electrostatic term was calculated using the bond dipoles included in set parameter from the MM+ force field. The inclusion complex was obtained by manually docking of the optimized HPbCD and AH structures and subjected to the same geometry optimization process.
Quantification of inclusion complex
Table 1 show the percentage values of the inclusion of HA in HPbCD determined by UV spectrophotometry. There was an increase in the percentage of inclusion of the AH with the increase of the concentration of HPbCD, reaching the maximum inclusion limit of 91.52±0.92% when using a concentration ratio of 5.75mM of HA and 135mM of HPbCD. This percentage was higher than that obtained by Filipović-Grcić J et al.1 which was 25%.
|
HA (mM) |
HPβCD (mM) |
% Inclusion complex |
|
4,94 |
20 |
18,21±0,82 |
|
5,08 |
50 |
41,72±0,96 |
|
4,94 |
70 |
52,30±1,03 |
|
4,94 |
75 |
56,92±1,54 |
|
4,98 |
80 |
59,24±1,32 |
|
4,94 |
85 |
65,22±0,64 |
|
5,75 |
135 |
91,52±0,92 |
Table 1 Percentage of inclusion of HA in HPCD containing HA at constant concentration and HPβCD at increasing concentration.
Determination of stoichiometry, apparent stability constant and increase of solubility
The stoichiometry of the inclusion complex HA/HPβCD was determined by the solubility technique. As showed in Figure 3, a linear relationship was obtained between the amount of HA solubilized and the increasing of concentration of HPβCD in solution, which was classified as a classic AL-type, suggesting to the formation of inclusion complex in 1:1 molar ratio of HA/HPβCD, in agreement with the previous study from Filipović-Grcić J et al.1. The regression equation was as follows: y= 0,0769 + 0,0359x (r= 0,9979).
The apparent stability constant of the complex in the 1:1 molar ratio KS (1:1) was calculated from the solubility diagram, considering the angular coefficient (slope= 0.0359) and HA solubility in the absence of HPβCD (S0= 0.0769mM). The calculated KS (1:1) was 484M-1, which is within the range considered suitable for the formation of stable inclusion complexes 100-5000M-1.17. The KS (1:1) calculated by Filipović-Grcić J et al..12 was equal to 466M-1. The relation between Smax= 4.9338mM and So= 0.0769mM, demonstrated that the increase of HA solubility was on the order of 64 times.
Quantification of yield and characterization of the freeze-dried inclusion complex
The freeze-dried inclusion complex presented as amorphous white powder. The yield of the inclusion process calculated was 77.4±0.85%.
Characterization of inclusion complex
Fourier transform infrared spectroscopy analysis: FT-IR is a useful technique used to confirm the formation of an inclusion complex.8 The FT-IR spectra of HA (A), HPβCD (B), physical mixture and (C) and inclusion complex (D) are presented in the Figure 4. The FT-IR spectrum of HA showed bands features of HA at 3425, 3cm-1 and 3334,7cm-1, both for O-H stretching vibrations from the hydroxyl groups of the secondary and tertiary alcohols. The bands presented in the region between 3000cm-1 and 2850cm-1 are attributed stretching vibrations from the many types of bonds C-H. At 1745,5cm-1, 1722,3cm-1 and 1629,7cm-1 the bands are stretching vibrations of bonds C=O from carbonyl of acetate, ketone α-hidroxylated and ketone α, β-unsaturated, respectively. At 1232,4cm-1 is corresponding to stretching vibrations of bonds C-O from acetate. The FT-IR spectrum of HPβCD showed bands features at 3386,8cm-1 that may be assign to stretching vibrations of bonds O-H, at 2970,2cm-1 and 2931,6cm-1 due to stretching vibrations of bonds C-H, at 1643,2cm-1 this is referring to the aldehyde carbonyl group of possible open CD units.
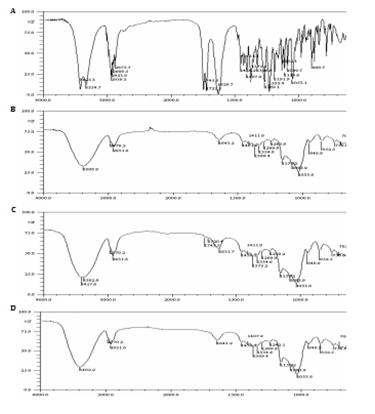
Figure 4 FT-IR spectra of HA (A), HPCD (B), the physical mixture (C) and the freeze-dried HA/HPCD inclusion complex (D).
The FT-IR spectra of physical mixture showed bands features of HA at 3417,6cm-1 (for O-H stretching vibrations) at 1743,5cm-1, 1720,4cm-1 and 1631,7cm-1 (for C=O stretching vibrations), although low in intensity due to high CD concentration are still perceptible in the IV spectrum of the physical mixture. The superposition of absorption spectra of HA and HPβCD was evidenced, indicating the non-inclusion of HA. In the FT-IR spectra of inclusion complex showed no features bands similar to pure HA, the spectrum is very similar to the HP βCD, proving this manner the AH inclusion in the HPβCD cavity.
1H-NMR analysis: The Figure 5 shows the 1H-RMN from HPβCD (A) and from the inclusion complex (B). The numbers 1-5 indicate the hydrogen atom signals: from the methyl groups of HPβCD (1) and solvent DMSO (2), solvent water (3), H-5 (4), H-3 and H -6 from HPβCD (5). Both H-3, H-5 and H-6 protons are located in the inner part of cyclodextrin cavity; H-3 is gravitating towards the wider part of the cone and H-5 towards the narrower part of the cone.18. The 1H-NMR spectrum of HPβCD (A) shows a signal at 3.62ppm from H-5 and the other at 3.78ppm from H-3 and H-6. Inclusion complex (B) shows the H-5 signal noticeably shifted to 3.66ppm and that of H-3 and H-6 shifted to 3.80ppm. In this way, these shifts from the protons were observed for higher frequency values referring to the hydrogen atoms H-3, H-5 and H-6 of the HPβCD, which proves the inclusion of HA in HPβCD.
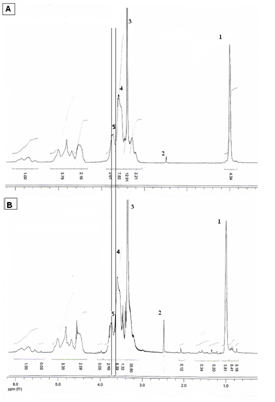
Figure 5 1H-NMR spectra in DMSO-d 6 (solvent) of HPβCD (A) and the freeze-dried HA/HPβCD inclusion complex (B). The numbers 1-5 indicate the signals for the hydrogen atoms of the methyl groups of HPβCD (1), solvent (2), water of solvent (3), H-5 from HPβCD (4), H-3 and H -6 from HPβCD (5).
Molecular modeling studies: A model of the inclusion complex was obtained by manual docking of the HA structure within the cavity of the HPβCD structure and optimization with the MM+ force field of the HyperChem program. In the optimized model the HA structure remains inside the HPβCD cavity, without severe structural deformations.
The conformational changes observed in the HA and HPβCD molecules due to the inclusion process were evaluated by the root mean squares (RMS) from the interatomic distances between all the pairs of atoms of each of the molecules before (optimized structures isolated) and after fitting (optimized complex structure). The RMS shift value for HPβCD is equal to 1.451 Å and for HA is equal to 0.174 Å. In the case of HPβCD the deviation is greater due to the greater conformational freedom of the side chains of the seven hydroxypropyl groups and in the case of HA, the deviation is much lower, as expected, because the structure of the hormone is very rigid.
The Figure 6 is presented in line model as stick and ball from the inclusion complex, where it is possible to observe the HA molecule inserted in the cavity of the HPβCD molecule, and that there is a proximity between the hydrogen atoms H-3,-5 and H-6 of the HPβCD glucose units with the hydrogen atoms of rings B, C and D (Figure 1) of the HA molecule
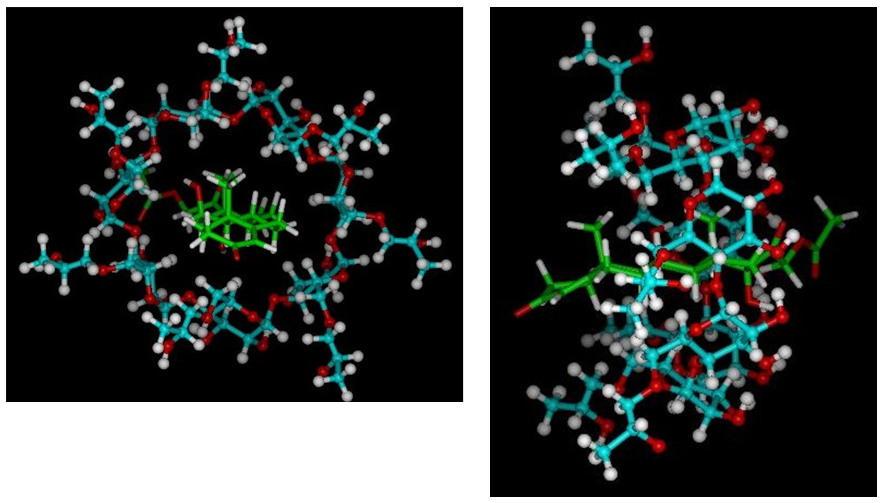
Figure 6 Model of the HA/HPβCD inclusion complex obtained by molecular mechanics in stick and ball view mode (frontal and lateral view).
The types of intermolecular interactions involved in the inclusion process are predominantly van der Waals forces. However, the following interactions were observed by hydrogen bonding: one between the oxygen atom of the carbonyl group of acetate of HA and one of the hydroxyls of one of the glucose rings of the CD that presents distance of 2.91 Å between the respective oxygen atoms and other seven intramolecular interactions, e.g., between hydroxyl groups of adjacent CD glucose rings.
The Figure 7 (frontal and lateral view) again shows the inclusion complex model in opaque van der Waals solid surface visualization mode HP βCD and transparent HA, where it is possible to visualize that the HA completely fills the cavity diameter of the HPβCD (front view), and the part of the HA molecule that is included, corresponds to rings B, C and D and which is not fully included, corresponds to the carbonyl groups of ring A and acyl acetate (lateral vision), which are located precisely at the ends of the molecule.
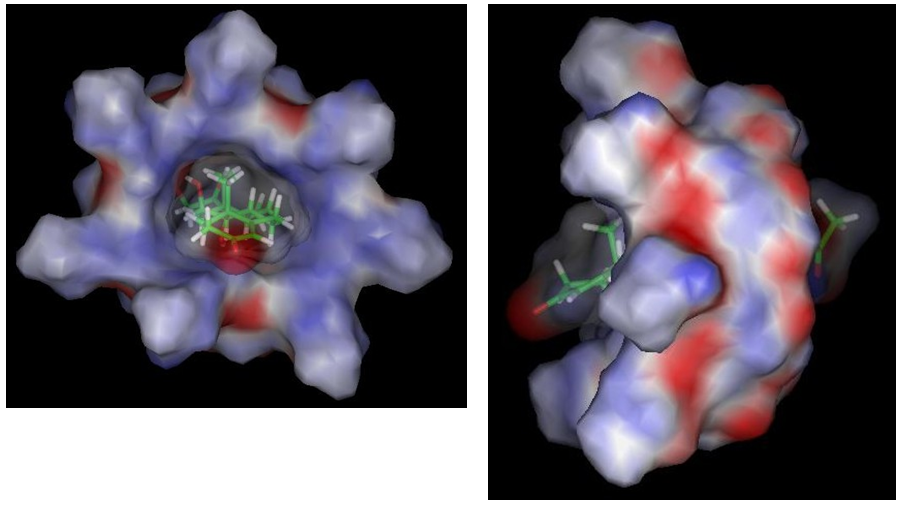
Figure 7 Model of the HA/HPβCD inclusion complex obtained by molecular mechanics in stick and ball view mode (frontal and lateral view).
The development of a new method of inclusion complex of HA with HPβCD allowed the preparation of inclusion complex in a simple and efficient manner. The highest percentage of inclusion (91.52±0.92%) was obtained using 5.75mM HA and 135mM HPβCD, water was used as solvent, stirring for 1 hour at the temperature of 37°C. This percentage of inclusion was higher than that found by Filipović-Grcić J et al.1 that was 25%. The AL-type graph and the slope smaller than one indicated a 1:1 stoichiometry. The calculated apparent stability constant KS= 484M-1 of the complex demonstrates an adequate association between HA and the HPβCD. Results indicated that the solubility property of HA was improved on the order of 64 times by inclusion in the complex HA/HPβCD compared with HA crystalline powder (pure). The data obtained from FT-IR and 1H-NMR characterized that an effective HA/HPβCD inclusion complex was prepared. Here we have demonstrated that freeze-drying process yield was 77,4±0,85%. Additionally, molecular modeling studies of the complex at the molar ratio of 1:1 corroborate the experimental data. In the future, the in-vitro dissolution studies will be performed of the inclusion complexion.
The authors would like to thank Cargill (U.S.A.) for the donation of HPβCD. To the Research Center for Natural Products by freeze-drying and 1H NMR. This research was financially supported by CAPES, CNPq and FAPERJ.
The authors have declared that there is no financial interest or any conflict of interest in the present work.

©2018 Silva, et al. This is an open access article distributed under the terms of the, which permits unrestricted use, distribution, and build upon your work non-commercially.