Journal of
eISSN: 2473-0831


Research Article Volume 7 Issue 3
Department of Pharmaceutical Analytical Chemistry, Al-Azhar University, Egypt
Correspondence: Rady F Abdel-Kareem, Faculty of Pharmacy, Department of Pharmaceutical Analytical Chemistry, Al-Azhar University, 11751, Nasr City, Cairo, Egypt
Received: March 13, 2018 | Published: June 18, 2018
Citation: Nassar MW, Attia KA, Abouserie AA, et al. Comparative study on four UV spectrophotometric methods manipulating ratio spectra for the determination of metoclopramide monohydrochloride monohydrate in presence of its acidic degradate. J Anal Pharm Res. 2018;7(3):344-355. DOI: 10.15406/japlr.2018.07.00250
Four simple, accurate, reproducible and non-sophisticated spectrophotometric methods manipulating ratio spectra were developed and validated for the determination of metoclopramide monohydrochloride monohydrate (MCP) in presence of its acidic degradate without preliminary separation in its pure powder form and tablet formulation. Method I, is constant center spectrophotometric method (CC), method II, is the ratio difference spectrophotometric method (RD), method III, is the first derivative of the ratio spectra (1DD), while method IV, is the mean centering of the ratio spectra (MC). Linearity correlations ranges were 2-24μg mL-1. The mean percentage recoveries were 100.22±0.663 for method I, 98.72±0.492 for method II, 98.61±0.414 for method III and 98.96±0.998 for method IV, respectively. Assessment of the specificity was achieved by analyzing synthetic mixtures containing the studied drug with its acidic degradate. The statistical comparison of the obtained results was made with each other and with those of reported method. The comparison in pure powder form showed that there is no significant difference between the proposed methods and the reported method regarding both accuracy and precision.
Keywords: metoclopramide, stability indicating, constant center, ratio difference, first derivative of the ratio spectra, mean centering
Metoclopramide monohydrochloride monohydrate (MCP) Figure 1, 4-amino-5-chloro-2-methoxy-N-(2-diethylamino-ethyl), monohydrochloride, monohydrate is a dopamine receptor antagonist. It is a substituted benzamide used for its prokinetic and antiemetic properties in disorders of decreased gastrointestinal motility such as gastroparesis and ileus, as well as in gastroesophageal reflux disease, dyspepsia, nausea and vomiting, and for the prevention of cancer therapy-induced emesis.1 It is official in British Pharmacopoeia (2009) and United States Pharmacopoeia (2007) which recommend acid-base titrations with potentiometric end point detection.2,3 The wide use of MCP has prompted the development of several analytical methods for its determination in pharmaceuticals when present alone or in combination with other drugs and include HPLC,4–9 LC–MS,10 NMR spectrometry11 differential scanning calorimetry and X-ray powder diffractometry,12 voltammetry,13,14 potentiometry,15–19 flow-injection chemiluminescence spectrometry,20–23 fluorimetry,24,25 UV-spectrophotometry26–28 and flow-injection spectrophotometry.29–32 Some analytical techniques have also been reported for the determination of MCP in biological matrices and include HPLC,33–36 LC–MS,37 voltammetry,13 potentiometry17 and fluorimetry.24,25 Although the above methods are sensitive, they are time-consuming and complicated and require expensive instrumental set up. Despite the availability of sophisticated and sensitive instruments for the assay of MCP as previous methods, visible spectrophotometric methods should be mentioned here such as those based on redox reactions and using reagents such as sodium vanadate,38 ammonium metavanadate39 and Folin-Ciocalteu40 have been reported. Charge-transfer complex formation reaction using chloranil or bromanil as p acceptors.41 There are two reports based on ion-pair complex formation reaction of MCP with bromothymol blue42 and Mo (V) and Co (II) thiocyanates.43 Condensation reaction with sodium 1,2-naphthoquinone-4-sulfonate to form a orange-red colored product in the presence of borax.44 Methods based on coupling reaction with reagents like 8-anilino-1-naphthalene sulfonic acid, resorcinol and β-naphthol;45 and 1–2 napthoquinone, hydroquinone and resorcinol46 have also been reported. The most widely used reaction for the assay of MCP in pharmaceuticals has been the diazo-coupling reaction and based on this reaction several workers have reported methods using different reagents like imipramine hydrochloride,47 benzoyl acetone,48 sodium nitrite and aniline,49 dibenzoyl methane,50 acetyl acetone,51 chromotropic acid,52 3-a, c-dicarboxypropylrhodanine,53 resorcinol,54 4-aminosalicylic acid55 and sodium nitrite and β-napthol.56 Other color forming reactions such as oxidative coupling of MCP with MBTH and cerium (IV),52 Schiff 's base formation with 4-dimethyl amino-benzaldehyde,56 p-dimethyl amino cinnamaldehyde57 have also been reported. However, most of the reported visible spectrophotometric methods suffer from one or the other disadvantage like poor sensitivity,38,39,41,43–45,51–53,57 drastic experimental conditions like heating,38,39,41,44,49 strict pH control,42,48 liquid-liquid extraction step,42,43 use of organic solvents,42,43,48,50 narrow linear range45,46,54,57 etc. The objective of this investigation was to devise simple, rapid, sensitive and economically UV spectrophotometric methods those could be used to determine MCP in tablets. The proposed methods have been demonstrated to be superior to the reported methods with respect to speed, simplicity, sensitivity, selectivity and cost-effectiveness. The proposed methods have also been optimized and validated as per the International Conference on Harmonization (ICH) guidelines ICH, and were found to comply with the acceptance criteria.58
Instruments
Chemicals and solvents
Pure and market samples
Pure sample: MCP was kindly supplied by Sanofi-aventis Egypt and certified to contain 99.99%. Primperan® tablet with batch number 6EG022 manufactured by Sanofi Aventis Company. Each tablet was labeled to contain 10 mg of MCP hydrochloride.
Standard and stock solutions
Standard solution of MCP: A standard solution of MCP (1000μg mL-1) was prepared by dissolving 100 mg of the drug powder in 50mL of methanol and the volume was completed to 100mL with the same solvent. MCP working solution (100μg mL-1) was obtained by further dilution with methanol.
2.4.2. Standard solution of degraded sample:
Accelerated acid-degradation was performed by dissolving 40 mg of pure MCP powder in 40 mL of 2M hydrochloric acid, then the solution was refluxed for 4 hrs. The solution was neutralized to pH 7.0 by 2M sodium hydroxide and complete degradation was confirmed by TLC using chloroform-methanol (50:50 v/v) as developing system. The neutralized solution was evaporated under vacuum nearly to dryness, then the residue was extracted three times with 25 mL of methanol, filtered into 100-mL volumetric flask then the volume was adjusted to the mark with the same solvent to obtain a solution labeled to contain degradate derived from 40mg mL-1 of MCP. Working solution (100μg mL-1) was prepared by suitable dilution of the stock solution with methanol.
Procedures (construction of the calibration graphs)
Spectral characteristics: The absorption spectra of MCP and its acidic degradate were recorded over the range 200–400nm.
Constant center method (CC): Solutions containing 2-24μg mL-1 MCP were prepared separately in methanol from their working solution (100μg mL-1). The absorption spectra of the resulting solutions were measured and stored in the computer. Construct a calibration curve relating the absorbance of the zero order spectra of MCP at 272.8nm versus the corresponding concentrations, and then the regression equation was computed.
Ratio difference method (RD): Aliquots equivalent to 2-24μg mL-1 MCP, were added separately into a series of 10-mL volumetric flasks and the volume was then completed using methanol. The absorption spectra of the prepared solutions were scanned (200–400nm) and stored in the computer. The stored spectra were divided by the absorption spectra of 10 μg mL-1 metoclopramide degradate, where the obtained ratio spectra were recorded. Construct a calibration curve by plotting the difference between the amplitudes of obtained ratio spectra at 272nm and 312nm against the corresponding concentrations and the regression equation was computed.
Derivative ratio method (1DD): For the determination of MCP in the presence of its acidic degradate, the stored spectra of MCP were divided by the spectrum of 10μg mL-1 metoclopramide degradate, then the first derivative of the ratio spectra (1DD) at Δλ=4nm and scaling factor = 10 are obtained. The amplitude of the first derivative peak was measured at 326.8nm. A calibration graph relating the peak amplitude at 326.8nm to the corresponding concentrations 2-24μg mL-1 of MCP was constructed.
Mean centering: The stored spectra of MCP were divided by the spectrum of 10μg mL-1 metoclopramide degradate and the obtained ratio spectra were mean centered. A calibration curve was constructed by plotting the mean centered values at 313nm versus the corresponding concentrations.
Assay of laboratory prepared mixtures
Constant center method (CC): Into a series of 10-mL volumetric flasks, transfer accurately aliquots equivalent to (220-60) µg and (20µg-180µg) of MCP and metoclopramide degradate respectively from their working solutions (100µg mL-1) and complete to volume with methanol. The spectra of the prepared standard solutions were scanned and stored in the computer. The absorption spectra of different laboratory prepared mixtures were divided by the absorption spectra of 6µgmL-1 standard MCP.The ratio spectra of laboratory prepared mixtures were recorded at (249.6nm and 288.2nm). The postulated amplitudes at these wavelengths were calculated using the corresponding regression equation and the constant values were obtained after subtraction the recorded amplitudes of the mixtures and its postulated amplitudes at the specified wavelength (249.6nm). Multiply the obtained constant values for each mixture by the spectrum of 6µg mL-1 standard MCP, so the original spectra of MCP were obtained. The concentrations of MCP were calculated from the computed regression equation representing the absorbance values of MCP at 272.8nm versus MCP concentrations.
Ratio difference method (RD): The absorption spectra of different laboratory prepared mixtures ((220-40) µg and (20µg-200µg) of MCP and metoclopramide degradate, respectively) were divided by the absorption spectrum of 10μg mL-1 metoclopramide degradate. The amplitude of ratio spectra were recorded at 272nm and 312nm. The concentrations of the drug were calculated from the computed regression equation.
Derivative ratio method (1DD): The absorption spectra of different laboratory prepared mixtures ((220-80) µg and (20µg-160µg) of MCP and metoclopramide degradate, respectively) were divided by the absorption spectrum of 10μg mL-1 metoclopramide degradate. The ratio spectra were obtained then first derivatized. The amplitude values are recorded at 326.8nm. The concentrations of the drug were calculated from the computed regression equation.
Mean centering: The absorption spectra of different laboratory prepared mixtures ((220-40) µg and (20µg - 200µg) of MCP and metoclopramide degradate, respectively) were divided by the absorption spectrum of 10μg mL-1 metoclopramide degradate and then mean centered. The calibration curve is constructed by plotting the mean centered values at 313nm versus the corresponding concentrations. The concentrations of the drug were calculated from the computed regression equation.
Extraction of pharmaceutical sample
Pharmaceutical sample stock solution (1000μg mL-1): Ten Primperan® 10mg tablets were accurately weighed and finely powdered, then a quantity equivalent to 100mg of MCP was extracted three times with 25mL of methanol by mixing well using sonicator and vigorous shaking for 10 minutes then filtered through whatman filter paper No. 41 into 100-mL volumetric flask. Filter paper was washed with methanol, adding washings to the volumetric flask and the volume was made up to the mark with methanol.
Pharmaceutical sample working solution (100 µg mL-1): It was freshly prepared by suitable dilution from its stock solution using methanol as diluent in another 100-mL volumetric flask.
Analysis of pharmaceutical sample: Repeat the general procedure under “2.5” using aliquots covering the working concentration range. Determine MCP content of the tablets from the corresponding regression equations for those methods.
In the present studies, simple and sensitive UV spectrophotometric procedures were suggested for selective quantitative determination of MCP in presence of its acidic degradates without previous separation.
Degradation of MCP
It was confirmed that; MCP was labile to degradation under acidic condition (2M HCl for 4 hrs), two degradation products are produced and are reported in British Pharmacopoeia2 Figure 2 in which degradate 1 is that of interest and has UV absorption but degradate 2 is an aliphatic fragment and does not have any UV absorbance.
Confirmation of degradation product: The degradation process under acidic condition was followed by TLC confirmation test using chloroform: methanol (50:50, v/v) as developing system and UV detection at 254nm. Complete degradation of MCP was confirmed by absence of spot in the region of the degradation product corresponds to the spot of the intact drug. The structure of the isolated acidic degradation product was confirmed also by applying IR and MS spectroscopy, Figure 3, Figure 4, Figure 5 & Figure 6.
The assignment of metoclopramide degradation product was based on comparison of IR spectral data for the separated compound with that of the intact drug. The IR spectrum of the degradation product showed disappearance of peak of 1598.21cm-1 belongs to carbonyl group of amide and peak of 3343.58cm-1 belongs to secondary amine (NHRR`) which are present in the parent compound, and appearance of two broad peaks at 3423.64cm-1 and 3471.55cm-1 belonging to OH-stretch of COOH group, which indicates the breaking of amide linkage and presence of COOH group belongs to degradate 1, Figure 3 & Figure 4. Moreover, the mass spectra of intact MCP and metoclopramide degradate showed a molecular ion peak at m/z 354.01 and 201.82, respectively, Figure 5 & Figure 6. This finding suggests the degradation pathway and indicates the structure of the degradation product of MCP, as illustrated in Figure 2.
Spectral characteristics
The zero-order absorption spectra of MCP and its degradate show a sever overlap, which does not permit direct determination of MCP in presence of its degradate, as shown in Figure 7.
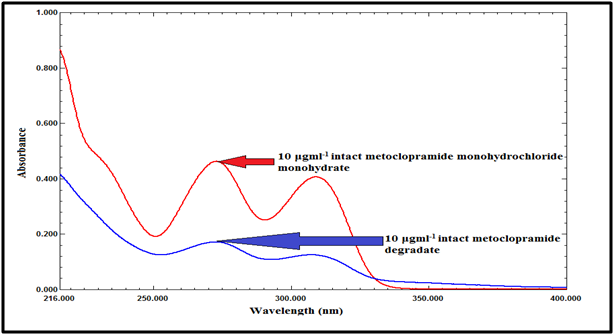
Figure 7 Zero order absorption spectra of intact MCP (10µg mL-1), and its acidic degradate (10µg mL-1).
Constant center method (CC):59 In this method, the absorption spectra of metoclopramide degradate were scanned and divided by the absorption spectrum of 6μg mL-1 of intact MCP as a divisor, and the ratio spectra obtained represent: (metoclopramide degradate/intact MCP)+constant.
The selected divisor should compromise between minimal noise and maximum sensitivity. The divisor concentration 6μg mL-1 of intact MCP gave the best results regarding average recovery percent when used for the analysis of intact MCP concentrations in mixture.
Ratio difference at the two selected wavelengths was represented by: (metoclopramide degradate/intact MCP divisor )λ249.6 -(metoclopramide degradate/intact MCP divisor )λ288.2. The only requirement for the selection of these two wavelengths is the contribution of the two components at these two selected wavelengths (249.6nm, 288.2nm), as shown in Figure 8.
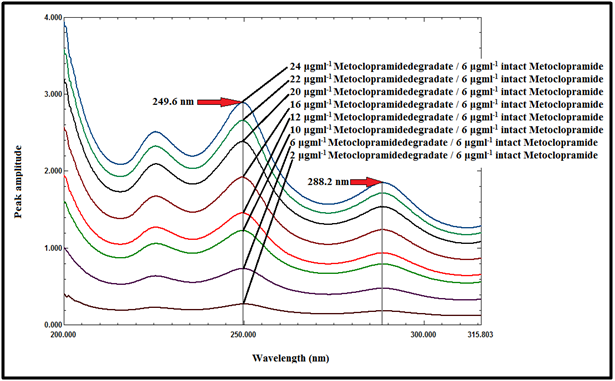
Figure 8 Ratio spectra of metoclopramide degradate at various concentrations (2 - 24μg mL-1) using 6μg mL-1 of intact MCP as a divisor.
The linear relationship between the difference of the ratio spectra at 249.6 and 288.2nm against the amplitude of the ratio spectra at 249.6nm was constructed and the regression equation was computed, which represented by:
P1-P2=0.3600 (metoclopramide degradate/intact MCP divisor)-0.0056 Equation (1)
Where; P1 is the amplitude of the ratio spectra at 249.6nm
P2 is the amplitude of the ratio spectra at 288.2nm
Ppostulated is the amplitude corresponding to (metoclopramide degradate/intact MCP) at 249.6nm.
For the determination of MCP in binary synthetic mixture with its degradate, the zero order spectra of the mixture were scanned and the ratio spectra of the mixture were obtained by using 6µg mL-1 of intact MCP as a divisor. The amplitude of the ratio spectra of the mixture were recorded at 249.6 and 288.2nm and substituted in equation (1) to obtain the postulated value (ppostulated). The constant value representing the amplitude corresponding to ( MCP/ MCP divisor) at 249.6nm can be obtained by subtracting the ppostulated value from the recorded amplitude (Precorded) of the ratio spectra of the laboratory prepared mixture at 249.6nm.
The original spectra of MCP in the mixture could be obtained by multiplying the obtained constant (MCP/MCP divisor) of the laboratory mixture by the spectrum of MCP divisor, as shown in Figure 9. Finally the concentrations of MCP were determined from the regression equation relating the absorbance of the zero order spectra of MCP at 272.8nm to the corresponding concentrations, as shown in Table 1.
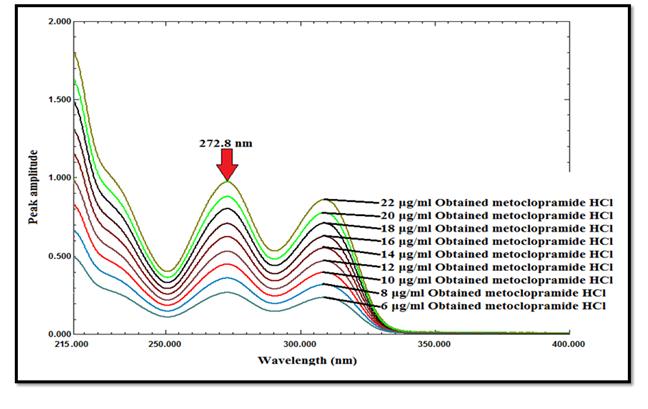
Figure 9 The final spectra of MCP at various concentrations (6-22μg mL-1) after multiplication by the spectrum of 6μg mL-1 of intact MCP.
Parameters |
Constant center method |
Ratio difference method |
Ratio derivative method |
Mean centering method |
λ (nm) |
272.8nm |
312-272nm |
326.8nm |
313nm |
Beer's law |
2-24μg mL-1 |
2-24μg mL-1 |
2-24μg mL-1 |
2-24μg mL-1 |
LOD (μg mL-1) |
0.455 |
0.440 |
0.362 |
0.410 |
LOQ (μgmL-1) |
1.380 |
1.332 |
1.097 |
1.242 |
Regression |
Y=0.0450x-0.0053 |
Y=0.0558x+0.0100 |
Y=0.1969x-0.0712 |
Y=0.1710x-0.0605 |
Correlation |
0.9997 |
0.9997 |
0.9998 |
0.9997 |
Accuracy |
100.22±0.663 |
98.72±0.492 |
98.61±0.414 |
98.96±0.998 |
Precision |
||||
Repeatability |
0.707 |
1.209 |
1.657 |
1.413 |
Intermediate |
0.825 |
1.367 |
1.578 |
1.065 |
Table 1 Linear regression and analytical parameters of the proposed methods for determination of MCP
Optimization of experimental conditions: Constant center spectrophotometric method comprises two critical steps; the first is the choice of the divisor. The selected divisor should compromise between minimal noise and maximum sensitivity. The divisor concentrations of 6μg mL-1 gave the best results. The second critical step is the choice of the wavelengths at which measurements are recorded. Any two wavelengths can be chosen provided that they exhibit different amplitudes in the ratio spectrum and good linearity is present at each wavelength individually. The selected wavelengths are 249.6 and 288.2nm (ΔP 249.6-288.2) which gave the best results.
Ratio difference method (RD):60,61 In this method, the absorption spectra of the drug were divided by the absorption spectrum of the degradate (10µg mL-1), as a divisor, to get the ratio spectra, as shown in Figure 10. The difference in peak amplitudes between 312 and 272nm in the ratio spectra is proportional to the concentration of the drug without interference from its degradate (divisor).
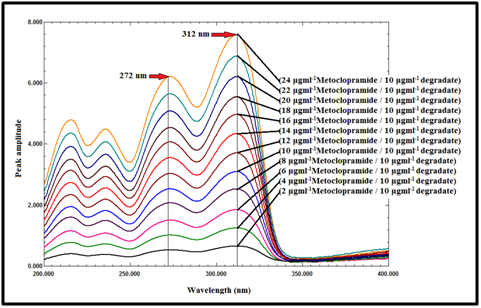
Figure 10 Ratio spectra of MCP at various concentrations (2-24µg mL-1) using 10µg mL-1 of degradate as a divisor.
Derivative ratio spectrophotometric method (1DD):62,63 In this method, the absorption spectra of the drug were divided by the absorption spectrum of the degradate (10µg mL-1), as a divisor, to get the ratio spectra, as shown in Figure 10. The amplitudes of the first derivative of the ratio spectra at 326.8 nm are proportional to the concentrations of the drug without interference from its degradate (divisor), as shown in Figure 11.

Figure 11 First derivative of the ratio spectra of MCP at various concentrations (2-24µg mL-1) using 10µg mL-1 of its degradate as a divisor.
Mean centering (MCN):64,65 In this method, the absorption spectra of MCP were divided by the absorption spectrum of its degradate (10µg mL-1) as a divisor to get the ratio spectra, as shown in Figure 10. The obtained ratio spectra were mean centered using matlab. The mean centered values at 313 nm are proportional to the concentrations of MCP without interference from its degradate, as shown in Figure 12.
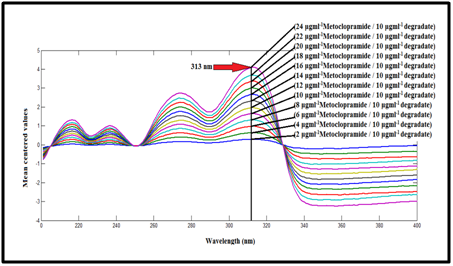
Figure 12 Mean centering of the ratio spectra of MCP at various concentrations (2-24µg mL-1) using 10µg mL-1 of metoclopramide degradate as a divisor.
Optimization of experimental conditions to the last three methods: Careful choice of the divisor concentration was of great importance, so different concentrations of metoclopramide degradate were tried as a divisor (4, 6, 8, 10 and 14μg mL-1); the best one was 10μg mL-1, as it gave better results in accordance with selectivity. The statistical parameters of the regression equations are shown in Table 1. The percentage recoveries suggested good accuracy of the proposed methods.
The proposed methods were successfully applied for the analysis of MCP in pharmaceutical solid dosage form (tablet) and in laboratory prepared mixtures with its degradate, Table 2 & Table 3. Statistical comparison between the results obtained by the proposed methods and those obtained by the reported method showed no significant differences as given in Table 2. In order to compare the ability of the proposed methods for the determination of MCP in tablet dosage form, the results obtained by applying the proposed methods were subjected to statistical analysis using the one way ANOVA test, there was no significant difference between all of the proposed methods, Table 4.
Parameters |
Constant center method |
Ratio difference method |
Ratio derivative method |
Mean centering method |
Reported zero order method** |
Primperan® tabletsª (B.N. 6EG022) |
99.62±1.455 |
99.81±1.015 |
98.54±0.893 |
99.09±1.492 |
99.81±0.979 |
Standard additionb |
100.94±0.691 |
99.42±0.854 |
99.93±0.525 |
100.05±0.367 |
|
F-testc |
2.199(6.388) |
1.075(6.388) |
0.811(6.388) |
2.287(6.388) |
|
Student's |
0.241(2.306) |
0.001(2.306) |
2.158(2.306) |
0.912(2.306) |
Table 2 Determination of the studied drug in the pharmaceutical preparation by the proposed methods and statistical comparison with reported zero order method
aAverage of five determination
bAverage of four determinations.
cThe values in the parenthesis are the corresponding theoretical values at р= 0.05.
**Reported zero order method using the absorbance at 272nm (λmax) for determination of MCP in pure form and solid pharmaceutical dosage form (tablet).
Intact |
Degradate |
Degradate % |
Found recovery % |
|||
Constant center method |
Ratio difference method |
Ratio derivative method |
Mean centering method |
|||
22 |
2 |
8.33 |
98.92 |
100.77 |
99.96 |
99.11 |
20 |
4 |
16.67 |
98.37 |
100.72 |
98.86 |
98.44 |
18 |
6 |
25.00 |
99.79 |
98.47 |
98.73 |
98.61 |
16 |
8 |
33.33 |
99.07 |
98.12 |
99.64 |
99.54 |
14 |
10 |
41.67 |
99.89 |
99.72 |
101.76 |
101.21 |
12 |
12 |
50.00 |
99.13 |
98.42 |
99.34 |
98.90 |
10 |
14 |
58.33 |
100.73 |
99.28 |
100.87 |
99.95 |
8 |
16 |
66.67 |
101.19 |
99.46 |
100.19 |
100.80 |
6 |
18 |
75.00 |
100.48 |
99.16 |
ـــــــــــــــــــــــ |
100.82 |
4 |
20 |
83.33 |
ـــــــــــــــــــــــ |
99.01 |
ـــــــــــــــــــــــ |
99.66 |
Mean±RSD% |
|
99.73±0.942 |
99.31±0.909 |
99.92±1.024 |
99.70±0.980 |
|
Table 3 Determination of the studied drug in the laboratory prepared mixtures by the proposed spectrophotometric methods
Source of variation |
Sum of squares |
Degree of freedom |
Mean of squares |
F** |
Between groups |
6.090 |
4 |
1.522 |
1.081 |
Within groups |
28.175 |
20 |
1.409 |
Table 4 One-way ANOVA test for the different proposed spectrophotometric methods used for the determination of MCP in primperan® tablets
**The value in parenthesis is the critical value of “F” at (P=0.05)
In this work smart and simple recently developed spectrophotometric methods were applied for the analysis of MCP . The proposed methods were simple, sensitive, precise, do not need a special program and could be easily applied in quality control laboratories as they are having equal accuracy and precision compared to the reported method. They are also suitable and valid for application in laboratories lacking liquid chromatographic instruments.
I hope to thank my teachers and my staff at pharmaceutical analytical chemistry department, Al-Azhar University, Nasr city, Cairo, Egypt in helping me at everything.
There author declares that there is no conflict of interest.

©2018 Nassar, et al. This is an open access article distributed under the terms of the, which permits unrestricted use, distribution, and build upon your work non-commercially.