Journal of
eISSN: 2473-0831


Short Communication Volume 3 Issue 1
Correspondence: Ashraf Abdel-Fattah, Department of Pharmaceutical analytical Chemistry, Al- Azhar University, Faculty of Pharmacy, Cairo, Egypt, Tel 2.01009E+11
Received: July 23, 2016 | Published: August 23, 2016
Citation: Attia KAM, Nassar MWI, Abdel-Fattah A (2016) Bivariate and Multivariate Spectrophotometric Methods for Determination of Ezetimibe with Kinetic Study of Its Alkaline Degradation. J Anal Pharm Res 3(1): 00042. DOI: 10.15406/japlr.2016.03.00042
The first study concerned with the determination of ezetimibe EZE in presence of its alkaline degradation product were developed and validated using different chemometric techniques [bivariate, classical least square (CLS), and principle component regression (PCR), partial least square (PLS)], with kinetic study and calculation of half-life time and activation energy which essential for quality control of its product. Application of the suggested techniques were successfully applied in synthetic mixture and in pharmaceutical preparations, the results obtained by the proposed techniques were statistically comparable with those obtained by the reported method. All the proposed techniques were validated according to international conference on harmonization (ICH) guidelines.
Keywords: Ezetimibe; Kinetic study; Bivariate, Classical least square; Principle component regression; Partial least square
CLS, classical least square; PCR, principle component regression; PLS, partial least square; ICH, International conference on harmonization; EZE, ezetimibe
Ezetimibe (EZE), a selective inhibitor of intestinal cholesterol and related phytosterol absorption, is designated as1-(4-fluorophenyl)-3(R)-[3-(4-fluorophenyl)-3(S)-hydroxypropyl]-4(S)-(4-hydroxyphenyl) -2-azetidinone Figure 1, It blocks the intestinal absorption of dietary and biliary cholesterol, without affecting the uptake of triglycerides or fat soluble vitamins, this reduce the overall delivery of cholesterol to the liver, thereby promoting the synthesis of LDL receptors and a subsequent reduction in serum LDL-C.1–7 The literature is enriched with several techniques for determination of (EZE) in pharmaceutical dosage forms and/or biological fluids, including HPLC methods for the determination of ezetimibe are reported,8–32 TLC,15,18,32–37 LC,38–45 chemometry,32,46 Spectrophotometric methods,13,30,31,47–68 UPLC,69,70 densitometry,54,71 electrokinetic chromatography,72 electrophoresis,73 voltammetry,74 spectrofluorometry,75 other related with degradation and elucidation of alkaline degradate of ezetimibe.76–78
The aim of this work is to develop a simple, economic, rapid, sensitive, accurate and validated stability indicating methods for determination of (EZE) in presence of its alkaline degradate without sophisticated instruments or any pretreatment steps for the quality control of EZE in pharmaceutical preparations.
Theory of bivariate method79
The principle of bivariate calibration is the measurement of two components (A and B) at two selected wavelengths (λ1 and λ2) to obtain two equations:
AAB1 = mA1CA + mB1CB + eAB1 (1)
AAB2 = mA2CA + mB2CB + eAB2 (2)
The resolution of such equations set allows the evaluation of CA and CB values:
CA = (AAB1 - eAB1- mB1CB) / mA1 (3)
CB = [mA2 (AAB1 - eAB1) + mA1 (eAB2 - AAB2)] / mA2mB1 - mA1mB2 (4)
Where:
According to Kaiser method, the slope values of the linear regression equations for both components at different wavelengths were used to calculate the sensitivity matrices (M) to find out the optimum pair of wavelengths (highest matrix value) at which the binary mixture was determined.
Instruments
Materials
Pure standard: Ezetimibe was kindly provided by E.I.P.I.Co Company, Cairo, Egypt, with purity of 99.9%.
Pharmaceutical dosage form: Zetamibe® tablet: manufactured by Adwia; labeled to contain 10 mg of ezetimibe per tablet, (Batch No. 133822).
Zetajon® tablet: Manufactured by MUP (medical union pharmaceuticals); labeled to contain 10 mg of ezetimibe per tablet, (Batch No. 1501189).
Chemical and reagent:
Standard solution
Stock solution of 1mg/mL for (EZE) was prepared by dissolving 100 mg of (EZE) in 100 ml pure. Different sets of working solution at various concentrations were prepared by appropriate dilution of the stock solution.
Kinetic study
Two sets of working standard solutions of ezetimibe (4.88 x 10⁻⁴ and 1.47 x 10⁻⁴mol/L) were prepared by dissolving in 10ml methanol into 100-ml volumetric flask and diluting to the mark with 0.1M NaOH.
Alkaline degradation of EZE77
100mg of EZE was dissolved in 50mL (0.1M methanolic sodium hydroxide); the solution was refluxed at 80ºC for 30minutes. The time required for complete degradation was followed by spotting on TLC plates at 10minutes intervals for 30minutes. The plates was developed using ethyl acetate: n-hexane (2:1, v/v), which indicate complete degradation with clear separation. After completion, the solution was cooled to room temperature then neutralize with 1M hydrochloric acid. The neutralized solution was filtered. Then evaporate the solution under vacuum till dryness, the residue was dissolved by pure methanol and filtered (several times), evaporate the filtrate using Rota-vapor under vacuum, the residue was dissolved in 100 ml methanol to give degradate stock solution of (1mg/mL).
Procedures
Construction of calibration curve for bivariate
Different aliquots equivalent to (20-200µg) of both ezetimibe and its degradate were accurately transferred from their standard solutions (100 µg/ ml) into two separate series of 10 ml volumetric flasks and completed to volume with methanol. The absorption spectra (from 200 to 400nm) of these solutions were recorded using methanol as a blank. The regressions equations at 232 and 247nm for ezetimibe and its alkaline degradate were computed.
Experimental design of chemometric models80
Zissis et al.81 constructed multilevel multifactor experimental design was applied for the construction of the calibration and validation sets. Five-levels, two factors experimental design was used in which 0.8, 0.9, 1, 1.1 or 1.2ml aliquots of both intact and degraded form of ezetimibe standard solutions were combined and diluted to 10-ml volumetric flask with methanol. The concentrations details are given in Table 1. The absorption spectra of the prepared mixtures were recorded over the wavelength range 205-300 nm with 1nm interval thus the produced spectral data matrix has 25 rows representing different samples and 96 columns representing wavelengths (25 x 96). For construction of the models, to build the CLS and PCR models, feed the computer with the absorbance and concentration matrices for the training set, use the training set absorbance and concentration matrices using MATLAB version R2013b (8.2.0.701), with PLS-Toolbox 2.1.Software for the calculations. The concentrations were calculated from the corresponding regression equations.
|
No. of Mix |
Intact (μg/ml) |
Degraded (μg/ml) |
|
1 |
10 |
10 |
|
2 |
10 |
8 |
|
3 |
8 |
8 |
|
4 |
8 |
12 |
|
5 |
12 |
9 |
|
6 |
9 |
12 |
|
7 |
12 |
10 |
|
8 |
10 |
9 |
|
9 |
9 |
9 |
|
10 |
9 |
11 |
|
11 |
11 |
12 |
|
12 |
12 |
11 |
|
13 |
11 |
10 |
|
14 |
10 |
12 |
|
15 |
12 |
12 |
|
16 |
12 |
8 |
|
17 |
8 |
11 |
|
18 |
11 |
8 |
|
19 |
8 |
10 |
|
20 |
10 |
11 |
|
21 |
11 |
11 |
|
22 |
11 |
9 |
|
23 |
9 |
8 |
|
24 |
8 |
9 |
|
25 |
9 |
10 |
Table 1 Experimental design of concentrations of intact ezetimibe and its alkaline degradate mixtures used in chemometric methods
The shaded rows represent the calibration set.
Kinetic study
Effect of time on the reaction: Two sets of standard solution of ezetimibe (4.88x10⁻⁴ and 1.47x10⁻⁴mol/L) were prepared in 0.1M methanolic NaOH and refluxed as rapidly as possible at 80ºC and 0.1ml from the refluxed solutions was quantitatively transferred into 10ml volumetric flask for 30minutes at 10minutes interval. The flasks were completed to volume with methanol and measured by applying in the previously described bivariate method for the determination of the remaining intact ezetimibe from its corresponding regression equation.
Effect of sodium hydroxide concentration on the reaction: The mentioned procedure was followed using 0.05 and 0.1M methanolic NaOH in the degradation of 4.88 x 10⁻⁴mol/L of ezetimibe.
Effect of temperature on the reaction: The mentioned procedure was followed using series of volumetric flask containing standard solution of ezetimibe (4.88 x 10⁻⁴ mol/L), were prepared in 0.1M methanolic NaOH and refluxed as rapidly as possible and refluxed at different temperature till 80ºC with 10ºC interval for 30 minutes and then 0.1 ml from the refluxed solutions was quantitatively transferred into 10ml volumetric flask. The flasks were completed to volume with methanol and measured by applying in the previously described bivariate method for the determination of the remaining intact ezetimibe from its corresponding regression equation.82
Activation energy
The same procedure under 7.3.3. Effect of temperature on the reaction was repeated using concentration of EZE (1.47 x 10⁻⁴mol/L) only and two different temperatures (30º and 80ºC).
Specificity (Laboratory prepared mixture)
The procedure related to bivariate method was applied using aliquots of ezetimibe solution (100μg/ml) containing (180-40µg) and aliquots of its alkaline degradation product solution (100μg/ml) of (20-160µg). Ezetimibe concentrations were calculated using equation (3).
Application of pharmaceutical formulation
Ten tablets of each of zetamibe® tablet and Zetajon® tablet were accurately weighed, crushed and mixed well. An amount equivalent to 10 mg of ezetimibe was weighed and transferred into two separate 100ml volumetric flask. To ensure complete extraction of drug, it was sonicated for 15minutes in 10ml of methanol and filtered into 100ml volumetric flask, then complete to the volume with methanol to obtain a solution labeled to contain 100μg/ml of ezetimibe.
An ideal stability indicating method is that quantifies the pure drug alone and also resolves its degradation product. It was found that the complete degradation of ezetimibe proceeds optimally in alkaline media and at elevated temperature, and then severe overlapping between ezetimibe and its alkaline degradation product Figure 2 can be resolved by using analytical techniques of great utility for extracting both qualitative and quantitative determination using zero-order absorption spectra.
The structure of the alkaline degradate was elucidated and confirmed by using 1H NMR technique where, The 1H NMR of intact ezetimibe Figure 3, showed a characteristic proton of aliphatic (OH) at 4.86ppm, aromatic (OH) at 9.40ppm and aliphatic proton (CH2) at 1.75 ppm. While, 1H NMR of degradate Figure 4, showed disappearance of aliphatic (OH) at 4.86ppm and appearance of characteristic proton of (CO-NH) at 9.98ppm and aromatic OH still present at 9.06ppm.
So, we can conclude that ezetimibe undergo recyclization77 under the alkaline condition with elevated temperature as shown below.
Optimization of the experimental condition
Bivariate method: In order to apply the bivariate method in the resolution and determination of ezetimibe from its alkaline degradate in their binary mixture. This method is based on a simple mathematic algorithm, in which the data used derives from seven linear regression calibration equations at different selected wavelengths in the region of overlapping; 222, 227, 232, 237, 242, 247 and 252nm. The calibration graph equations and their respective linear regression coefficients were obtained directly with the aim of ensuring that; there was a linear relationship between the absorbance and the corresponding concentration, so the rate of the reaction was found to be dependent on the drug concentration. All of the calibration graphs at the selected wavelengths showed a satisfactory linear regression coefficient (r2 ≥ 0.9998).
According to Kaiser Method,83 the slope values of the linear regression equations for both drugs at the selected wavelengths were used to calculate the sensitivity matrices (K) to find out the optimum pair of wavelengths which assured the best sensitivity for the quantitative determination of EZE. It was found that; the slopes at 232 and 247 nm gave the maximum value of (K) as shown in Table 2 and thus the two selected wavelengths had been chosen for the analysis.
|
λ/λ |
252 |
247 |
242 |
237 |
232 |
227 |
222 |
|
252 |
0 |
958.72 |
-117.64 |
-402.26 |
42.86 |
-447.92 |
-172.44 |
|
247 |
0 |
-1168.46 |
-1133.15 |
-1595.39 |
-1469.96 |
-1031.78 |
|
|
242 |
0 |
-294.5 |
191.28 |
-365.54 |
-83.56 |
||
|
237 |
0 |
546.77 |
-128.61 |
145.96 |
|||
|
232 |
0 |
-595.13 |
-249.94 |
||||
|
227 |
0 |
217.66 |
|||||
|
222 |
|
|
|
|
|
|
0 |
Table 2 Application of the Kaiser's method for the selection of the wavelength set for the determination of ezetimibe
The linear regression equations for the graphs at 232 and 247 nm were found to be:
Y232 = 0.0526 x - 0.0037 (r2 = 0.9999).
Y247 = 0.0429 x - 0.0034 (r2 = 0.9999).
Y232 = 0.0155 x - 0.0002 (r2 = 0.9999).
Y247 = 0.0233 x + 0.0003 (r2 = 0.9998).
Where, y is the absorbance, x is the drug concentration in µg/ml and r2 is the squared correlation coefficient.
Linearity ranges, regression equations, intercepts, slopes and squared correlation coefficients for the calibration data were presented in Table 3. The results of accuracy, repeatability and intermediate precision of the method were presented in Table 4.
|
Parameters |
Bivariate method |
|
|
Wavelength (nm) |
232 |
247 |
|
Linearity range (μg/ml) |
20-Feb |
20-Feb |
|
LOD (μg/ml) |
0.107 |
0.108 |
|
LOQ (μg/ml) |
0.323 |
0.326 |
|
- Regression Equations |
y*= 0.0526 x**- 0.0037 |
|
|
- Slope (b) ± S.D |
0.0526 ± 0.0083 |
|
|
- Intercept (a) ± S.D |
-0.0037 ± 0.0017 |
y*= 0.0429 x**- 0.0034 |
|
0.0429 ± 0.0042 |
||
|
-0.0034 ± 0.0014 |
||
|
correlation coefficient (r) |
0.9999 |
0.9999 |
Table 3 Parameters for determination of ezetimibe by the proposed bivariate method
y* is the absorbance.
x** is concentration in g/ml
|
Conc. (μg/ml) |
Repeatability |
Intermediate precision |
||||
|
Found |
Accuracy |
Precision (RSD %) |
Found |
Accuracy (R %) |
Precision (RSD %) |
|
|
Conc.*± SD |
(R %) |
Conc.* ± SD |
||||
|
10 |
9.99±0.098 |
99.9 |
0.986 |
10.04±0.050 |
100.37 |
0.501 |
|
14 |
13.99±0.104 |
99.95 |
0.744 |
14.04±0.099 |
100.31 |
0.703 |
|
18 |
18.02±0.078 |
100.09 |
0.431 |
17.96±0.076 |
99.76 |
0.425 |
Table 4 Repeatability and intermediate precision for determination of ezetimibe by the proposedbivariate method
The analysis of laboratory prepared mixture of EZE and its alkaline degradate in different ratio was applied and presented in Table 5, EZE could be determined in presence of up to 80% of degradate with mean percentage recovery 99.95 ± 0.699.
|
Intact (μg/ml) |
Degradate (μg/ml) |
Degradate % |
Intact found (μg/ml) |
Recovery % of Intact |
|
18 |
2 |
10 |
17.98 |
99.89 |
|
16 |
4 |
20 |
16.05 |
100.31 |
|
14 |
6 |
40 |
14.01 |
100.07 |
|
12 |
8 |
50 |
11.94 |
99.5 |
|
10 |
10 |
60 |
9.91 |
99.1 |
|
8 |
12 |
70 |
8.1 |
101.25 |
|
4 |
16 |
80 |
3.98 |
99.53 |
|
2 |
18 |
90 |
1.89 |
94.5a |
|
Mean ± RSD% |
|
|
|
99.95 ± 0.699 |
Table 5 Determination of ezetimibe in presence of its alkaline degradates in laboratory mixtures by the proposed bivariate method
aRejected value.
The validity of the method was assessed by adopting standard addition technique, which illustrate accurate results without any interference from the excipient as presented in Table 6 & Table 7.
|
Zetamibe® tablet |
Pharmaceutical taken (µg/ml) |
Pure added (µg /ml) |
Pure found b (µg/ml) |
Recovery % |
|
(Batch No. 133822) |
||||
|
Recovery % a ±S.D |
||||
|
99.73 ± 0.439 |
2 |
2 |
1.96 |
98.15 |
|
6 |
6.02 |
100.33 |
||
|
14 |
13.92 |
99.43 |
||
|
16 |
15.86 |
99.13 |
||
|
|
|
Mean±RSD% |
99.26 ± 0.907 |
Table 6 Quantitative determination of ezetimibe in zetamibe® tablets by the proposed bivariate method and application of standard addition technique
aAverage of six experiments.
bAverage of three experiments.
|
Zetajon® tablet |
Pharmaceutical taken (µg/ml) |
Pure added (μg/ml) |
Pure foundb (µg/ml) |
Recovery % |
|
(Batch No. 1501189) |
||||
|
Recovery % a ±S.D |
||||
|
100.33 ± 0.768 |
2 |
2 |
1.97 |
98.5 |
|
6 |
6.11 |
101.83 |
||
|
14 |
13.87 |
99.07 |
||
|
16 |
15.89 |
99.31 |
||
|
|
|
Mean±RSD% |
99.68 ± 1.481 |
Table 7 Quantitative determination of ezetimibe in zetajon® tablets by the proposed bivariate method and application of standard addition technique
aAverage of six experiments.
bAverage of three experiments.
Kinetic investigation: Bivariate method was used to determine the order of the alkaline degradation rate, the rate of the reaction was found to be dependent on the drug concentration which means that the rate increases as the studied drugs concentration increases, indicating that the reaction rates obeys the following equation:
Rate = k’ [drug]n and then,
log (rate) = log k’ + n log [drug].
Where, k’ is the constant rate and n is the order of the reaction.
The extent of complete degradation depends on the alkalinity, temperature and time; therefore the effects of these variables were studied. Two different concentrations of ezetimibe (4.88 x 10⁻⁴ and 1.47 x 10⁻⁴ mol/L) were used for the study of the effect of time by following the decrease in the concentration of EZE within 30minutes at10minutes interval with constant temperature at 80ºC, Figure 5 is plot of log of the remaining concentrations versus time.
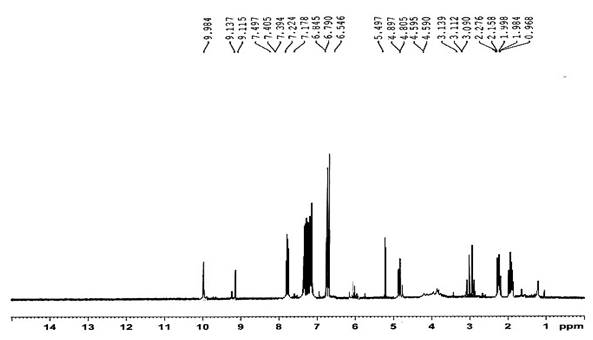
Figure 5 Kinetic plots of the alkaline degradation for 4.88x10⁻⁴mol/L and 1.47x10⁻⁴mol/L of ezetimibe using 0.1M NaOH.
These obtained curves show that the obtained slope (S) was nearly the same and the linear relationship obtained indicates that the reaction follows first order kinetic and related to bimolecular reaction since the water considered as a reactant but present in large excess, so the change in concentration is negligible. Such reaction is considered to follow pseudo-first order kinetic with applying all equations which describing first order kinetic reaction.
The rate of the degradation (k) was calculated from the equation S = -k/2.303 and t1/2 was calculated from the equation t1/2= ln2 / k = 0.693 [84], and the results are presented in Table 8.
|
Concentration(mol/L) |
k |
t1/2 (Minute) |
Regression equation |
|
4.88x10⁻⁴ |
0.0379 |
18.28 |
Y= -0.0165x - 3.1886 |
|
1.47x10⁻⁴ |
0.0375 |
18.48 |
Y= -0.0163x - 3.8286 |
Table 8 Kinetic data of ezetimibe alkaline degradation
Y is log concentration
X is the time
The study of the effect of NaOH concentration on the reaction rate Figure 6 shows that the reaction rate was increased by rising sodium hydroxide concentration.
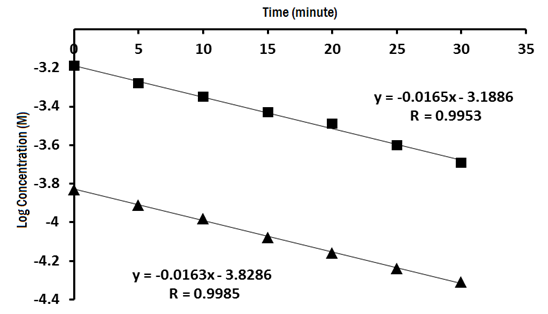
Figure 6 plot for the effect of sodium hydroxide concentration on the reaction rate of degradation of 4.88 x 10⁻⁴mol/L.
Calculation of activation energy85: Figure 7 shows that temperature was essential for complete degradation. So calculation of activation energy (Ea) is very important to determine the minimum energy required for initiating the reaction. The data obtained from the Figure 7 which presented in Table 9, could be used to calculate Eaby substituting in the following equation:
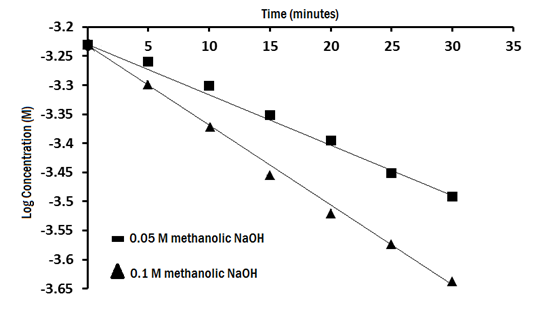
Figure 7 Plot for the effect of temperature (30º C and 80º C) on the reaction rate of degradation of (1.47x10⁻⁴mol/L) of ezetimibe.
|
At temperature of 30ºC |
At temperature of 80ºC |
Activation Energy (Ea) (kj/mol) |
||
|
T1(Kelvin) |
303.15 |
T2(Kelvin) |
353.15 |
|
|
K1 |
0.0152 |
K2 |
0.0375 |
16.07 |
|
Regression equation |
Y=-0.0066x - 3.8218 |
Regression equation |
Y= -0.0163x - 3.8286 |
|
Table 9 Data for activation energy calculation
Log k1/k2 = Ea/ (2.303 R) x [(T2-T1) / (T1T2)] (6)
This equation was derived from Arrhenius equation k = Ae-Ea/RT
Where, k is rate of the reaction, A is pre-exponential, e-Ea/T is Boltzmann’s factor, Ea is activation energy, T is temperature in kelvin and R is universal gas constant.
Chemometric models (CLS, PCR, PLS): Various criteria have been developed to select the optimum number for calibration and validation sets. Thirteen samples (odd numbers of samples) were chosen and used for calibration set and twelve (even numbers of samples) were used for external validation.
For the CLS method, the training set was used for constructing CLS model or (K) matrix (i.e. absorptivity at different wavelengths) but poor predictions were obtained. The results were greatly improved by using the CLS model with nonzero intercept.
The predicted concentrations were compared with the known concentrations of the compounds in each calibration sample. The root mean squares error of cross-validation (RMSECV) was calculated for each method for examining the errors in the predicted concentrations. The optimum number of factors was selected by following the criterion of Haal and and Thomas.86 The selected model was that with the smallest number of factors such that RMSECV for that model was not significantly greater than RMSECV from the model with additional factor. A number of factors were found to be optimum for the mixture of ezetimibe and the degradation product using PCR and PLS as shown in Figure 8 & Figure 9.
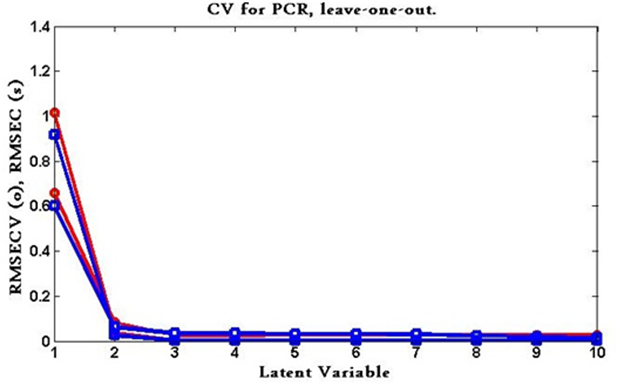
Figure 8 RMSECV plot of the cross validation results of the calibration set as a function of the number of latent variables (LVs) used to construct the PCR model.
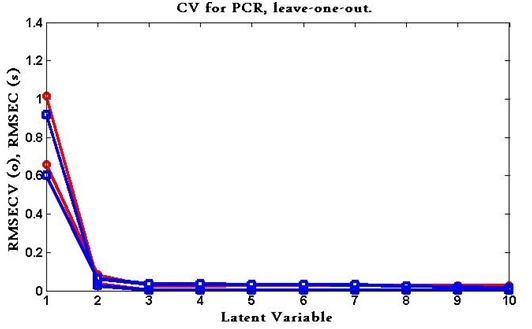
Figure 9 RMSECV plot of the cross validation results of the calibration set as a function of the number of latent variables (LVs) used to construct the PLS model.
Recoveries, mean, standard deviation, RMSEC, RMSEP and other validation parameters for ezetimibe in both models were shown in Table 10 & Table 11.
|
Calibration mixture |
CLS |
PCR |
PLS |
||
|
Ezetimibe |
Degradate |
Ezetimibe |
Degradate |
Ezetimibe |
|
|
1 |
99.79 |
99.9 |
99.79 |
99.9 |
99.8 |
|
2 |
98.35 |
99.65 |
98.47 |
99.73 |
98.36 |
|
3 |
99.71 |
99.81 |
99.69 |
99.8 |
99.7 |
|
4 |
100.33 |
100.09 |
100.31 |
100.88 |
100.32 |
|
5 |
100.85 |
100.5 |
100.85 |
100.49 |
100.83 |
|
6 |
100.1 |
99.96 |
100.11 |
99.79 |
100.11 |
|
7 |
99.81 |
100.06 |
99.81 |
100.47 |
99.82 |
|
8 |
100.44 |
99.89 |
100.68 |
99.72 |
100.45 |
|
9 |
99.67 |
99.88 |
99.69 |
99.7 |
99.7 |
|
10 |
100.18 |
100.24 |
100.2 |
100.34 |
100.19 |
|
11 |
99.79 |
99.9 |
99.79 |
99.9 |
99.79 |
|
12 |
100.25 |
100.35 |
100.24 |
100.34 |
100.23 |
|
13 |
100.18 |
99.96 |
100.19 |
99.96 |
100.21 |
|
Mean±%SD |
99.96+0.591 |
100.01+0.233 |
99.99+0.585 |
100.08+0.380 |
99.96+0.584 |
|
RMSEC |
0.05 |
0.02 |
0.051 |
0.037 |
0.049 |
Table 10 Recovery study of ezetimibe and its degradation product in the calibration set by CLS, PCR and PLS methods
|
Validation mixture |
CLS |
|
PCR |
|
PLS |
|
Ezetimibe |
Degradate |
Ezetimibe |
Degradate |
Ezetimibe |
|
|
1 |
99.85 |
100.27 |
99.84 |
100.27 |
99.83 |
|
2 |
101.3 |
100.38 |
101.34 |
100.38 |
101.31 |
|
3 |
101.38 |
100.24 |
101.18 |
100.24 |
101.39 |
|
4 |
99.44 |
99.83 |
99.43 |
99.83 |
99.54 |
|
5 |
101.21 |
100.3 |
101.15 |
100.3 |
101.2 |
|
6 |
100.46 |
100.03 |
100.45 |
100.03 |
100.45 |
|
7 |
100.68 |
100.09 |
100.4 |
100.09 |
100.69 |
|
8 |
99.9 |
100.1 |
99.88 |
100.1 |
99.87 |
|
9 |
98.66 |
99.53 |
98.64 |
99.65 |
98.7 |
|
10 |
100.33 |
100.06 |
100.33 |
100.06 |
100.36 |
|
11 |
99.67 |
100.12 |
99.66 |
100.12 |
99.65 |
|
12 |
98.79 |
99.74 |
98.79 |
99.74 |
98.81 |
|
Mean±%SD |
100.14±0.919 |
100.06±0.250 |
100.09±0.888 |
100.07±0.225 |
100.15±0.910 |
|
RMSEP |
0.083 |
0.024 |
0.08 |
0.023 |
0.082 |
Table 11 Recovery study of ezetimibe and its degradation product in the validation set by CLS, PCR and PLS methods
Table 12 & Table 13 show statistical comparison of the results obtained by the proposed methods and the reported spectrophotometric method.87 There is no significant difference between the proposed methods and the reported method related to accuracy and precision as the calculated t and F values are less than the theoretical ones and the comparison related to one way ANOVA which applied for each zetamibe® and zetajon® tablets.
|
Parameters |
Bivariate |
CLS |
PCR |
PLS |
Reported method[86] |
|
N* |
5 |
5 |
5 |
5 |
5 |
|
X‾** |
100.02 |
100.21 |
99.95 |
99.99 |
100.17 |
|
SD |
0.683 |
0.458 |
0.652 |
0.487 |
0.46 |
|
RSD% |
0.683 |
0.457 |
0.653 |
0.487 |
0.459 |
|
Student’s t-test*** |
0.407 |
0.413 |
0.609 |
0.614 |
- |
|
-2.306 |
-2.306 |
-2.306 |
-2.306 |
||
|
F*** |
2.204 |
1.009 |
2.008 |
1.121 |
- |
|
|
-6.388 |
-6.388 |
-6.388 |
-6.388 |
|
Table 12 Statistical comparison of the results obtained by the proposed method and the reported method
*Number of experiments.
**The mean of percent recovery of pharmaceutical preparation.
***The values in parenthesis are tabulated values of “t “and “F” at (P = 0.05).
|
Zetamibe® tablet |
||||
|
Source of variation |
Sum of squares |
Degree of freedom |
Mean of squares |
F** |
|
Between groups |
1.148 |
4 |
0.462 |
1.214 |
|
Within groups |
5.704 |
15 |
0.38 |
-3.055 |
|
Zetajon® Tablet |
||||
|
Between groups |
0.813 |
4 |
0.203 |
0.347 |
|
Within groups |
8.786 |
15 |
0.586 |
-3.056 |
Table 13 One-way ANOVA test for the proposed methods used for the determination of ezetimibe in presence of alkaline degradate in bothzetamibe® zetajon® tablets.
**The value in parenthesis is the critical value of “F” at (P = 0.05).
It’s the first time to develop spectrophotometric methods concerned with determination of ezetimibe in presence of its alkaline degradation product. The previous work deals with degradation ezetimibe and confirmation of the structure of degradate only.77
The present work involves stability indicating spectrophotometric methods (bivariate and chemometric models) which applied for the resolution of overlapping bands. Kinetic studies of the decomposition of EZE are essential for the quality control of its product and to determine the order of the reaction, so the kinetic study of alkaline degradation of EZE was applied.
It’s the very important to know both activation energy (Ea) and half-life(t1/2) to determine the minimum energy required for initiating the reaction and the time required for 50% of the reaction to be occurred. It’s too simple to calculate both Ea and t1/2 after determination of the order of the reaction.
We can conclude that the developed methods have the advantages of being simple and not expensive methods. The procedures applied in each method do not need any sophisticated instruments, critical reactions or any pretreatment step. The proposed methods are found to be sensitive, selective and accurate with no significant difference of the precision compared with the spectrophotometric reported method.87
They could be applied for routine analysis of ezetimibe in pure form or in its pharmaceutical formulation without interference from the excipients or the degradation product and could also be easily used in quality control laboratory for its analysis. The methods are also suitable and valid for application in laboratories lacking liquid chromatographic instruments.
The advantage of bivariate method over the other chemometric techniques, there is no need for full spectrum data and no data processing is required.
I am deeply thankful to ALLAH, by the grace of whom this work was realized. I wish to express my indebtedness and gratitude to staff members of Analytical Chemistry Department for their valuable supervision, continuous guidance, and encouragement throughout the whole work.
The authors declare there is no conflict of interests.
None.

©2016 Attia, et al. This is an open access article distributed under the terms of the, which permits unrestricted use, distribution, and build upon your work non-commercially.