Journal of
eISSN: 2473-0831


Research Article Volume 8 Issue 2
Department of Chemistry, University of Khartoum, Sudan
Correspondence: Abdalla Ahmed Elbashir, University of Khartoum, Faculty of Science, Department of Chemistry, Khartoum 11115, Sudan, Tel +2495661431431
Received: January 28, 2019 | Published: March 20, 2019
Citation: Alamin IA, Elbashir AA. A new study on Omeprazole spectrophotometric determination using 9- Fluorenylmethyl chloroformate as derivatizating agent. J Anal Pharm Res. 2019;8(2):38?43. DOI: 10.15406/japlr.2019.08.00309
An accurate, sensitive and simple method has been developed for spectrophotometric determination of omeprazole (OMZ) in its pharmaceutical formulation. The method based on derivatization of OMZ with 9- Fluorenylmethyl chloroformate (FMOC-Cl). All the reaction conditions were optimized, such as pH, the buffer volume, concentration of the reagent, reaction temperature and time. The reaction was successfully promoted and the mechanism was postulated. The derivatization product has maximum absorbance at 217nm, and Beer’s law was obeyed in the concentration range of 2.0 to 12.0µg/mL with correlation coefficient 0.999 and limit of detection 0.364µg/mL. The method was validated with respect to accuracy, robustness and selectivity. The method successfully has been applied for determination of OMZ in the pharmaceutical formulation.
Keywords: omeprazole, FMOC-Cl, derivatization reaction, spectrophotometric determination
Omeprazole (OMZ) chemically known as 5-Methoxy-2-[[(4-methoxy-3,5-dimethyl-2-
pyridinyl)methyl]sulfinyl]-1H-benzimidazole (Figure 1), is one of irreversible proton pump (H+/K+- ATPase) inhibitors that decrease acid secretion from gastric parietal cell, and it is also effective in treatment of Zollinger Ellison syndrome and preventing ulcer re-bleeding, and recently it has been used as a potential anti-inflammatory agent to protect the gastric mucosa from the inflammation caused by Helicobacter pylori infection. The therapeutic importance of OMZ helped in development of many methods of determination in pharmaceutical formulations and biological samples.1,2
Literature survey revealed that, there are several publication of omeprazole quantitative determination either individually or combined dosage form using various techniques, for instance, LC-MS/MS procedure for determination in drugs and metabolites in biological liquids such as urine and plasma, UPLC with UV detection method for determination of omeprazole in omeprazole magnesium blend,3 FT-IR spectroscopic determination of omeprazole in combined dosage form,4 RP-HPLC methods of determination,5-9 HPLC quantitative methods of determination,10–14 Capillary electrophoresis,15 electrochemical methods,16-19 spectrofluorometric methods20 and spectrophotometric methods.21-27 However, some methods have low sensitivity and accuracy.
Among these techniques UV-Visible spectrophotometry is one of the most frequently employed techniques in pharmaceutical analysis,28 it is a convenient technique due to its simplicity, cost effective, sensitivity, and wide availability in laboratories.
Derivatization is a chemical reaction that yields a new product. It is often required in order to increase sensitivity or selectivity, and can be achieved by specific detection such as fluorescence or absorption in specific wavelength, and it can be induced by organic, electrochemical, or displacement (nucleophilic or electrophilic) reactions using specific reagents, one of these reagents is 9- Fluorenylmethyl chloroformate (FMOC-Cl), it is used to derivatize primary, secondary amines, and phenolic hydroxyl moieties by nucleophilic substitution reaction, and it is also applied in the derivatization of aminoglycosides such as gentamycin.29 Determination of pharmaceuticals has also been reported using this reagent, it has been used to improve the detection limit and accuracy.30
Even though omeprazole methods of determination have been extensively studied, the development and validation of simple, accurate, and alternative method of omeprazole determination has been carried out in the present work, in order to overcome other methods disadvantages.
Apparatus
The spectrum of the reaction product was measured, the optimum condition was determined and the validation characters were calculated using UV-1800 Shimadzu (UV spectrophotometer) with spectrum region 190-800nm.
Preparation of reagents and solutions
All reagents and chemicals are with analytical grade, distilled water was used in all experiments.
Stock standard solution
OMZ stock powder (99.9%) was obtained kindly from Amipharma Laboratories (Sudan), 100µg/mL solution of OMZ in acetonitrile (98%) was prepared and kept in refrigerator at 4oC, then the working standards were prepared freshly by taking appropriate volume of stock solution.
9-Fluorenylmethyl chloroformate
FMOC-Cl was obtained from Sigma-Aldrich (St. Louis, USA) (97%), 100µg/mL solution was prepared in acetonitrile (98%), then appropriate volumes were taken to prepare fresh working standards.
Buffer solution
Boric acid (97%), Potassium chloride (98%) and Sodium hydroxide (99.9%) were obtained from SDFCL (Mumbai) and used to prepare borate buffer solution (BBS) 0.2 molL-1 with different pH values.
Sample solution
The content of 10 capsules of OMZ (Omiz 20mg - Amipharma-Sudan) were evacuated and mixed, then an appropriate weight was taken, dissolved in 1.0ml of sodium hydroxide, sonicated for 10 minutes, then completed to the mark with acetonitrile to prepare 100µg/mL solution.
Derivatization reaction of OMZ using FMOC-Cl is an alternative method of determination, which increase the sensitivity in the ultraviolet region. In the present work the effectiveness of derivatization reaction between FMOC-Cl and OMZ studied with accordance to the optimum conditions, including the pH, buffer volume, FMOC-Cl concentration, temperature and time of the reaction.
Derivatization procedure
To ensure the formation of the derivatization product by the proposed method, some experiments were performed as follows:
Optimization of the reaction
To ensure the effectiveness of the reaction, the spectra of the OMZ in the medium, FMOC-Cl in the medium, and the reaction product was compared (Figure 2). In the reaction optimization, some variables have been taken in the consideration that have great effect on the absorbance in order to get the higher, stable, and clear peak with good yield of product and fast preparation procedure of derivatization (Table 1).
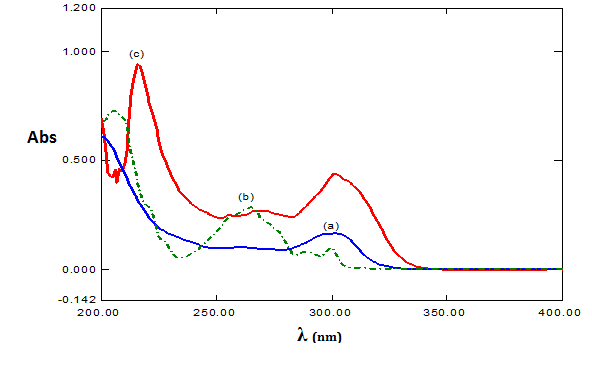
Figure 2 Absorption spectra of: (a) OMZ 10.0µg/mL (blue line), (b) FMOC-Cl 5.0µg/mL (green line), (c) OMZ and FMOC-Cl reaction product (red line).
Condition |
Range |
pH |
6.0-10.0 |
Borate buffer volume (mL) |
1.0 - 2.5 |
FMOC-Cl concentration µg/mL |
5.0 -25.0 |
Reaction Temperature (°C) |
27.0 -70.0 |
Time of the reaction (min) |
0.0 - 25 |
Table 1 The optimization conditions of the proposed method
5.0µg/mL FMOC-Cl spectrum in the reaction medium has three absorbance peaks (206, 264, 300nm), the 10.0µg/mL of OMZ has maximum absorbance 0.164 at 300nm, and the derivatization product profile has two absorbance region (217, and 300nm) and it is clearly observed that the absorbance peak has increased.
Effect of the pH
pH of the medium affects both FMOC-Cl and OMZ, in the alkaline media OMZ generates nucleophile and so the nucleophilic substitution reaction with FMOC-Cl will take a place,29 also OMZ decomposes in the acidic media. pH values control the derivatization and the hydrolysis products; the formation of FMOC-OMZ and FMOC-OH are produced simultaneously, and the concentration of FMOC-OMZ decreased as FMOC-OH formed. in present procedure variation of pH values (from 6.0 to 10.0) of BBS 0.2molL-1 revealed that the FMOC-OMZ production increased gradually till pH 8.0 [the highest absorbance value]and decreased after that due to FMOC-OH quick formation (35), so pH 8.0 has been chosen as optimum (Figure 3a).
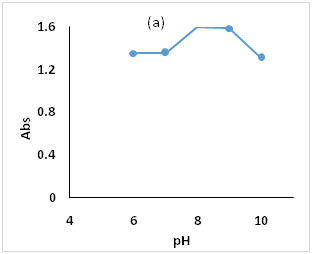
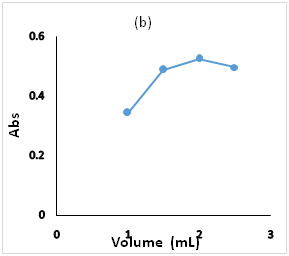
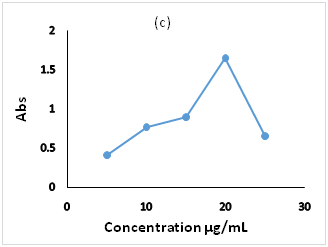
Figure 3 Effect of the optimization parameters on the derivatiztion reaction, (a): pH ranges 6.0 to 10, (b) BBS 0.2 molL-1 volumes 1.0 to 2.5mL, (c): FMOC-Cl concentration in the range 5.0 to 25.0µg/mL.
Effect of the buffer volume
The influence of 0.2molL-1 BBS volume (1.0 to 2.5ml) on the nucleophilic substitution reaction was investigated, the absorbance increase with increasing of buffer volume which promotes the amine group reactivity and stabilize the solubility of derivatization product in the acetonitrile (31). it has been found that 2.0ml is the optimum volume to achieve maximum buffering capacity and facilitate the substitution. The absorbance peak decreases by increasing the volume buffer solution. This is properly due to the increase of hydroxide ion that retard the reaction between FMOC-Cl and OMZ and fasten the formation of FMOC-OH1 (Figure 3b).
Effect of FMOC-Cl concentration
The reagent concentration has great effect on the product formation, so the variation in the FMOC-Cl concentration was studied in the range (5.0 to 25µg/mL). The result revealed that at lower concentration decrease the probability of the reaction, so lower absorbance attained. As increasing the concentration, the absorbance increases and reach the maximum at 20.0µg/mL where the reaction is completed, then decreases due to hydrolysis reaction of excess reagent that convert to FMOC-OH31 (Figure 3c).
Effect of temperature and time of the reaction
OMZ is sensitive and decomposes at high temperature,32 the effect of the reaction temperature was investigated, and the result showed that the absorbance increases while the temperature increase in the range of (29–600C), then decreases due to the decomposition of OMZ (Figure 4a). The reaction time effect is important to ensure the completion of the substitution reaction, the spectrum of the product in the time (0 to 20 min) revealed that the variation of the absorbance was not significant (about 0.2), so that direct measurement was determined as optimum (Figure 4b).
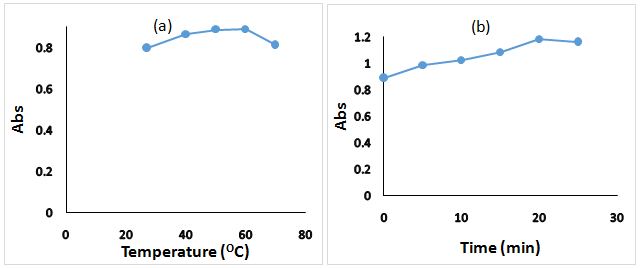
Figure 4 Effect of reaction temperature and time on the reaction product of OMZ (10.0µg/mL) and FMOC-Cl (10.0µg/mL).
Propsed mechanism of the reaction
FMOC-Cl reacts with primary and secondary amines by nucleophilic substitution in two minutes at buffer pH 8.0 giving stable derivative, and it combines with imidazole ring of amino compounds.28 OMZ has imidazole moiety that could react to form FMOC-Cl derivative (Scheme 1).
Linearity, limit of detection (LOD) and limit of quantification (LOQ)
Calibration curve was performed using different concentration of OMZ in the range 2.0–12.0µg/mL, with correlation coefficient r2 0.999 and intercept 0.1456 (Figure 5), the intercept is not comparable in magnitude to the standard error and the r2 value is low when the curve line is forced to cross the origin, so the line should not across the base [0,0] (36), also the intercept has relatively large value, it might be due to unstable absorbance that produced from lower concentrations [1.0µg/mL] which considered as noise. very low concentrations [lower than 1.0µg/mL] have lower absorbance than the blank, and give negative intercept value, so 2.0µg/mL used as starting concentration for calibration curve. Molar absorptivity є is found to be 2.89 x 10⁴ Lmol-1cm-1, and Sandell’s sensitivity = 0.5139µg/mL/cm2.
The minimum level of the analyte that can be detected (LOD) is calculated using the following equation
Where s is the standard deviation of the intercept, k is the slope of calibration curve, according to this equation the limit of detection found to be 0.364µg/mL.
The limit of quantification (LOQ) is the lowest concentration of the analyte that can be measured with accepted accuracy and precision33 is calculated by the following equation:
The calculated LOQ for this method found to be 1.214µg/mL (Table 2).
|
Parameter |
Value |
|
Linear range (µg/mL) |
2.0-12.0 |
|
LOD (µg/mL) |
0.364 |
|
LOQ (µg/mL) |
1.214 |
|
Slope |
0.0688 |
|
Intercept |
0.1456 |
|
Correlation coefficient (r2) |
0.999 |
|
Molar absorpativity (є) L mol-1 cm-1 |
2.889 x 10⁴ |
|
Sandell’s sensitivity |
0.5139 |
Table 2 Summery of statistical data of the linear calibration curve
The proposed spectrophotometric method that applied for OMZ determination was compared to other validated methods, the comparison indicates that this method is more sensitive and accurate than the others2,34 in the same concentration range (Table 3).
|
Reagent |
Linearity range (µg/mL) |
Regression equation |
r2 |
LOD (µg/mL) |
LOQ (µg/mL) |
|
This study (FMOC-Cl) |
2.0-12.0 |
Y = 0.0688x+0.1456 |
0.999 |
0.364 |
1.214 |
|
DNFBa |
5.0-40.0 |
Y = 0.02x+0.074 |
0.999 |
1.48 |
4.51 |
|
DCNQb |
5.0-50.0 |
Y = 0.003x+0.0105 |
0.999 |
3.27 |
9.92 |
|
BROMb |
20.0-225.0 |
Y = 0.0039x+0.0072 |
0.999 |
6.21 |
18.82 |
Accuracy and precision
The accuracy and precision of the proposed method were carried out by using three different concentrations with three replicates. Accuracy was determined by calculating the recovered value and the percentage relative error (Er %) (Table 4), and the precision was determined using pure standard by calculating the percentage relative standard deviation (RSD %). The results revealed that the proposed method has good level of accuracy and precision.35
|
Sample (µg/mL) |
Added (µg/mL) |
Found (µg/mL) |
Recovery*± RSD (%) |
Relative error (Er%) |
|
4 |
1 |
4.88 |
97.62 ± 2.1 |
-2.38 |
|
4 |
4 |
8.03 |
100.33 ± 2.86 |
0.33 |
|
4 |
6 |
10.11 |
101.10 ± 1.01 |
1.01 |
Table 4 Recovery of the proposed method
*The values are mean of three determinations.
Robustness
The robustness of the method was studied to evaluate the effect of small variation in some parameters upon its analytical performance. The parameters were pH, temperature of the reaction and reagent concentration. The recovery was calculated each time and there was no significant effect was observed except at high temperature (Table 5).
Parameter |
Value |
Recovery % |
pH (optimum = 8.0) |
7.8 |
100.36 |
8.2 |
101.1 |
|
FMOC-Cl concentration (µg/mL) (optimum = 20.0) |
18 |
95.3 |
22 |
102.7 |
|
Temperature (oC) (optimum = 60.0) |
55 |
99.3 |
65 |
88.9 |
Table 5 Robustness of the proposed method
*The values are mean of three determinations.
Selectivity
To evaluate the effect of frequently founded species (excipients) within OMZ pharmaceutical formulation, a study containing these species was carried out. A solution of 12.0mgL-1 of OMZ standard spiked with different species under the optimum conditions. The results found were the same as the obtained result in the calibration, indicating that there is no effect of interference.
Analysis of pharmaceutical formulation
The proposed method was applied to determine OMZ in its pharmaceutical formulation, the recovered value was (96.4%), indicating the reliability of the method.
In this work, the product of the derivatization reaction between OMZ and FMOC-Cl has been utilized to develop a simple accurate and sensitive spectrophotometric method for OMZ analysis in pharmaceutical formulation, the derivatization reaction was optimized, the suggested mechanism was postulated and the method was validated with accordance of linearity, accuracy, selectivity and other validation character. The proposed method is superior to other spectrophotometric methods using derivatization,2,34 making it suitable for use in quality control laboratories.
None.
The author declares that there is no conflicts of interest.

©2019 Alamin, et al. This is an open access article distributed under the terms of the, which permits unrestricted use, distribution, and build upon your work non-commercially.