
Research Article Volume 7 Issue 3
A comparative study of different spectrophotometric methods for determination of lomefloxacin hydrochloride in the presence of its decarboxylated degradation product
Mohammed Wafaa Nassar,
Regret for the inconvenience: we are taking measures to prevent fraudulent form submissions by extractors and page crawlers. Please type the correct Captcha word to see email ID.

Khalid AM Attia, Ragab A Said, Ahmed El Olemy, Mohamed A Hasan
Correspondence: Mohamed Abd Allah, Assistant lecturer of Analytical Chemistry, Department of Pharmaceutical Analytical Chemistry, Faculty of Pharmacy, Al-Azhar University, Nasr City, Cairo, Egypt, Tel 2.01021E+11
Received: February 27, 2018 | Published: May 8, 2018
Citation: Nassar MW, Attia KAM, Said RA, et al. A comparative study of different spectrophotometric methods for determination of lomefloxacin hydrochloride in the presence of its decarboxylated degradation product. J Anal Pharm Res. 2018;7(3):254?262. DOI: 10.15406/japlr.2018.07.00235
Download PDF
Abstract
Four simple, accurate, sensitive and low cost spectrophotometric methods have been developed and validated for the determination of lomefloxacin hydrochloride in the presence of its decarboxylated degradation product without preliminary separation. Method (I) is simultaneous equation method, while method (II), method (III) and method (IV) are ratio spectra manipulating methods, called ratio derivative, ratio difference and mean centering methods, respectively. Complete degradation of the drug and the degradation pathway was confirmed using TLC, IR, 1H NMR and mass spectrometry. Calibration graphs were established in the range of 1-13μg/ml with good correlation coefficients. The developed methods were validated according to the International Conference on Harmonization (ICH) guidelines demonstrating good accuracy and precision. The results were statistically compared with those obtained by the reported method applying student’s t-test and F-test at 95% confidence level and no significant difference was found.
Keywords: lomefloxacin hydrochloride, decarboxylated degradation product, simultaneous equation, ratio spectra, ratio derivative, ratio difference and mean centering
Introduction
Lomefloxacin hydrochloride is chemically known as (RS)-1-ethyl-6,8-difluoro-1,4-dihydro-7-(3-methylpiperazin-1-yl)-4-oxoquinoline-3-carboxylic acid hydrochloride Figure 1. Lomefloxacin hydrochloride is a white powder soluble in water and methanol with 387.81 molecular weigth.1 It is a non-official drug which is known as a fluorinated 4-quinolone or fluoroquinolone antibacterial with a wider spectrum of activity than nalidixic acid and more favorable pharmacokinetics allowing its use in systemic infections. It has been used in the treatment of infections including bone and joint infections, gastro-enteritis (including travelers' diarrhea and campylobacter enteritis, cholera, salmonella enteritis, and shigellosis), gonorrhea, infections in immunocompromised patients (neutropenia), Q fever, lower respiratory-tract infections, typhoid and paratyphoid fever.2 Literature survey reveals that many HPLC methods were reported for determination of lomefloxacin hydrochloride in pharmaceutical preparations and biological fluids.3–11 Also atomic absorption,11 spectrophotometric,12–19 spectrofluorimetric20–24 and electrochemical25–30 methods were reported for determination of lomefloxacin hydrochloride alone or in presence of other fluoroquinolone antibiotics. Reviewing the literature on the determination of lomefloxacin hydrochloride revealed the lack of any spectrophotometric methods for the determination of the intact drug in presence of its acid-induced degradation product. The aim of this work is to develop and validate simple, sensitive and selective spectrophotometric methods for the determination of lomefloxacin hydrochloride in the presence of its decarboxylated degradation product.
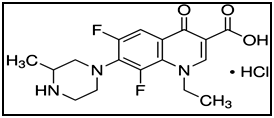
Figure 1 Structural formula of lomefloxacin hydrochloride.
Theory
Theory of simultaneous equation
Consider a multicomponent system consisting of two components X and Y, each of which absorbs at the λmax of the other. λ1 being the wavelength of maximum absorbance of X and λ2 being the wavelength of maximum absorbance of Y, it may be possible to determine both components by the technique of simultaneous equation method using “Cramer’s Rule’’ and “Matrix Method’’.
The information required is:
- The absorptivities of X at λ1 and λ2,
and
respectively.
- The absorptivities of Y at λ1 and λ2,
and
- The absorbance of the diluted sample at λ1 and λ2, A1 and A2
-
and
be the concentrations of X and Y respectively in the diluted sample.
Thus the absorbance of the mixture at λ1 and λ2 may be expressed as follows:
At λ1
(1)
At λ2
(2)
For measurements in 1 cm cell, b = 1, rearrange eq (2)
Substituting for in
eq (1) and rearranging gives
(3)
(4)
Using the above two equations (3, 4) the concentration of component X and component Y in the sample mixture can be determined.31
Theory of ratio derivative method
Upon dividing the absorption spectrum of a compound by a spectrum of the same compound, a straight line of constant amplitude (parallel to the baseline) will result. However, upon dividing the absorption spectrum of a compound (X) by the absorption spectrum of another compound (Y), a new spectrum (ratio spectrum) will result. The amplitude of the first or second derivative of the ratio spectrum at a maximum or a minimum is proportional to concentration of X without interference from Y.
Theory of ratio difference method
The difference in peak amplitudes between two selected wavelengths in the ratio spectrum is proportional to concentration of X without interference from Y.
Mathematically it can be explained as follows:
- In the ratio spectrum of a laboratory prepared mixture of X and Y divided by a standard spectrum of Y as a divisor (Y')
(1)
(2)
Where P1 and P2 are the amplitudes of the mixture in the ratio spectrum at λ1 and λ2, respectively. A1X, A1Y and A1Y' are the absorbances of X, Y and divisor (Y'), respectively at λ1. A2X, A2Y and A2Y' are the absorbances of X, Y and divisor (Y'), respectively at λ2.
- Since A1Y
/A1Y' equal A2Y /A2Y' (straight line of constant amplitude), therefore:
(3)
- As we use a certain concentration of Y as a divisor (Y'), so A1Y' and A2Y' have certain constant values and the component Y will be completely cancelled and the difference will represent the X component only.
Component X in a binary mixture can be determined from a calibration curve that relates the difference in amplitudes (∆P1 – 2) in the ratio spectrum at λ1 and λ2 using a certain concentration of Y as a divisor to the corresponding concentration of X. Similarly component Y can be obtained by using certain concentration of X as a divisor.32,33
Theory of mean centering of ratio spectra method
Mathematically it can be explained as follows:
- If we have a column of a set of data (X) where:
- We center or mean center (MC) column X by subtracting the mean of the three numbers (Xˉ):
- If the spectrum of a mixture of two compounds X and Y is divided by a standard spectrum of Y as a divisor (Y'), a ratio spectrum will result and therefore:
(1)
Where, P is the amplitude of the mixture in the ratio spectrum. AX, AY and AY' are the absorbance values of X, Y and divisor (Y'), respectively.
- Mean centering of equation (1) will lead to:
(2)
- Since AY /AY' is a straight line of constant amplitude, so its mean centering is equal to zero and therefore:
(3)
- As we use a certain known concentration of Y as a divisor (Y'), so component Y will be completely cancelled and the mean centering value will represent the X component only.
Component X in a binary mixture (X and Y) can be determined from a calibration curve that relates the mean centering values of the ratio spectrum using a certain concentration of Y as a divisor to the corresponding concentration of X. For more sensitivity, the mean centering values should be measured at a maximum or minimum wavelength.34
Experimental
Instruments
- Shimadzu UV-Visible 1650 Spectrophotometer, (Tokyo, Japan), equipped with 10 mm matched quartz cells.
- Hot plate (Torrey pines Scientific, USA).
- Jenway, 3510 pH meter (Jenway, USA).
- Rotatory evaporator (Scilogex-RE 100-pro, USA).
- NMR, Gemini-400 BB (Agilent, USA).
- FT-IR, Nicolet IR 200 (Thermo electron corporation, USA).
- GCMS-QP-1000 EX mass spectrometer at 70 ev (Shimadzu, Tokyo, Japan).
Materials and reagent
All reagents used were of analytical grade, solvents were of HPLC grade and water used throughout the procedure was freshly distilled.
- Pure lomefloxacin hydrochloride (99.65%) was kindly provided by Sigma pharmaceutical industries - Quesna City – Egypt, S.A.E.
- Lomex® tablet: labeled to contain 442mg lomefloxacin hydrochloride per tablet equivalent to 400mg lomefloxacin, manufactured by Sigma pharmaceutical industries - Quesna City – Egypt, S.A.E.; (batch number 40357), purchased from local market.
- Hydrochloric acid and potassium hydroxide (El-Nasr Company, Egypt), prepared as 2M aqueous solutions.
- Methanol analytical grade (Sigma–Aldrich, Germany).
Standard solutions
A stock standard solution of lomefloxacin hydrochloride (1mg/ml) was prepared by dissolving 100mg of the drug powder in 50ml of methanol and the volume was completed to 100ml with methanol. Working standard solution (100μg/ml) was prepared by dilution of the stock solution with methanol.
Standard solution of lomefloxacin hydrochloride degradation product
100mg of pure lomefloxacin hydrochloride powder was treated with 25ml of 2M HCl in a 100-ml round bottomed flask, the solution was heated under reflux for 10 hours. After cooling, the solution was neutralized to pH=7-8 using 2M KOH and evaporated to dryness under vacuum. The obtained residue was extracted three times with 25ml of methanol, filtered into 100-ml volumetric flask and diluted to volume with methanol to obtain a stock solution labeled to contain degradation product derived from 1mg/ml of lomefloxacin hydrochloride.17 Working solution of degradation product (100μg/ml) was obtained by dilution of the stock solution with methanol.
Procedures
General procedure: Aliquots from lomefloxacin hydrochloride and its degradation product standard solutions (100µg/ml) equivalent to (10–130µg/ml) were accurately transferred into two separate sets of 10-ml volumetric flasks and completed to the mark with methanol. The zero order absorbance of each set was scanned in the range of 200–400nm using methanol as a blank.
- For simultaneous equation method: The absorbance values of lomefloxacin hydrochloride and its degradation product were measured at 287nm (λmax of intact drug) and at 271 (λmax of degradation product) and the calibration graphs were constructed. The absorptivity values for each compound at the selected wavelengths were used to calculate the concentration of lomefloxacin hydrochloride in presence of its degradation product using equation (3) mentioned under “Theory of simultaneous equation”
- For ratio derivative method: The absorption spectra of intact lomefloxacin hydrochloride were divided by the spectrum of its degradation product (7µg/ml) then the first derivative corresponding to each ratio spectrum was recorded, using Δλ=4nm and scaling factor=10. The amplitude values were measured at 283nm. The measured amplitudes versus the final concentrations in μg/ml were plotted to get the calibration graph and the regression equation was derived.
- For ratio difference method: The absorption spectra of intact lomefloxacin hydrochloride were divided by the spectrum of its degradation product (7µg/ml) then the difference in the peak amplitudes (ΔP) at the ratio spectra was measured at 290 and 323nm (ΔP290-323nm). The measured difference values in peak amplitudes (ΔP) versus the final concentrations in μg/ml were plotted to get the calibration graph and the regression equation was derived.
- For mean centering method: The absorption spectra of intact lomefloxacin hydrochloride were divided by the spectrum of its degradation product (7µg/ml) then the ratio spectra (from 200 to 400nm) were mean centered and the mean centered values were measured at 286nm. The measured mean centered values versus the final concentrations in μg/ml were plotted to get the calibration graph and the regression equation was derived.
Application to laboratory prepared mixtures: The general procedure was repeated for each method using aliquots of intact lomefloxacin hydrochloride solution (100μg/ml) containing (110–20µg) with aliquots of lomefloxacin hydrochloride degradation product solution (100μg/ml) containing (20–110µg). The intact drug concentrations were calculated from the corresponding regression equation.
Application to pharmaceutical formulation: Ten Lomex® tablets (442mg/tablet) were weighted and finely powdered. Appropriate weight of powder equivalent to 10mg of lomefloxacin hydrochloride was accurately weighted, transferred to 100-ml volumetric flask and the volume was made up to 75ml with methanol. The solution was shaken vigorously for 15min then sonicated for 30min and then filtered. The volume was completed to 100ml with methanol to obtain a concentration of 100μg/ml. Repeat the general procedure for each method using aliquots covering the working concentration range.
Results and discussion
In the present study, four different spectrophotometric methods were applied for the determination lomefloxacin hydrochloride the presence of its decarboxylated degradation product, whose spectra show high degree of interference Figure 2 which hinder the direct UV determination of the drug in mixture with its degradation product. Sensitivity and selectivity of the applied methods were assessed and compared.
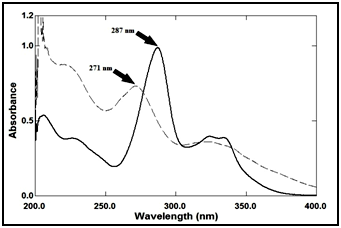
Figure 2 Zero order absorption spectra of lomefloxacin hydrochloride 9μg/ml (ـــــ) and its degradation product 9μg/ml (ـــ ـــ).
Degradation of lomefloxacin hydrochloride
It was reported that complete degradation of lomefloxacin hydrochloride was achieved upon heating under reflux with 2M hydrochloric acid for 10hours to give its decarboxylated degradation product as shown in the following scheme,17 Figure 3.

Figure 3 Proposed degradation pathway of intacat lomefloxacin hydrochloride.
Confirmation of complete degradation using TLC technique
Time required for complete degradation was exactly determined by spotting on TLC plates every 30 minutes using mobile phase system consists of 0.3M ammonium chloride solution: conc. ammonia solution: 1-propanol (1:1:8, by volume), complete degradation of lomefloxacin hydrochloride was confirmed by absence of spot in the region of the degradation product corresponds to the spot of the intact drug.
Confirmation of degradation product using IR techniques: IR spectrum of the intact lomefloxacin hydrochloride in Figure 4, showed peak of (C=O) of carboxyl group (-COOH) at 1726.31cm-1, while IR spectrum of degradation product in Figure 5, showed disappearance of (C=O) stretch of carboxyl group which indicate the cleavage of carboxylic acid linkage.
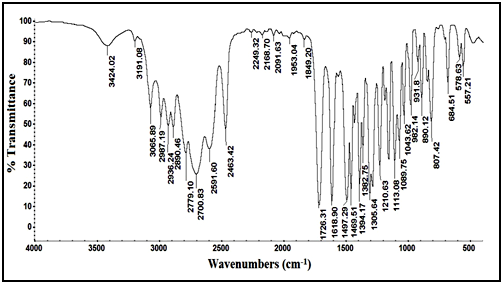
Figure 4 IR spectrum of intact lomefloxacin hydrochloride.
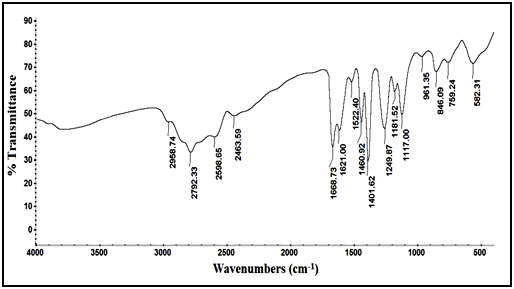
Figure 5 IR spectrum of lomefloxacin hydrochloride degradation product.
Confirmation of degradation product using 1H NMR techniques: The 1H NMR of the intact lomefloxacin hydrochloride in dimethyl sulfoxide (DMSO) in Figure 6, showed triplet signal of three protons of aliphatic (-CH3) in ethyl group at 1.323-1.358ppm, doublet signal of three protons of methyl group (-CH3) attached to piperazine ring at 1.745-1.762ppm, multiplet signals of seven protons in piperazine ring at 3.546–4.206ppm, multiplet signal of two protons (-CH2-) in ethyl group at 4.632-4.685ppm, singlet signal of one proton in benzene ring at 7.796ppm, singlet signal of one proton in pyridine ring at 8.902ppm, doublet signal of two protons (NH2) in piperazine ring at 10.198 - 10.315ppm and singlet signal of one proton (-COOH) in carboxyl group at 11.783ppm. The 1H NMR of the degradation product in dimethyl sulfoxide (DMSO) in Figure 7, showed disappearance of (-COOH) carboxyl group singlet signal at 11.783ppm indicating the cleavage of carboxylic acid linkage.
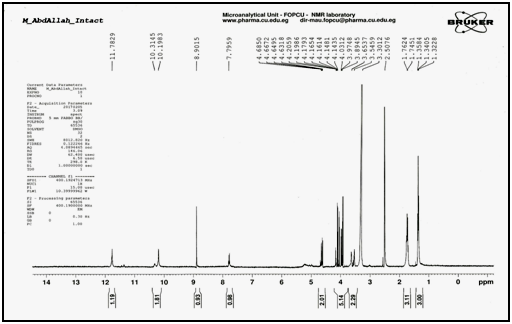
Figure 6 1H NMR spectrum of intact lomefloxacin hydrochloride in (DMSO).
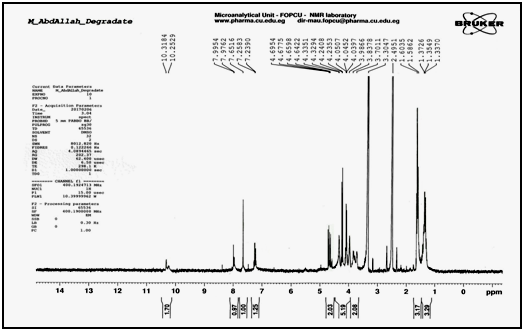
Figure 7 1H NMR spectrum of lomefloxacin hydrochloride degradation product in (DMSO).
Confirmation of degradation product using mass spectrometry: Mass spectrometry was performed for the intact drug and its degradation product and molecular ion peak was obtained at m/z=387.12 and m/z=343.13, respectively indicating that the molecular weight of the degradation product is 343.13 as shown in Figure 8 & Figure 9.
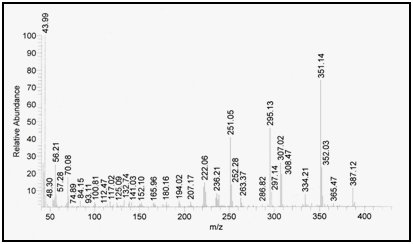
Figure 8 Mass spectrum of intact lomefloxacin hydrochloride.
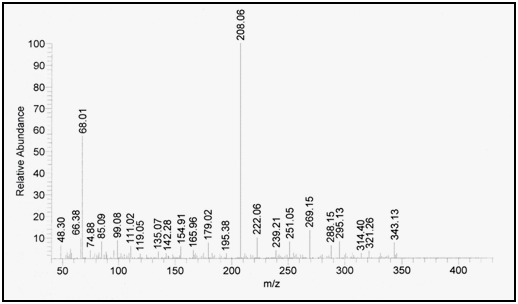
Figure 9 Mass spectrum of lomefloxacin hydrochloride degradation product.
Spectral characteristics
The zero-order absorption spectra of lomefloxacin hydrochloride and its degradation product show sever overlap, as shown in Figure 2.
For simultaneous equation method, the absorbance values of lomefloxacin hydrochloride and its degradation product were measured at 287nm (λmax of intact drug) and at 271 (λmax of degradation product) and the calibration graphs were constructed. The absorptivity values for each compound at the selected wavelengths were used to calculate the concentration of lomefloxacin hydrochloride in presence of its degradation product using equation (3) mentioned under “Theory of simultaneous equation”. Careful choice of the two selected wavelengths was of great importance.
For ratio spectra manipulating methods, the Careful choice of the divisor concentration was of great importance, so different concentrations of degradation product were tried as a divisor (1, 3, 5, 7, 9, 11 and 13μg/ml); the best one was 7μg/ml, as it produced minimum noise and gave better results in accordance with selectivity, as shown in Figure 10.
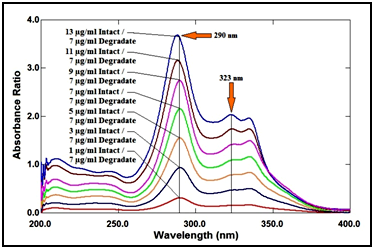
Figure 10 Ratio spectra of lomefloxacin hydrochloride at various concentrations (1, 3, 5, 7, 9, 11 and 13µg/ml) using 6µg/ml of its degradation product as a divisor.
In ratio derivative method, the amplitudes of the first derivative of the ratio spectra at 283nm are proportional to the concentrations of the drug without interference from its degradation product (divisor), as shown in Figure 11 & 12.
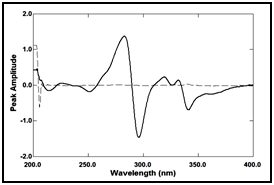
Figure 11 First derivative of the ratio spectra of lomefloxacin hydrochloride 9µg/ml (ــــــ) and its degradate 7µg/ml (ــــ ــــ) using 7µg/ml of its degradation product as a divisor.
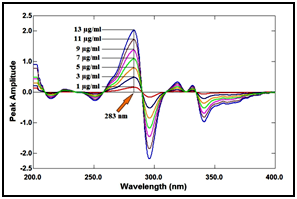
Figure 12 First derivative of the ratio spectra of lomefloxacin hydrochloride at various concentrations (1, 3, 5, 7, 9, 11 and 13µg/ml) using 7µg/ml of its degradation product as a divisor.
In ratio difference method, the difference in peak amplitudes between 290 and 323nm in the ratio spectra is proportional to the concentration of the drug without interference from its degradation product (divisor). In mean centering of ratio spectra method, The mean centered values at 286nm are proportional to the concentrations of the drug without interference from its degradation product, as shown in Figure 13.
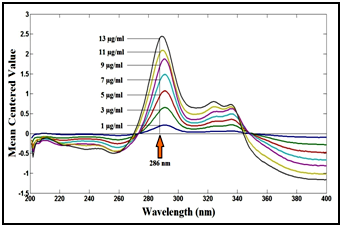
Figure 13 Mean centering of the ratio spectra of lomefloxacin hydrochloride at various concentrations (1, 3, 5, 7, 9, 11 and 13µg/ml) using 7µg/ml of its degradation product as a divisor.
Methods validation
Validations of the proposed methods were assessed as per the ICH guidelines.35
Linearity and range
Calibration graphs were constructed by repeating the general procedure for each method. The regression plots were found to be linear over the range of 1-13µg/ml. The yielded statistical results are summarized in Table 1.
Parameters |
Simultaneous equation |
Ratio derivative |
Ratio difference |
Mean centering |
Wavelength (nm) |
271 |
287 |
283 |
290 and 323 |
286 |
Linearity range |
1-13 |
1-13 |
1-13 |
1-13 |
1-13 |
LOD |
0.267 |
0.262 |
0.269 |
0.221 |
0.207 |
LOQ |
0.809 |
0.794 |
0.815 |
0.670 |
0.628 |
- Regression Equation
- Slope (b)
- Intercept (a) |
y=b x + a
0.1068
0.0129 |
y=b x + a
0.0501
-0.0057 |
y=b x + a
0.1549
0.0074 |
y=b x + a
0.1477
0.0213 |
y=b x + a
0.1815
-0.0113 |
Correlation coefficient (r) |
0.9997 |
0.9996 |
0.9996 |
0.9998 |
0.9998 |
Accuracy (% R) |
99.70 |
101.15 |
100.26 |
98.62 |
Precision (% RSD)
Repeatabilitya
Intermediate precisionb |
1.051
0.955 |
0.687
1.514 |
1.124
0.967 |
0.697
1.320 |
Table 1 Regression and validation data for the determination of lomefloxacin hydrochloride by the proposed methods
aThe intraday (n=3), average of three concentrations of lomefloxacin hydrochloride (3, 7 and 11μg/ml) repeated three times within the day.
bThe interday (n=3), average of three concentrations of lomefloxacin hydrochloride (3, 7 and 11μg/ml) repeated three times in three days.
Limits of detection and quantitation:
The limits of detection (LOD) and the limits of quantitation (LOQ) were calculated according to ICH guidelines from the following equations:
Where σ is the residual standard deviation of a regression line and S is the slope of the calibration curve. LOD and LOQ values were mentioned in Table 1 and indicate good sensitivity of the methods.
Accuracy and precision
Accuracy and precision of the methods were determined by applying the proposed methods for determination of three different concentrations, each in triplicate, of lomefloxacin hydrochloride in pure form within linearity range in the same day (intraday) and in three successive days (interday). Accuracy as percent recovery (%R) and precision as percent relative standard deviation (%RSD) were calculated and results are listed in Table 1. To ascertain the accuracy of the suggested methods, recovery studies were carried out by standard addition technique at four different levels in Table 2. From these data the methods show high accuracy and precision.
Pharmaceutical taken (µg/ml) |
Pure added (μg/ml) |
Pure Recovery (%) |
Simultaneous equation |
Ratio derivative |
Ratio difference |
Mean centering |
4 |
2 |
101.34 |
98.58 |
99.21 |
99.15 |
4 |
100.85 |
100.79 |
98.69 |
98.06 |
6 |
101.60 |
99.51 |
101.29 |
100.32 |
8 |
99.17 |
101.80 |
98.16 |
98.11 |
Mean |
|
100.74 |
100.17 |
99.34 |
98.91 |
% RSD |
|
1.084 |
1.412 |
1.380 |
1.078 |
Table 2 Recovery study of lomefloxacin hydrochloride by adopting standard addition technique using the proposed methods
Specificity
The specificity of the proposed methods was assured by applying it to laboratory prepared mixtures of lomefloxacin hydrochloride and its degradation product. The results were listed in Table 3.
Intacat
(μg/ml) |
Degradation product (μg/ml) |
Degradation product (%) |
Intact Recovery (%) |
Simultaneous equation |
Ratio derivative |
Ratio difference |
Mean centering |
11 |
2 |
15.39 |
98.91 |
99.65 |
99.68 |
100.87 |
10 |
3 |
23.08 |
101.40 |
98.34 |
98.75 |
99.49 |
8 |
5 |
38.46 |
99.62 |
100.82 |
99.54 |
101.36 |
5 |
8 |
61.54 |
98.72 |
101.23 |
100.79 |
100.58 |
4 |
9 |
69.23 |
100.31 |
101.97 |
101.46 |
101.87 |
3 |
10 |
76.92 |
98.25 |
ــــــــ |
101.82 |
98.16 |
2 |
11 |
84.62 |
ــــــــ |
ــــــــ |
ــــــــ |
101.92 |
Mean |
|
|
99.54 |
100.40 |
100.34 |
100.61 |
% RSD |
|
|
1.171 |
1.421 |
1.200 |
1.358 |
Table 3 Determination of lomefloxacin hydrochloride in mixtures with its degradation product by the proposed methods
Pharmaceutical applications
The proposed methods were applied for the determination of lomefloxacin hydrochloride in Lomex® tablet. Satisfactory results were obtained in good agreement with the label claim, indicating no interference from excipients and additives. The obtained results were statistically compared to those obtained by the reported method17 indicating good accuracy and precision of the proposed methods for the analysis of the studied drug in its pharmaceutical dosage form, as shown in Table 4. No significant differences were found by applying student’s t-test and F-test at 95% confidence level.
Parameters |
Simultaneous equation |
Ratio derivative |
Ratio difference |
Mean centering |
Reported method*17 |
Number of measurements |
5 |
5 |
5 |
5 |
5 |
Mean % recovery of lomefloxacin hydrochloride |
100.58 |
99.70 |
99.12 |
101.15 |
100.48 |
% SD |
1.051 |
1.236 |
0.878 |
0.912 |
1.320 |
% RSD |
1.042 |
1.239 |
0.886 |
0.902 |
1.314 |
Student’s t-test** |
0.492(2.306) |
0.958(2.306) |
1.914(2.306) |
0.933(2.306) |
—— |
F-value** |
1.578(6.388) |
1.142(6.388) |
2.260(6.388) |
2.095(6.388) |
—— |
Table 4 Determination of lomefloxacin hydrochloride in Lomex® tablet by the proposed methods and the reported method
Conclusion
In this work, sensitive, accurate and precise spectrophotometric methods were developed and applied for the determination of lomefloxacin hydrochloride in bulk powder and in pharmaceutical preparation in the presence of its acid-induced degradation product. Although mean centering method is the most sensetive one with lowest LOD and LOQ but, simultaneous equation seem to be zero order spectrophotometric methods that don’t require further data processing. Ratio derivative, ratio difference and mean centering methods require data processing either through manipulating the ratio spectra with several trials for selection of the optimum divisor or derivatization steps of the ratio spectra. However simultaneous equation does not need any data processing or derivatization, but it requires linearity at two wavelengths. The proposed methods are simple and do not require sophisticated techniques or instruments. The methods were validated according to the ICH guidelines and can be used for the routine analysis and for checking quality of pharmaceutical preparations containing lomefloxacin hydrochloride.
Acknowledgements
Conflict of interest
The authors declare that there is no conflict of interest.
References
- The Merck Index. 14th ed. USA: Merck and CO. INC; 2006.
- Sweetman S. Martindale: the complete drug reference. 36th ed. London: The Pharmaceutical Press; 2009.
- Shibl AM, Tawfik AF, El–Houfy S, et al. Determination of lomefloxacin in biological fluids by high–performance liquid chromatography and a microbiological method. J Clin Pharm Ther. 1991;16(5):353–359.
- Carlucci G, Cilli A, Liberato M, et al. Determination of lomefloxacin in human plasma by solid–phase extraction and high–performance liquid chromatography with UV detection. J Pharm Biomed Anal. 1993;11(11/12):1105–1108.
- Garcia MA, Solans C, Calvo A, et al. Determination of lomefloxacin in plasma samples by HPLC with fluorescence detection. Application to pharmacokinetic studies. Chromatographia. 2001;54(9):577–580.
- Zendelovska D, Stafilov T. Development and validation of high–performance liquid chromatographic method for determination of ofloxacin and lomefloxacin in human plasma. J Serb Chem Soc. 2005;70(12):1451–1460.
- Tozo GC, Salgado HR. Determination of lomefloxacin in tablet preparations by liquid chromatography. J AOAC Int. 2006;89(5):1305–1308.
- Amran MS, Hossain MR, Amjad FM, et al. Development of a simple, sensitive and rapid quantitative analytical method for lomefloxacin by high performance liquid chromatography. Stamford J Pharm Sci. 2011;4(1):69–73.
- Chunyan S, Yaping Z, Jianghong G. Determination of Lomefloxacin and its related substances in lomeftoxacin hydrochloride dispersible tablets by HPLC. China Pharmacist. 2012;9(19).
- Song S, Zhao D, Sun J, et al. Development of a UPLC–MS/MS method for the determination of lomefloxacin in rabbit aqueous humor and its application to a pharmacokinetic study. J Chromatogr B. 2016;1033:187–192.
- Jin T, Wu H, Gao N, et al. Extraction of quinolones from milk samples using bentonite/magnetite nanoparticles before determination by high‐performance liquid chromatography with fluorimetric detection. J Sep Sci. 2016;39(3):545–551.
- Salem H. Spectrofluorimetric, atomic absorption spectrometric and spectrophotometric determination of some fluoroquinolones. Am J Appl Sci. 2005;2(3):719–729.
- Issa YM, Abdel–Gawad FM, Abou Table MA, et al. Spectrophotometric determination of ofloxacin and lomefloxacin hydrochloride with some sulphonphthalein dyes. Anal lett. 1997;30(11):2071–2084.
- Feng T, Huiyun L, Yuan L. Extraction spectrophotometric determination of lomefloxacin. Chinese J Anal Chem. 2001;5.
- Srinivas LD, Prasad Rao KVS, Sastry BS. Spectrophotometric determination of lomefloxacin in pharmaceutical dosage form with citric acid acetic anhydride reagent. Int J Chem Sci. 2005;3(2):321–324.
- Gomes GC, Salgado HRN. Validation of UV spectrophotometric method for determination of lomefloxacin in pharmaceutical dosage form. Acta Farm Bonaerense. 2005;24(3):406–408.
- Salem MY, EL–Guindi NM, Mikael HK, et al. Stability indicating methods for the determination of some fluoroquinolones in the presence of their decarboxylated degradates. Chem Pharm Bull. 2006;54(12):1625–1632.
- Darwish IA, Sultan MA, Al–Arfaj HA. Kinetic spectrophotometric method for determination of ciprofloxacin and lomefloxacin in their pharmaceutical dosage forms. Int J Res Pharm Sci. 2010;1(1):43–50.
- Maheshwari M, Verma1 K, Soni K, et al. Difference spectroscopic estimation of lomefloxacin in marketed formulation. Asian J Pharm Educ Res. 2017;6(2):24–29.
- Tieli Z, Huichun Z, Linpei J. Photochemical fluorescence enhancement of the terbium–lomefloxacin complex and its application. Talanta. 1999;49(1):77–82.
- Ling–boa QU, Jie Z, Jian–jun LI. Determination of lomefloxacin by flow injection chemiluminescence. Anal Chem Indian J. 2007;4(1–3):43–48.
- Ulu ST. Highly sensitive spectrofluorimetric determination of lomefloxacin in spiked human plasma, urine and pharmaceutical preparations. Eur J Med Chem. 2009;44(9):3402–3405.
- Yi YN, Li GR, Wang YS, et al. Simultaneous determination of norfloxacin and lomefloxacin in milk by first derivative synchronous fluorescence spectrometry using Al (III) as an enhancer. Analytica Chimica Acta. 2011;707(1):128–134.
- Saleh GA, Askal HF, Refaat IH, et al. Chemiluminescence determination of some fluoroquinolones using NBS–Luminol system. Asian J Biomed Pharm Sci. 2014;4(29):39–49.
- Hongyan CEZYG. Adsorptive voltammetric behavior of lomefloxacin and its application. J Beijing Normal Univ. 2001;2(22).
- Vı́lchez JL, Araujo L, Prieto A, et al. Differential–pulse adsorptive stripping voltammetric determination of the antibacterial lomefloxacin. J Pharm Biomed anal. 2001;26(1):23–29.
- El ries MA, Wassel AA, Abdel Ghani NT, et al. Electrochemical adsorptive behavior of some fluoroquinolones at carbon paste electrode. Anal Sci. 2005;21(10):1249–1254.
- Ramadan A, Mandil H. Determination of lomefloxacin in pharmaceuticals using differential pulse polarographic analysis. Int J Pharm Pharm Sci. 2012;4(5):255–261.
- Ayad MM, Abdellatef HE, Hosny MM, et al. Conductometric determination of sibutramine HCl, sumatriptan succinate and lomefloxacine HCl and the solubility products of their ion associates with molybdophosphoric acid. Eur J Chem. 2013;4(3):297–302.
- Kumar N, Goyal RN. Gold–palladium nanoparticles aided electrochemically reduced graphene oxide sensor for the simultaneous estimation of lomefloxacin and amoxicillin. Sensors and Actuators B: Chem. 2017;243:658–668.
- Chaudhary J, Jain A, Saini V. Simultaneous estimation of multicomponent formulations by UV–Visible spectroscopy: An overview. Int Res J Pharm. 2011;2(12):81–83.
- Elzanfaly ES, Saad AS, Abd Elaleem AB. A smart simple spectrophotometric method for simultaneous determination of binary mixtures. J Pharm Anal. 2012;2(5):382–385.
- Lotfy HM, Saleh SS, Hassan NY, et al. A Comparative study of the novel ratio difference method versus conventional spectrophotometric techniques for the analysis of binary mixture with overlapped spectra. Am J Anal Chem. 2012;3:761–769.
- Darwish HW, Hassan SA, Salem MY, et al. Three different spectrophotometric methods manipulating ratio spectra for determination of binary mixture of amlodipine and atorvastatin. Spectrochimica Acta Part A: Molecular and Biomolecular Spectroscopy. 2011;83(1):140–148.
- Validation of analytical procedure: text and methodology, Q2 (R1). ICH Harmonized Tripartite Guideline. Geneva: International Conference on Harmonization; 2005.

©2018 Nassar, et al. This is an open access article distributed under the terms of the,
which
permits unrestricted use, distribution, and build upon your work non-commercially.


