
Research Article Volume 6 Issue 2
Aerodynamics of intakes of high bypass ratio (hbpr) turbofan engines
Ahmed F El-Sayed,
Regret for the inconvenience: we are taking measures to prevent fraudulent form submissions by extractors and page crawlers. Please type the correct Captcha word to see email ID.

Mohamed S Emeara
Professor of Mechanical Engineering, Zagazig University, Egypt
Correspondence: Ahmed F. El-Sayed, Professor of Mechanical Engneering, Zagazig University, Egypt, Tel +201005384811
Received: January 13, 2020 | Published: June 30, 2020
Citation: El-Sayed AF, Emeara MS. Aerodynamics of intakes of high bypass ratio (hbpr) turbofan engines. Int Rob Auto J . 2020;6(2):88?97. DOI: 10.15406/iratj.2020.06.00206
Download PDF
Abstract
The study of the flow in an aero-engine intake is very important to achieve its highest possible performance and, consequently, the highest performance of the whole engine. The “ground vortex” is a phenomenon introduced to the aero-engine intake, yet it is difficult to study. The difficulty is due to the nearby stationary environment, namely the ground when the aircraft is parking while in maintenance or passenger embarking. A 3-D full-scale computational model was used to simulate the air-flow in a typical high bypass ratio turbofan, namely, General Electric GE CF6-50 engine. A computational study was carried out using the commercial code “CFD-RC” (recently, “ESI-CFD”). The computational code was validated by comparison with previous works. A vortex map was numerically drawn with the ground vortex unsteadily simulated. A correlation was derived for the vortex formation line. The objective of the present paper is to get a suitable correlation to calculate the optimum clearance distance between the engine and the ground. This correlation will be very important the manufacturing companies of aircraft.
Introduction
The ever increasing demand for quieter and more fuel-efficient engines has led to the need for higher by-pass ratio turbofans. As a consequence of the ongoing evolution in turbofan configurations, intake diameters are larger than ever before. For conventional wing-mounted engines, in particular, this increase has major consequences. When the engine is operating in static or near static conditions close to the ground, a strong vortex can be observed between the intake and the solid surface. The ingested vortex is often invisible. However, in humid conditions, and due to the high velocities within the vortex core, the local flow temperature can drop below the dew point, promoting condensation of water vapor in the associated flowfield. This so-called ground (or inlet) vortex can be a major problem. With the advent of large passenger jets since the 1950s ground vortices were quickly identified as a problem because of its ability to ingest large objects into the engine.1,2 Low pressure in the vortex core can impart an impulsive force onto objects that are present on solid surfaces. Subsequently, objects, solid particles, and dust (typically referred to as foreign objects) are lifted off the surface, entrained into the inlet flowfield and carried into the engine by the induced velocity field of the intake. The ingested particles and debris can damage fan blades, erode compressor blades and seals and degrade turbine cooling performance.3
However, not only the vortex is responsible for foreign object damage ingestion (FOD), but it can also present a severe distortion of the associated intake flow-field.4 This distorted flow-field can have a major impact on aircraft performance, such as a reduction in the stall and surge margins and therefore compromising the safety of the aircraft. With fan diameters becoming increasingly larger, fan vibration has recently been identified as an additional major consequence of ground vortex ingestion.5,6 The non-uniform flow associated with the ground vortex entering the intake introduces momentum loss and large velocity gradients, which can significantly alter the local flow angle seen by the fan blade. As a consequence, local flow separation can occur which leads to large resonant forces potentially resulting in high cycle fatigue.
The effect of the intake vortex on engines operating near the ground was studied for more than 50 years, but the phenomenon has not yet been completely understood.7 The existence of the intake vortex system and its alarming impact on FOD occurrence were known in the second half of the twentieth century, but very few researches have been conducted to investigate it. A jet engine running near the ground generates a low-pressure zone near the intake which in turn gives rise to ground vortices. These vortices may, in turn, be strong enough to lift small pieces of concrete or small particles from the ground leading to maintenance problems. The ground vortices are far from being stationary, making their prediction rather difficult. The presence of an air-intake vortex system, near the ground can be observed on the runway during the taxi phase or during the take-off, if tracer particles are present (snow-flakes or rain droplets).8
Initial attempts to study the intake vortex were made using engines on test stands, and soon afterward, scaled model intakes were tested in wind tunnels. In the 1970s, panel methods and computer codes were developed to gain further insight into the phenomenon, but only in the past decade CFD has been applied to its study.7,9 Figure 1 shows the intake vortex in three distinct scenarios: part (a) shows the vortex in an engine on a test stand close to the ground, part (b) shows it on a military engine far above the ground, and part (c) shows it on a propeller aircraft. These figures demonstrate that the vortex can occur in different types of aero-engines as well as in a wide range of operating conditions.

Figure 1 Inlet vortex is seen on (a) Typical jet engine test stand, (b) YC-14 military aircraft, and (c) C-130 aircraft propeller.7
Vortex is invisible in atmospheric conditions. Vortex visibility depends on enough air humidity. At enough air humidity (water droplets) or if sand is present on the ground, it may be sucked up into the vortex and the vortex core will be outlined. A group of researchers from MIT8 discussed a mechanism of the formation of these vortices. Ground vortices can, however, be formed also in the absence of any ambient flow.10–14 Yet, in both cases, the flow generated by the sucked air is similar, which has been confirmed experimentally15 and computationally.
A concise description of the mechanisms of ground vortex formation is presented hereafter. Next, a brief description of the numerical methods used for identifying ground vortex is given. Discussion for the methods employed for removing or reducing the impact of ground vortex formation finalizes this section. The main objective of the present paper is to get a mathematical correlation to calculate the optimum clearance distance between the engine and the ground. This correlation will be very useful to the manufacturing companies of aircraft in the engine installation on the aircraft body.
Criteria for vortex formation
The necessary requirement for vortex formation is the existence of a stagnation point on the ground plane.1 Such a stagnation point acts as a focal point for vorticity. It is concentrated upstream and stretched into the intake. A prerequisite for the existence of this stagnation point is that the sucked streamtube has sufficient interaction with the ground surface. The sucked (or captured) streamtube itself is defined as a streamtube of air that divides the airstream into an internal flow and an external flow; see Figure 2. All fluid particles inside the capture streamtube are ingested, whereas all air particles outside this boundary travel downstream. The characteristics of the sucked streamtube can be estimated from the conservation of mass as follows:
eq 1
eq 2
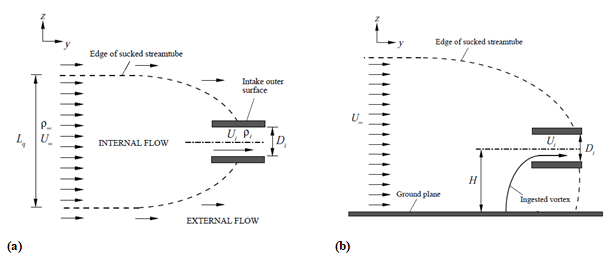
Figure 2 Illustration of sucked stream tube of an intake far from the ground. (a): Plan View, (b) Elevation (front) view.
For an incompressible flow, the area ratio, A∞/Ai, of the sucked streamtube is equal to the reciprocal of the velocity ratio, i.e.:
eq 3
The velocity ratio, (U∗), is used to define the size of the sucked streamtube far away from the intake. When the approaching velocity, U∞, is low (i.e., U∗ is large), the engine air mass flow demand increases and as a consequence, the sucked streamtube size (A∞) increases to match this demand.
The primary parameters that dictate whether the captured streamtube interacts with the ground plane depend fundamentally on the height-to-diameter ratio (H/Di) of the intake, as in Figure 2, and the velocity ratio (U∗) (which determines the size of the captured streamtube at far-field). Therefore, high-velocity ratios and low non-dimensional heights lead to an interaction of the streamtube with the ground and therefore vortex formation.
The formation of ground vortices depends on these two parameters H/Di and U∗. A graphical representation for such dependency is illustrated in Figure 216,17 which identifies the threshold for vortex formation. The vortex/no-vortex map reveals two regions; a vortex formation region and a no vortex zone.16 Another related study,18 constructed a vortex formation map based on the results of Liu W, et al.,1985,16 but it included also data from full-scale engine visualizations and other researchers.
In addition, Nakayama A, et al.,1999,11 presents another criterion identified by equation 4. All three datasets show excellent agreement. However, they all appear to be based on roughly the same data.
eq 4
Quantitative total pressure measurements at two velocity ratios under headwind conditions with both data points are presented in Nakayama A, et al.,1999.11 Their results contradicted all the thresholds above. More recently, a vortex formation map with a criterion being established for both headwind and crosswind configurations is presented in Brix S, et al., 2000,10 where quantitative measurements were taken within the intake duct using a rotating hot-wire.
Modes of vortex formation
There are three modes of vortex formation. These are;
- Quiescent (no-wind) mode,
- Headwind mode, and
- Crosswind mode.
Under quiescent (no-wind) conditions, the engine induces an external flowfield to the intake that emanates from all directions in the near proximity (Figure 3). The induced velocities immediately adjacent to the ground interact with the surface generating vorticity. This ’induced’ vorticity is the source for the vortex, and by definition, this formation mechanism requires no ambient vorticity. As described in Brix S, et al., 2000,10 under no-wind conditions, the flow behind and between the intake and the ground dominates. As a consequence, the vortex lines associated with this dominant flow are stretched and deformed as shown in Figure 4. This situation is very similar to the headwind mode except for the source of vorticity is associated with flow approaching from the opposite direction and is a direct consequence of the intake induced flowfield rather than the approaching flow.
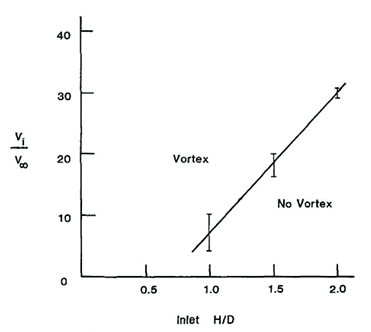
Figure 3 Regimes of vortex formation{El-Sayed, 2016 #1}.16
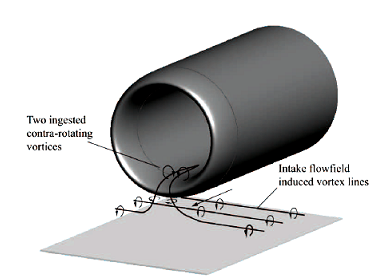
Figure 4 Vortex formation under quiescent condition.
Also, a consequence the vortices within the intake duct rotate in the opposite direction to that under headwind conditions. Since the formation mechanism is largely the same in comparison to headwind conditions, the vortices generated under quiescent conditions can be regarded as a flow mode of the headwind mechanism. This finding, in Brix S, et al., 2000,10 was purely based on flow visualization studies, and no quantitative measurements have been reported under such conditions.19,20
A quantitative verification for the findings in Brix S, et al., 2000,10 Murphy J, et al., 2011,21 Using Stereoscopic Particle Image Velocimetry (SPIV) the flow under quiescent conditions was quantitatively studied and two contra-rotating vortices were observed to form in accord with the flow topology presented in Figure 4. However, the flowfield was observed to be highly unsteady and often, only a single dominant vortex was observed. For the first time, quantitative measurements under quiescent conditions were presented which included fully averaged total pressure distortion measurements at the fan face. The vortices generated under quiescent conditions were observed to be weak but not insignificant.
Case study
The intake of a high bypass turbofan engine similar to the GE-CF6-50 engine is considered here. It is a subsonic intake and installed under the wing of the aircraft. The computational domain is a full-scale intake, intake-lip profile, and fan-nose arrangement. Such a complex domain needed some 4 million nodes to simulate the flow in the intake in different flight phases, namely, take-off/landing, climb, and cruise. Thermodynamic relations are used to investigate the overall performance of the turbofan-engine. These relations will be useful to illustrate the effect of intake performance and flight conditions on the overall engine performance. The new considerations would make the vortex line more significant compared with the previous researches.
Mathematical and computational analysis
This section describes the mathematical model and computational technique used in simulating three-dimensional full-domain unsteady intake flow. We are going to postulate the standard equations that govern the air flow in and in the vicinity of a turbo-fan engine intake (GE-CF6-50) while the engine is running. Auxiliary equations and turbulence model formula will also be given. Numerical manipulation and the computational scheme will be summarized ending with the computational code adopted in this work.
Governing equations
The basic aerodynamic equations are conservation of mass, momentum, and conservation of energy. These equations will be illustrated hereafter in the differential form.22 Also, there are some other auxiliary equations.
Continuity equation
The mass conservation equation for unsteady flow is given by:
eq 5
where;
: the absolute velocity in the direction
: the coordinate in the direction
: is the air density.
i : a tensor indicating 1, 2, 3.
Momentum conservation equations
The conservation of momentum equation in the direction for unsteady flow can be written as:
eq 6
Where p is the static pressure, and
is the viscous stress tensor given by
eq 7
where;
: is the absolute viscosity.
: are tensor indices indicating 1, 2, 3.
Energy conservation equation
The unsteady equation of conservation of energy is given by
eq 8
where;
E: is the total energy of the air.
K: is the air thermal conductivity.
Ji: is the diffusion flux of species in the direction.
The first three terms in the right-hand side of equation 8 represent the energy transfer due to conduction, species diffusion, and thermal energy created by viscous shear in the flow, respectively. The air total energy is given by
eq 9
and
is the specific enthalpy, given by
eq 10
where
= 298.15 K
Auxiliary equations
The density of an ideal gas is computed through the equation of state. Also, the air viscosity is computed according to the Sutherland viscosity law. The formula is specified for two or three coefficients. Sutherland’s formula with three coefficients is used in the present work, and it is expressed as:
eq 11
eq 12
For air at moderate temperatures and pressures,
,
,
. The relationships for the internal energy, e, and the static enthalpy h are:
eq 13
eq 14
where, T is the static temperature,
is the specific heat at constant volume and
is the specific heat at constant pressure, respectively.
Turbulence model equations
Turbulent flows occur at high Reynolds numbers, when the inertia of fluid overwhelms the viscosity of fluid, causing the laminar flow motions to become unstable. Under these conditions, the flow is characterized by rapid fluctuations in pressure and velocity which are inherently three-dimensional and unsteady.
Turbulence has a strong influence on continuity and momentum equations. For the present problem which has high values of Reynolds number, turbulent flow must be considered. There are several methods for studying turbulent flows;
- RANS (Reynolds Averaged Navier-Stokes Simulations), and
- LES (Large Eddy Simulations). The most popular models, extracted from RANS method, are; 1- standard k- , 2- RNG k- ,
- Kato-Lander k- , and
- Low-Reynolds number k- .
Unfortunately, it is the fact that no single model is universal for all problems. Therefore, turbulence model selection is needed. There are many factors that must be considered when selecting a turbulence model. The most obvious factors are;
- the physics of the flow,
- the level of accuracy required, and
- the available computational resources.
For the present problem and due to complex geometry, the standard model was the most suitable model to solve the present case study according to previous researches in the field. The model involves solutions of transport equations for turbulent kinetic energy and its rate of dissipation. The one adopted in CFD-RC-ACE+ is based on Launder and Spalding. In the model, the turbulent viscosity is expressed as:
. The transport equations for k and are:
eq 15
eq 16
The model constants
,
have the following default values:
. These default values have been determined from experiments.
This model needs two factors to be substituted in its two equations; namely,
- kinetic energy k,
- dissipation rate .
These two factors are needed to be determined at inlet and outlet boundary conditions of the computational domain.
A comprehensive investigation was needed to determine the values of turbulence intensity (k) and dissipation rate ( ) at inlet and outlet boundaries. At inlet, the boundary values of k and were taken as recommended in the code manual.22 Unfortunately, these values caused the code solver to diverge, i.e., no solution was obtained. Thus, the boundary values of k and were altered to find the optimum values that drive the code to converge. It was found that the optimum values for the present case study are as follows:
- turbulence kinetic energy, k= 0.4 m2/s2,
- turbulence dissipation rate, = 20 m2/s3.
Computational domain
Figure 5a shows the detailed dimensions of the present intake which is the intake for the CF6 aero-engine. Also, this figure is the side view of the intake. The present study is a three-dimensional (3-D) computational case as shown in Fgure 5b. The computational domain is taken as 6 times the fan diameter while the distance between the lower surface of intake and the ground is 1.8 m. This is to ensure that the boundary conditions is atmospheric, next the numerical code will calculate the flow details with the computational domain; Figure 6.
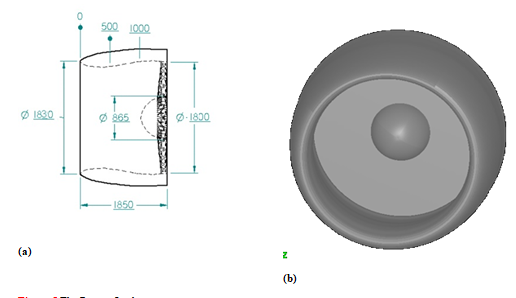
Figure 5 The Present Intake geometry.
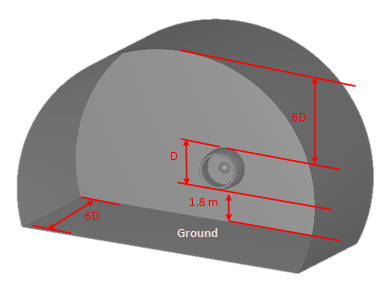
Figure 6 The Computational Domain with the Distances of Boundaries.
Grid generation
The computational grid of the domain of the intake is presented in Figure 7 and the overview of the mesh and the view is focused on the intake. The computational mesh contains of 28 subdomains, 3,898,344 cells, and 4,139,500 nodes.
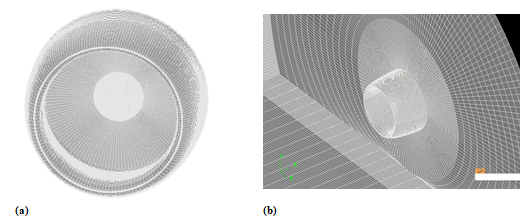
Figure 7 Mesh for the present intake; (a) focused on the intake, (b) general overview.
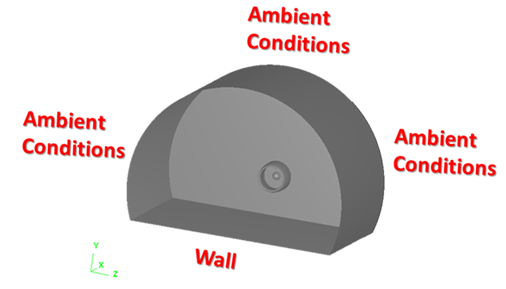
Figure 8 The Boundary Conditions of Computational Model.
Mesh number independence
Mesh sensitivity is performed gradually for about 1 million, 2 million, 3 million, 4 million, and 5 million nodes, respectively. Each case is tested by comparing it with the standard stream tubes through intake. About 4 million nodes (4,139,500 nodes) were the optimum mesh size.
Boundary conditions
For the case of flow simulation to aircraft on ground, the ground is defined as wall. Also, the ambient conditions are introduced to the code to solve the flow in the whole-domain. It is taken in the consideration that the total temperature through the domain is constant. Also, the aircraft speed is given to the code. Figure 8 shows a schematic drawing of the boundary conditions of the problem.
Initial conditions
The initial conditions for velocities are: The axial velocity u is set as the flight speed (m/s). The other velocity components v and w were set as 1 m/s. Also, pressure P and temperature T were assumed as ambient which is function of the altitude.
Time dependence
Because the vortex is an unsteady phenomenon, the use of unsteady or transient solution was a must. As in all computational studies, it was necessary to use a suitable time step to ensure numerical stability. By time-dependent study, a time step was tested as
and
. The first two values were refused since they cause numerical divergence, i.e., solution instability. A time step
was the optimum.
Computational run time
A super-computer 64 GB Intel® core TM 2 duo processor and 64 GB RAM was used. For unsteady (transient) solution, 23.5 hours was needed to solve only one time step.
Computational results at at ground conditions
Flow field characteristics are represented by the stagnation pressure and the vorticity contours on the fan face plane and near-ground plane for selected time steps. Velocity vectors on the near-ground plane were plotted, showing the flow field topology around each vortex.
The flow characteristics were investigated for various Mach numbers. The case of far-stream Mach number = 0.06 presented. The distributions of density, velocity, Mach number, static pressure, total pressure, static temperature, total temperature, and total enthalpy were presented, respectively, in each case. Also, enlarged distributions in the intake were presented.
Figure 9 focuses on the intake, showing the density distribution in more details. The figure also shows the density values on the fan nose (0.65 kg/m3) and the density at fan inlet (0.45 kg/m3).
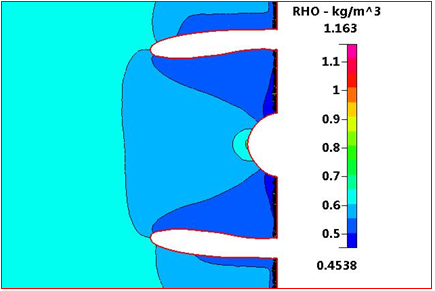
Figure 9 Density Distribution focused through intake at ground condition, M=0.06, and sea level.
Figure 10 focuses on the intake, showing the distribution of velocity magnitude in more detail. The figure also shows the velocity values on the fan nose vary from 80 m/s to 100 m/s with an average value of 90 m/s and the velocity magnitude at fan inlet varies from 160 to 186 m/s with an average value of 173 m/s.
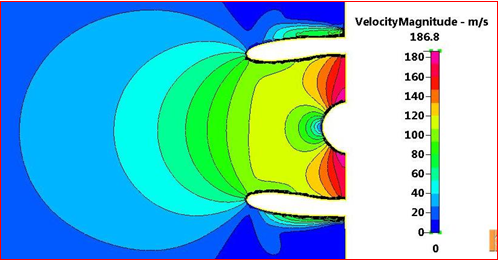
Figure 10 Velocity magnitude focused through intake at ground condition, M=0.06, and sea level.
Figure 11 focused on the intake, showing the distribution of Mach number in more detail. The figure also shows Mach Number values on the fan nose vary from 0.1 to 0.3 with an average value of 0.2 and the Mach Number at fan inlet varies from 0.45 to 0.6, with an average value of 0.53. Also, the figure shows the stagnation points at fan nose and intake lips have zero Mach number (zero velocity).
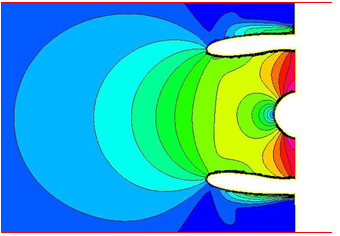
Figure 11 Mach number Distribution focused through intake at ground condition, M=0.06, and sea level.
Figure 12s focuses on the intake, showing the static pressure distribution in more detail. The figure also shows the static pressure values on the fan nose vary from 0.42 bar to 0.49 bar with an average value of 0.455 bar and the static pressure at fan inlet varies from 0.3 bar to 0.36 bar with an average value of 0.33 bar. Also, the figure shows the stagnation points at fan nose and intake lips have the highest static pressure.
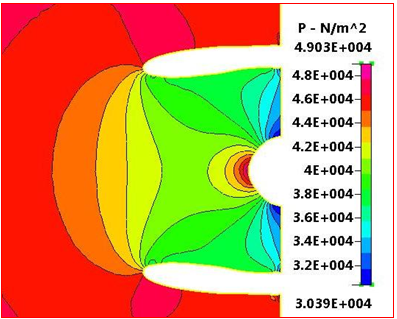
Figure 12 Static-pressure Distribution focused through intake at ground condition, M=0.06, and sea level.
Figure 13 focuses on the intake, showing the total pressure distribution in more detail. The figure also shows the total pressure values on the fan nose vary from 0.46 bar to 0.48 bar with an average value of 0.49 bar and the total pressure at fan inlet varies from 0.4 bar to 0.44 bar with an average value of 0.42 bar.
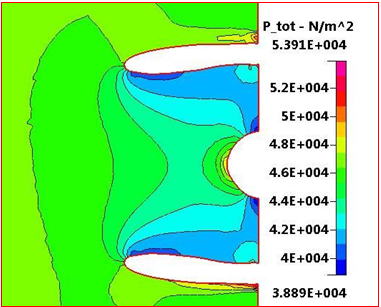
Figure 13 Total pressure distribution focused on intake at ground condition, M=0.06, and sea level.
Figure 14 focuses on the intake, showing the static temperature distribution in more detail. It also shows the static temperature values on the fan nose vary from 250 K to 260 K and the static temperature at fan inlet varies from 231 K to 240 K.
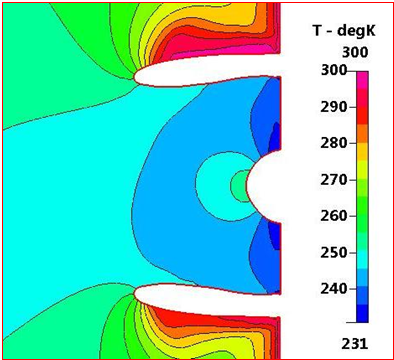
Figure 14 Static Temperature distribution focused through the intake at ground condition, M=0.06, and sea level.
Figure 15 focuses on the intake, showing the total temperature distribution in more detail. Also, it is shown the total temperature values on the fan nose vary from 260 K to 270 K and the total temperature at fan inlet is constant at 250 K. Also, the maximum total temperature at the leading edge and has a value of 300 K.
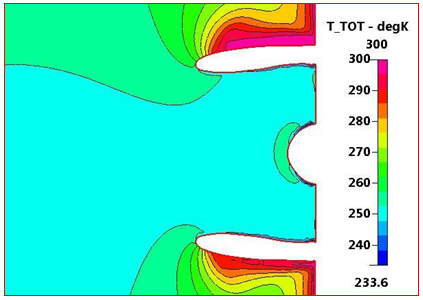
Figure 15 Total Temperature Distribution focused through intake at ground condition, M=0.06, and sea level.
Figure 16 focuses on the intake, showing the total enthalpy distribution in more detail. Also, this figure shows the total enthalpy values on the fan nose varies from 2.5
J/kg to 2.6
J/kg and the total enthalpy at fan inlet is constant at a value of 2.5 J/kg
(Figure 17 & 18).
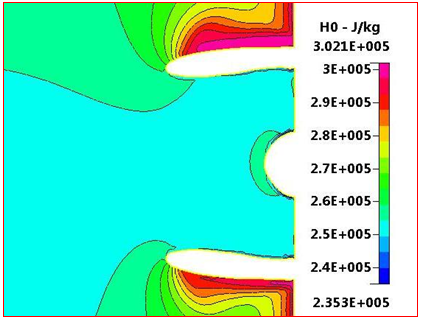
Figure 16 Total Enthalpy Distribution focused through intake at ground condition, M=0.06, and sea level.
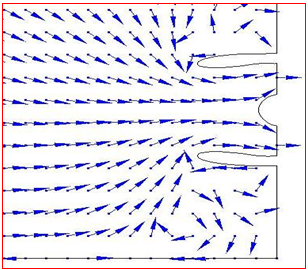
Figure 17 Ground-vortex streak lines focused through intake at ground condition, M=0.06, and sea level.
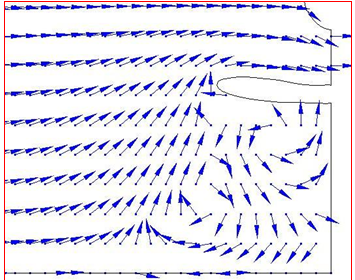
Figure 18 Ground-vortex streak lines focused through the lower half of intake at ground condition, M=0.06, and sea level.
Calculated intake parameters
The intake efficiency is calculated using the following equation:
eq 17
Equation 17 can be rearranged as:
eq 18
Now, we need to identify
,
, and
where
and
are the upstream total temperature and pressure while
and
are the outlet total temperature and pressure.
The intake pressure recovery (IPR), is calculate from the relation.
eq 19
For the ground case in which ground vortex is found, Figures 13 and 15, show that
and IPR=0.72. The intake efficiency is too small in the case of ground that because the absence of ground vortex which affect the flow in the intake.
From the previous calculation, new expression can be deduced. From aerodynamic correlations, precise value for intake efficiency and pressure recovery is obtained at different altitude and flight Mach number. This is summarized in Table 1.
|
|
|
|
Take-off/Landing
(vortex found)
|
|
Altitude (ft)
|
0
|
|
Mach Number
|
0.06
|
|
Calculated Efficiency
|
21%
|
|
Calculated IPR
|
0.72
|
Table 1 Calculated intake parameters at different flight phases
Vortex formation line
Table 2 describes the successive steps for drawing the vortex line. This procedure is as follows:
- At each height ratio, a first guess for the velocity ratio is chosen. The velocity-ratio value is chosen according to previous work.16 The value of the velocity ratio is varied until ground-vortex is found.
- Run the computational solver and check if the vortex is detected or not.
- Re-choose another value of the velocity ratio and repeat step
- till the starting the vortex formation.
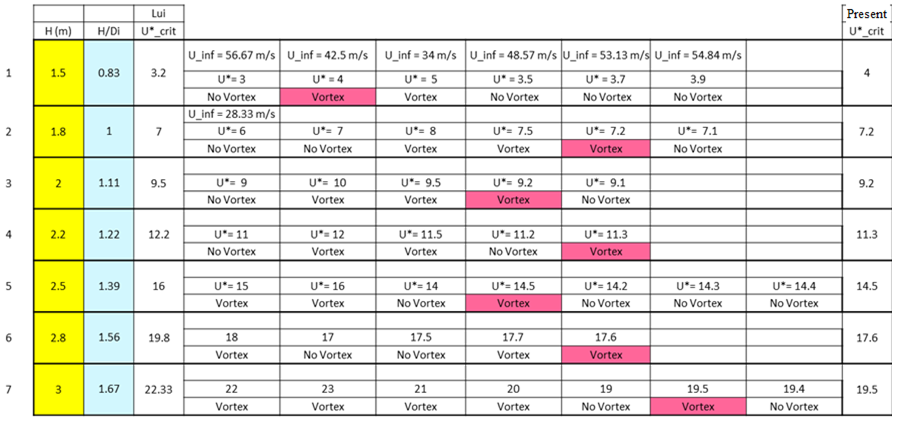
Table 2 ComparisonSequence to get the vortex line
Present study vortex map
The results are collected and presented in Figure 19 it shows the present vortex-line formation map. The solid circles denotes the occurrence of a vortex in this case, while the hollow circles denote the no-vortex occurrence. From this figure, a new correlation for the occurrence of the ground vortex is deduced between the height ratio and the velocity ratio. This correlation is:
eq 20
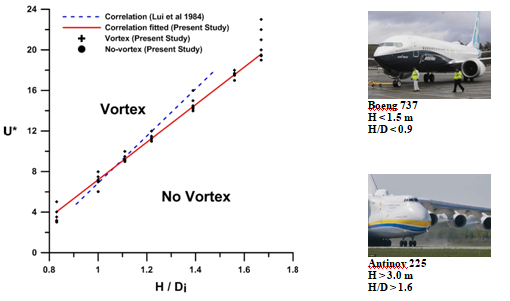
Figure 19 Present vortex map.
This correlation is useful for aircraft manufacturers to take into consideration the critical engine height. Also, important to pilots to know the optimum velocity suitable for his aircraft and then engine height.
Comparison with previous maps
Figure 20 shows the comparison between the present study and those by previous investigators,10,11,16,18 indicating the reasonable agreement in trends. It is seen that the present line is midway between that previous researches and also the line of Shin is the nearest line to the present study.
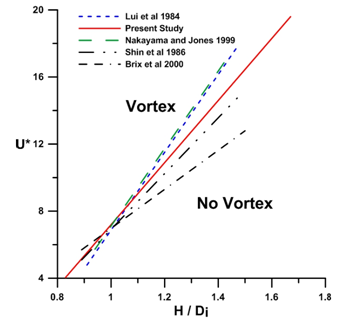
Figure 20 Comparison between the present vortex map and previous works.
Summary of the CFD results
Two main achievements are illustrated in this paper. The first one is the simulation of the flow variables over the intake during the ground operations. This simulation helps in detecting and understanding the behavior of flow within and around the intake at take-off/landing conditions. Also, both intake efficiency and IPR are calculated precisely.
The second one is the drawing of a new vortex formation line (Figure 19) or obtaining a new empirical relation that relates the velocity ratio with the intake height ratio (equation 20).
Conclusions
Intake attract interest in researchers including.23,24 From the present work, the following conclusions may be drawn:
- A three-dimensional full-scale domain and Actual Intake Lip Geometry and Fan Nose must be taken into consideration in generating a computational grid such as the present on. The grid contains about 4 million nodes arranged in 28 sub-domains (blocks).
- The presence of Ground vortex may be detected by time Simulation.
- An empirical relation was derived for the vortex-formation line (relation between the velocity ratio and the height ratio).
- The flow parameters (density, static pressure, total pressure, static temperature, total temperature, velocity magnitude, and total enthalpy) distributions are useful in understanding the performance during ground operation.
Two important achievements are deduced in the present study which are:
- The precise value for intake efficiency and pressure recovery is obtained at ground operation (Table 1).
- New considerations are taken in the mathematical approximation of the aerodynamic model. These considerations are the full-scale approach, intake-lip profile, fan inlet, and fan-nose. According to these new considerations, the new correlation determine a new vortex map for the intake as equation 20.
Funding
Acknowledgments
Conflicts of interest
The authors declare that there was no conflict of interest.
References
- Rodert LA, Garrett FB. Ingestion of foreign objects into turbine engines by vortices. NACA Technical Notes. 1955.
- Glenny D, Pyestock N. Ingestion of debris into intakes by vortex action. N.G.T.E. Report. 1970.
- Johns C. The aircraft engine inlet vortex problem. AIAA's Aircraft Technology, Integration, and Operations (ATIO) 2002 Technical Forum. 2002:5894.
- Motycka DL. Ground Vortex-limit to Engine-reverser Operation. Journal of engneering for gas turbines and power. 1975:52–52.
- Mare LD, Simpson G, Sayma AI. Fan forced response due to ground vortex ingestion. ASME Turbo Expo: Power for Land, Sea, and Air. 2006:1123–1132.
- Green J. Forced response of a large civil fan assembly. ASME Turbo Expo: Power for Land, Sea, and Air. 2008:685–692.
- Trapp LG, Motta Girardi RD. Crosswind Effects on Engline Inlets: The Inlet Vortex. Journal of aircraft. 2010;47(2):577–590.
- Secareanu A, Moroianu D, Karlsson A, et al. Experimental and numerical study of ground vortex interaction in an air-intake. 43rd AIAA aerospace sciences meeting and exhibit. 2005.
- Trapp LG, Girardi R. Evaluation of engine inlet vortices using CFD. 50th AIAA Aerospace Sciences Meeting including the New Horizons Forum and Aerospace Exposition. 2012.
- Brix S, Neuwerth G, Jacob D. The inlet-vortex system of jet engines operating near the ground. 18th applied aerodynamics conference. 2000:3998.
- Nakayama A, Jones J. Correlation for formation of inlet vortex. AIAA journal. 1999;3:508–510.
- Bharani S, Singh S, Seshadri V, et al. Effect of angle-of-turn on the performance of divided intake ducts. Proceedings of the Institution of Mechanical Engineers, Part G: Journal of Aerospace Engineering. 2004;218:23–31.
- Funk P, Parekh D, Smith D, et al. Inlet vortex alleviation. AIAA. 2001.
- Motycka DL. Ground Vortex-Limit to Engine-Reverser Operation. Journal of engneering for gas turbines and power. 1975;98(2):52–52.
- Siervi FD, Viguier H, Greitzer E, et al. Mechanisms of inlet-vortex formation. Journal of Fluid Mechanics. 1982;124:173–207.
- Liu W, Greitzer E, Tan C. Surface static pressures in an inlet vortex flow field. Journal of engnieering for gas turbines and power. 1985;107(2):387–393.
- Greitzer E, Tan C. Surface static pressures in an inlet vortex flow field. Journal of engineering for gas turbines and power. 1985;107:387.
- Shin H, Greitzer E, Cheng W, et al. Circulation measurements and vortical structure in an inlet-vortex flow field. Journal of Fluid Mechanics. 1986;162:463–487.
- El-Sayed AF. FOD in Intakes–A Case Study for Ice Accretion in the Intake of a High Bypass Turbofan Engine.
- Murphy J, MacManus D, Mishra N. Intake Ground Vortex Aerodynamics. Proceedings of the institution of mechanical engineers, Part G: Journal of areospace engineering. 2008;226(11):1387–1400.
- Murphy J, MacManus D. Inlet ground vortex aerodynamics under headwind conditions. Aerospace science and technology. 2011;15:207–215.
- El-Sayed AF. Lecture Notes: Computational Fluid Dynamics. 2001.
- El-Sayed AF. Aircraft Propulsion and Gas Turbine Engines. CRC press Taylor and Francis Group. 2017.
- Jan-Hendrik K, Lennart Harjes, Philip Frantzheld, et al. Atmospheric Crosswind Tests Of Aspirated Jet. Global Power and Propulsion Forum. 2019.

©2020 El-Sayed, et al. This is an open access article distributed under the terms of the,
which
permits unrestricted use, distribution, and build upon your work non-commercially.


