eISSN: 2473-0815


Research Article Volume 13 Issue 1
Professor, Colleges of Medicine and Graduate Studies, University Of Science Arts and Technology, USA
Correspondence: Orien L Tulp, Professor, Colleges of Medicine and Graduate Studies, University Of Science Arts and Technology, Montserrat, USA, Tel +727-252-6210
Received: February 20, 2025 | Published: March 7, 2025
Citation: Tulp OL. Effects of epigenetic predisposition of obesity on expression and progression of diabetes in the corpulent rat. Endocrinol Metab Int J. 2025;13(1):18-22. DOI: 10.15406/emij.2025.13.00364
To determine the effects of aging, early onset obesity, and genetic predisposition on the progression of glycemic parameters, groups of congenic male lean, obese, and obese-diabetic rats (n= 5-6 rats/group) that share the same genetic trait for obesity (the -cp trait) were reared under normal laboratory conditions and feed Purina Rodent chow ad libitum throughout. Rats were subjected to measures of fasting glucose, insulin, and amylin and glycated hemoglobin and on the glycemic response to an oral glucose tolerance at 4 and 12 months of age. Obese animals weighed more than their lean littermates. Fasting plasma glucose, insulin, and amylin concentrations of obese > lean, in increased further in T2DM-prone animals, with the greatest increases in the oldest animals. Hemoglobin A1C trended higher in obese than in lean littermates and was markedly greater in the NIDDM-prone animals of both ages. Oral glucose tolerance of obese > lean, and was markedly greater in T2DM-prone animals, with the greatest increase in the oldest animals. The area under the glucose curve was greater in obese than lean littermates and increased significantly on T2DM-prone animals at both ages. In conclusion, these results demonstrate the effects of the obese trait on development of insulin resistance may occur independently of T2DM in these closely related congenic strains.
Keywords: obesity, epigenetic expression, obesity, diabetes, rat, glycemic parameters
The incidence of obesity and its associated comorbidities is rapidly approaching epidemic proportions in much of industrialized society, where it tends to occur following factors of dysregulated diet and lifestyle along familial lines.1–4 While the development of insulin resistance and adult-onset diabetes, also commonly known as Type II diabetes (T2DM) rank among the most common complications of the obese state, not all individuals who develop obesity also develop T2DM, suggesting that there may be independent links for the two common manifestations of obesity. Thus the development of insulin resistance while a hallmark of T2DM, implicates factors that may not be directly or universally-linked to T2DM. Insulin sensitivity vs insulin resistance involves activities of the glucose transporter protein, GLUT4, formed in the endoplasmic reticulum of somatic cells.5,6 Once formed, the transporter undergoes intracellular cytoplasmic translocation to the plasma membrane, where it facilitates the stereospecific, insulin-dependent transmembrane uptake of molecular glucose. Hormonal factors including glucocorticoids, a common complicating element of obesity and metabolic syndrome impair the genomic expression and cellular availability of GLUT4, thereby impeding glucose uptake in peripheral tissues, and further contributing to insulin resistance.7,8 The cumulative effect of these factors contributes to the development and progression to the aberrant metabolic parameters of hyperinsulinemia and insulin resistance common to both obesity and T2DM stigmata. Hyperinsulinemia further contributes to obesity and to the genomic expression of T2DM in susceptible individuals.7
Treatment of both obesity and T2DM once diagnosed typically encompasses lifelong investments of efforts and resources that include diet, lifestyle and pharmaceuticals for successful outcomes.9 Introduction of healthful dietary changes as a first option are often a challenge to implement, as the pathophysiologic changes that may progress to more serious health issues typically occur gradually, and are often asymptomatic in the early stages of disease progression when preventive measures might have yielded the most successful results. Thus by the time their progression becomes physiologically and symptomatically apparent, the magnitude of disease has likely advanced, and more aggressive therapeutic measures may be necessary to arrest, resolve, or reverse further progression.9
The development of the corpulent rat strains enabled new insights into the genomic and physiological mechanisms that contribute to the development of obesity and T2DM.10–12 The LA/Ntul//-cp and SHR/Ntul//-cp rat models were developed in the small animal genetics laboratory at the NIH by Hansen et al, who incorporated the genomic obesity -cp trait originated from the Koletsky rat.13 The trait was bred into a longevity-prone NIH (N) strain of unknown origin, followed by backcrossing the new N-cp strain 12 or more breeding cycles to attain a congenic status in the newly established LA/N-cp strain, where the only prevailing trait of the new strain was the expression of the obesity trait.10–12 The -cp trait was then bred into the spontaneously hypertensive rat (SHR) in a similar manner, and also followed by completing 12 or more cycles of backcrossing sufficient to establish congenic status while preserving the SHR and -cp traits.10 The hypertensive trait was preserved only in the lean phenotype while the T2DM developed soon after weaning in the obese phenotype of this strain. The newly developed SHR/N-cp strain preserved the albino coat of the SHR strain, while the LA/N-cp strain preserved the agouti coat of the original NIH strain. Both obese phenotypes exhibit a significantly decreased lifespan due to complications of obesity and T2DM respectively when compared to their longevity-prone NIH (N) heritage.10,12,14 The addition of the [//tul-cp] identifier in the nomenclature was later assigned by the NIH to clarify the current distinctive sub-colony of these strains that may have evolved from different backcrosses and sub-colonies reared elsewhere.11,15 Thus, the purpose of the present study was to characterize the expression of the obese and T2DM traits in the development of T2DM when reared under identical conditions of diet and environment.
Animal subjects and Housing. Male animals were selected from the Drexel colony of LA/Ntul//-cp and SHR/Ntul//-cp rats at 4 months of age and separated into lean and obese groups based on developing characteristics of the emerging obese or obese+T2DM/NIDDM state (n=5-8 rats/group). Developmental changes included subtle early changes in gait, stance, palpable subcutaneous fat and resting VO2. Selected animals were placed in shoebox cages lined with one inch of pine shavings, in a temperature (22-24C) and humidity controlled (50-60%RH) environment from weaning and thereafter. Animals were fed Purina Chow #4012 and house water ad libitum throughout the study. The Purina chow had a reported energy density of 3.34kcal/gram (14.2kjoules/gram) based on the manufacturer’s certificate of analysis and contained (w/w) 55.6% carbohydrate, 22.5% protein, 4.5% fat, 4.6% crude fiber, 6% ash, and 1-2% essential vitamins and minerals and <5% moisture. Specific nutrient sources cited in the Purina Chow included ground extruded yellow corn, soybean meal, fish meal, cane molasses, wheat middling, alfalfa meal, ground oats, brewer’s dry yeast, wheat germ meal, dried beet pulp, soybean oil, dicalcium phosphate , calcium carbonate, salt, and a blended vitamin supplement containing B-12, calcium pantothenate, choline chloride, riboflavin, thiamin, niacin, DL-methionine, D-activated animal sterol as a source of Vitamin D3, vitamin A, pyridoxine hydrochloride, vitamin E, calcium iodate, manganous oxide, ferrous carbonate, cobalt carbonate, copper sulfate, zinc sulfate, and zinc oxide. This diet has been deemed a complete life cycle diet especially formulated to support the healthful growth, development, and maintenance of rats, including reproduction and lactation, and has been a standard rodent diet for biomedical research worldwide for many decades. Importantly, this diet has not been found to independently induce characteristics of obesity or T2DM in rodents.
Experimental Procedures: OGT administration and process. Animals were administered a 5-point oral glucose tolerance test (OGT) after a brief 4-hour period of food depravation, with free access to house water throughout. The glucose challenge containing 250 mg glucose/0.1 kg of body weight as a 50% glucose solution and administered gently via intra gastric gavage over an approximate 30 second to one minute duration during the forenoon hours (1000-1200hr). Bloods were obtained before (i.e., fasting) and after 30, 60, 90, and 120 minutes following the intragastric glucose challenge.16 Blood glucose concentrations were determined and recorded immediately after the blood draws with a rapid glucose oxidase method (Glucometer Elite®, Ames Laboratory, Elkhart IN).17 The glucose area under the OGT curve (AUC) was determined as described by Tulp et al as modelled after the procedure originally described by Sagakuchi and used in our laboratory for many years.18 Plasma concentrations of Insulin and amylin were determined via radioimmunoassay using materials obtained from Penninsula Laboratories, Pomona CA.19 Hemoglobin A1C was determined spectrophotometrically following micro column resin separation of hemoglobin fractions using commercially prepared reagents and materials obtained from Sigma Chemical Company, St Louis, MO, USA.20 Data were analyzed via standard statistical procedures with the Stat view program, Abacus Concepts Berkley CA) and graphics accomplished with the Prism program (Prism Academy, San Diego, CA). The protocol and all experimental procedures were approved by the Institutional care and use committees prior to the conduct of this study.
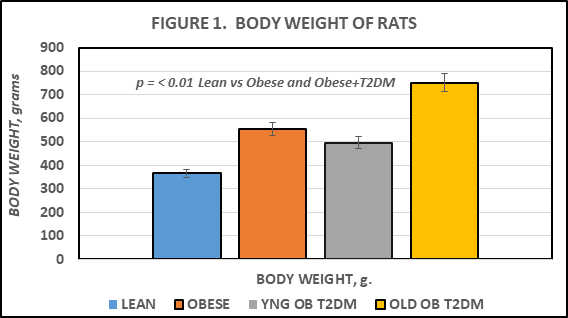
The effects of strain and phenotype on final body weight are depicted in Figure 1 and indicate that obese rats weighed more than their lean littermates at 4 months of age, and that the final body weights of the obese+T2DM increased further with advancing age. On note, the obese+T2DM animals had approached their maximum longevity at 12 months of age, with only 5 rats bearing the obese-T2DM phenotype rats remaining from the original cohort of 8 rats (Figure 1).

Figure 1 Effects of phenotype and age on body weight in corpulent rats. Data are mean ± 1 SEM, n=5-8 rats/group. P = < 0.01 for phenotype. YNG = young, age 4 months; OB = obese; T2DM = type 2 diabetes mellites.
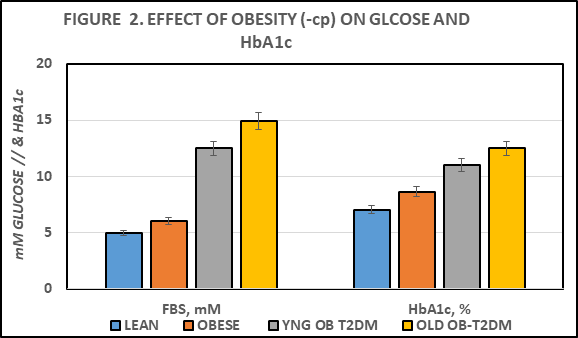
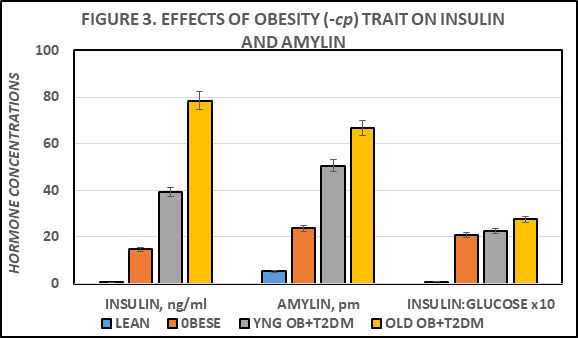
Fasting blood glucose and plasma insulin, amylin and glycated hemoglobin concentrations are depicted in Figures 2 and 3, and indicate that all 4 parameters were greater in the obese than the lean phenotype, and that the glycemic parameters were increased significantly further in the obese+T2DM animals. The Insulin: Glucose ratios in the obese phenotype were indicative of insulin resistance. While the magnitude of obesity and the Insulin to glucose ratios in both young and older SHR/Ntul//-cp rats were modestly greater than in the LA/Ntul//-cp rats, only the SHR/Ntul//-cp strain demonstrated glycosuria and highly elevated HbA1c, consistent with the development of Type-2 diabetes by 4 months of age (Figure 2).

Figure 2 Effect of phenotype and age on fasting blood glucose (FBS) and glycated hemoglobin (HbA1c). Data are mean ± 1 SEM, n=5-8 rats/group. P = < 0.05 for phenotype in obese; p = < 0.01 for phenotype in T2DM.
The effects of genotype on fasting Insulin, Amylin, and on the Insulin to Glucose ratio as an indicator of insulin resistance are depicted in Figure 3, and indicate that expression of the -cp trait in the LA/Ntul//-cp strain resulted in significant increases in both fasting insulin and amylin concentrations, with a significant increase in the insulin: glucose ratio. The insulin and amylin parameters were further increased in the obese-SHR/Ntul//-cp strain, with only a modestly greater impact on the insulin: glucose ratio (Figure 3).

Figure 3 Effect of phenotype and age on fasting blood insulin and amylin. Data are mean ± 1 SEM, n=5-8 rats/group. P = < 0.01 for phenotype in obese and T2DM. * = p = < 0.05; ** p = < 0.01.
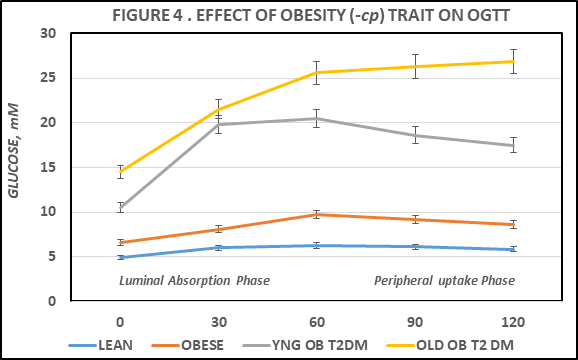
Measures of a standard 5 point oral glucose tolerance were performed in all animals and are depicted in Figure 4 below. The glycemic response in the lean animals was typical of a healthy, non-diabetic state. In contrast, the OGT responses in the obese phenotype were indicative of an impaired glycemic response to a standard oral glucose load (250 mg glucose/100 g of body weight) at all time points from 30 minutes of post ingestion. In the absence of insulin resistance, the plasma glucose would be expected to peak by 60 minutes post ingestion, and to return to near fasting levels within 2 hours post administration. In contrast, the plasma glucose concentrations in the obese-T2DM SHR/Ntul//-cp strain were significantly elevated at all points from fasting to 2 hours post ingestion, and were further elevated in the old vs the younger animals, indicative of a progressively greater magnitude of insulin resistance and glucose intolerance with aging. The area under the OGT curves are depicted in Figure 5, and indicates that the AUCglucose in the obese phenotype of the LA/Ntul//-cp strain was significantly greater than in their lean littermates, and that the AUCglucose in the SHR/Ntul//-cp strain was increased yet further, despite similarity in the age and the magnitude of obesity in both strains at 4 months of age. In contrast, the AUCglucose in the aging animals of the SHR/Ntul//-cp strain was increased even further to near extreme levels, indicative of increasing magnitude of glucose intolerance with aging in that strain. Of interest, in obese and young obese+T2DM rats, the plasma glucose concentrations declined partially by 120 minutes pot ingestion, while in lean animals the 120 minute plasma glucose concentrations had returned to fasting levels as anticipated (Figure 4–6).

Figure 4 Effect of phenotype and age on oral glucose tolerance (OGT). Data are mean ± 1 SEM, n=5-8 rats/group. P = < 0.05 for phenotype in obese; p = < 0.01 for phenotype in T2DM. * p = < 0.05; **p = < 0.01.
The effects of aging, early onset obesity, on the progression of glycemic parameters and the genetic predisposition for T2DM were determined in strains of congenic male lean, obese, and obese-diabetic rats that share the same genetic trait for obesity (the -cp trait) but epigenetically expressed in different genetic backgrounds.19–22 While early onset obesity occurred in both strains, the further development of T2DM occurred only in one strain, suggesting that the traits for obesity and T2DM while often linked, may occur independently when expressed in genetically different backgrounds. In the LA/Ntul//-cp strain, the healthful, longevity-prone NIH strain of Lister Albany rats provided the background genome to accommodate the -cp trait, while in the SHR/Ntul//-cp strain, the Spontaneously hypertensive rat (SHR) provided the background genetics for the -cp trait. Of interest, neither background strain investigated in the present study has been noted for expression of T2DM, and which symptoms became readily evident only in the SHR background consuming a standard rodent diet after incorporation of the obesity (-cp) trait. The stock Purina rodent chow diet consumed in this investigation has been noted to provide a complete, balanced nutrition diet for rats throughout their lifespans, and has been utilized widely in research environments without inducing evidence of obesity or T2DM stigmata for many years. Thus, the results reported in this study are in contrast to high fat contents or other dietary variations sometimes utilized to induce adiposity or glucose intolerance in other rodent models.23
In the present investigation, evidence of fasting hyperglycemia, elevations in glycated hemoglobin, or abnormal glycemic responses to an oral glucose tolerance in the obese phenotype of the LA/Ntul//-cp rat were modest and were indicative of modest insulin resistance only. Despite a similar magnitude of obesity to that observed in the age-matched obese phenotype of the T2DM SHR/Ntul//-cp strain.
Accelerated gastric emptying is a common observation in T2DM. The increase in plasma glucose during the first 30 to 60 minutes following glucose administration as an indicator of gastric emptying can be estimated by the slope of the OGTT curve during the initial phase of the OGTT.9,24 As such, measurement of this parameter can serve an indicator of the overall rate of luminal absorption of glucose and its subsequent entry into peripheral circulation.9 Luminal glucose uptake occurs independently of plasma insulin and of insulin-dependent GLUT4 glucose transporters.7 Thus, luminal glucose uptake occurs virtually immediately after the ingested glucose moieties enter the upper regions of the duodenum, and prior to the timing that the majority of peripheral glucose uptake can occur. In the lean animals, the net increase in plasma glucose averaged ~1.1 mm, while in obese littermates the average was slightly greater at ~1.54 mm in plasma glucose. This modest increase could be explained in part by the modestly greater dosage (250 mg/100 g of body weight) of glucose administered based on the greater body weights of the obese vs. their lean littermates in this study. In contrast, in similar-aged and similar weights of obese SHR/Ntul//-cp rats, the mean increase in plasma glucose concentrations averaged 9.3 mm, approximately 6-fold greater than occurred in the non-T2DM obese LA/Ntul//-cp strain, and more than 8-fold greater than occurred in similar aged lean rats. The average increment in the 0- to +30 minutes post glucose ingestion the older obese-T2DM was similar and plasma glucose concentrations in that group continued to increase throughout the duration of the OGTT and failed to return to pretest concentrations. In contrast, in lean animals the 120-minute glucose concentrations had returned to their fasting, pre-glucose ingestion levels, and represented the only group that was observed to fully do so. Thus, these observations are suggestive of an accelerated rate of gastric emptying in the obese and obese-T2DM phenotypes, with a significantly greater increase in gastric emptying in the T2DM animals at both ages studied. The hormone amylin is normally consecrated with insulin and impacts on amylin receptors in the antrum of the stomach, where it functions at least in part, to modulate the rates of gastric emptying.24,25 The elevations in plasma amylin in the obese and obese-T2DM animals is consistent with a state of amylin resistance, of similar magnitude to that which occurs in hyperinsulinemia in obese and obese-T2DM states.25,26
The results of the current study are also consistent with the development of insulin resistance in peripheral tissues, including skeletal muscle and adipose tissue, two of the primary tissues linked to the phenomenon of insulin resistance.5–8 The peak plasma glucose levels in the lean, obese, and younger obese-T2DM groups all peaked after 60 minutes, while the plasma glucose concentrations in the old obese T2DM rats continued to increase throughout the entire 120 minutes of observation, consistent with a greater magnitude of insulin resistance and possible onset of age- and T2DM-related gastroparesis in the older diabetic animals. The overall magnitude of peripheral insulin resistance is consistent with the insulin to glucose ratios in the obese groups, in addition to the HOMA27 values computed from the analytical data of each group, and was greatest in the older obese T2DM animals, consistent with the continued elevations in plasma glucose at 60, 90 and 120 minutes post ingestion among the older obese animals of the SHR/Ntul//-cp strain.
Thus, the results of this study provide evidence for an impaired mechanism for gastric emptying following an orally-administered glucose meal in the obese-T2DM animals, and for impaired plasma glucose clearance during the post-absorptive, luminal phase of glucose uptake and distribution in peripheral tissues. Moreover, the results of this study are consistent with independent genomic-linked factors to facilitate the expression of obesity and obesity associated T2DM in rats, in that T2DM was not observed in the longevity-prone obese LA/Ntul//-cp strain In contrast, T2DM was evident in all obese SHR/Ntul//-cp rats, animals that share the same genomic -cp trait for obesity but are epigenetically expressed in different background strains, similar to that which was observed in an early cohort of the WKY/N-cp strain and independently of specialized dietary contributions.28–30
The results of this study indicate that the genomic and hormonal factors that predispose to the stigmata of obesity and T2DM while often occurring in concert, may also occur individually. The separation of the two disorders is likely dependent at least in part on the heritable background traits for epigenetic expression of the two disorders. The obesity as characterized by the congenic development of the -cp trait, is strongly associated with the development of insulin resistance, which may contribute to aberrant generation and actions of the GLUT4 glucose transporter factor in peripheral, insulin-sensitive tissues.7,8 The GLUT4 transporter is an essential element in the mechanism of insulin-dependent cellular glucose uptake in peripheral tissues, and is likely impaired in both demonstrations of the corpulent or -cp trait. Moreover, once developed as T2DM, the magnitude of insulin resistance, impaired glucose tolerance and the pathophysiological comorbidities commonly associated with advanced T2DM became more severe in the oldest animals surveyed. While the illustration of accelerated gastric emptying was not a primary objective of this study, the exaggerated increments in plasma glucose concentration following a glucose meal were consistent with the presence of accelerated gastric emptying in the obese-T2DM rats of both ages. In aging, non-diabetic LA/Ntul//-cp rats, the obese phenotype typically survived uneventfully to 2 years or more, and their lean littermates up to 4 years duration. Thus, the additive nature of the T2DM likely contributed to the earlier demise apparent in the obese-T2DM animals of the present investigation. The expression of T2DM has not been observed in the LA/Ntul//-cp strain, regardless of the diet consumed. In contrast, the progression from obesity to T2DM in the SHR/Ntul//-cp strain commonly occurs soon after puberty, independent of the composition of the dietary formula offered.
The author thanks the University of Science Arts and Technology for the resources to prepare this manuscript.
The author reports no competing interests. USE of Artificial Intelligence. The author reports that no applications of AI were utilized in the generation of this manuscript.

©2025 Tulp. This is an open access article distributed under the terms of the, which permits unrestricted use, distribution, and build upon your work non-commercially.