eISSN: 2373-6372


Research Article Volume 13 Issue 6
Colleges of Medicine and Graduate Studies, University of Science Arts and Technology, Montserrat, British West Indies, MSR 1110, USA
Correspondence: Orien L Tulp, Colleges of Medicine and Graduate Studies, University of Science Arts and Technology, Montserrat, British West Indies, USA
Received: November 03, 2022 | Published: November 17, 2022
Citation: Tulp OL. Effect of dietary carbohydrate type, biological sex and phenotype on glycemic responses in wistar fatty rats. Gastroenterol Hepatol Open Access. 2022;13(6):214-219. DOI: 10.15406/ghoa.2022.13.00526
To determine the effects of dietary carbohydrate type, biological sex, and phenotype on systemic glycemic responses in a rat strain that Is highly predisposed to development of obesity+NIDDM, groups of adult male and female lean and obese Wistar Fatty Rats were fed nutritionally complete isoenergetic diets containing 54% carbohydrate as cornstarch (ST) or sucrose (SUC) plus other essential nutrients, vitamins, and minerals from 22 until 30 weeks of age. Measures of body weight gain (BWG), Food efficiency ratio (FER), intraperitoneal Glucose Tolerance (ipGTT), fasting insulin to glucose ratios (I: G), and area under the glucose curve (AUC) determined. Results demonstrated that BWG and FER of obese >> lean and was further increased in both phenotypes when fed the SUC diet. The ipGTT responses of obese > lean in both sexes, and that substitution of SUC for ST markedly exaggerated the glycemic responses and glycosuria in both sexes. Fasting of insulin concentrations were greater in obese male than obese female, were further increased when fed the SUC diet and were significantly greater in the obese than occurred in the lean phenotype of either sex. Fasting glucose concentrations of male obese+NIDDM were elevated but remained within normal limits in the remaining groups. The I:G ratios were greatest in Obese+NIDDM male rats, intermediate in the obese+NIDDM female rats, and were within normal range in both lean groups on ST and SUC diets and the AUC of obese > lean of obese sexes and was further increased when fed the SUC diet in both sexes. These results confirm that feeding a high glycemic index sucrose rich diet enhances the efficiency and amount of weight gain and exacerbates the aberrant glycemic responses during ipGTT in the obese+NIDDM phenotype.
Keywords: obesity, phenotype, sex, carbohydrate type, glucose tolerance, rats
NIDDM, non-insulin dependent, adult onset diabetes mellitus; DRTC, Indiana diabetes research center training core laboratory; CS, cornstarch sucrose; AUC, area under the curve
The factors of diet and environment are major contributors to the burgeoning prevalence of obesity and its pathophysiologic sequelae including the development of non-insulin dependent, adult onset diabetes mellitus (NIDDM) in Westernized society.1-3 While total calories consumed are a significant contributing element in individual energy balance, the nutritional composition of the caloric intake also impacts on nutritionally and hormonally mediated aspects of metabolism that may further exacerbate the efficiency of luminal digestion and absorption, energy utilization and storage, the regulation of energy balance and when consumed in excess of metabolic requirements, in the progression of pathophysiologic sequelae including overweight, obesity and NIDDM.4,5 Over the past several generations, the domestic food supply including dietary choices have undergone considerable change from those available to our ancestors, with the introduction of an abundance of safe and generally nutritious preprocessed foods, in addition to an ever-growing availability of high energy, ready-to-consume items. While overall caloric intake of many individuals may not have changed significantly over the generations, the macronutrient and micronutrient composition of the calories has undergone a progressive change toward greater proportions of salt, simple vs. complex carbohydrates, and inclusion of certain fats which alone or in combination tend to increase the palatability of many food choices and add to an efficiency of caloric retention and weight gain by the unsuspecting consumers.6 In addition, the overall level of energy expenditure appears to have become less intensive due to the many energy saving conveniences now present following the modernization of the home and workplace which now combine to enable more time for leisure and energy conservation than our ancestors may have been able to enjoy.
The Wistar Fatty Rat represents an animal model of obesity+NIDDM, where the obese phenotype occurs as the result of an autosomal recessive epigenetic trait and occurs in one quarter of the offspring of breeding pairs that are heterozygous for the obese trait.7-11 Obesity develops in both male and female offspring and becomes visible evident in the early postweaning period of growth and development. Obese animals are highly predisposed for the development of NIDDM and progressive increases in the magnitude of insulin resistance by adolescence. Thus, this rodent strain is a suitable rodent model to investigate the metabolic impact of variations in the glycemic responses when administered simple vs complex carbohydrate diets in an otherwise nutritionally adequate regimen.
Dietary sources of carbohydrates have always contributed an important portion of the human diet, where they may occur as simple mono- and disaccharides including glucose (dextrose) and sucrose, respectively, and more complex polymeric sources including starches, fructans and others.12 The luminal hydrolysis of simple carbohydrates to their simplest monomolecular form of glucose and fructose occurs rapidly in the upper regions of the small intestine via α-glucosidases, where they may be absorbed into the circulation in their entirety often within 30-45minutes post ingestion.13 The monosaccharide moieties derived from more complex and polymeric forms including starches undergo luminal digestion more slowly, however, as the α-glucosidase and sucrase activity only hydrolyzes the glucose polymers from the distal glucose residues or the glucose from the fructose moieties respectively, giving rise to an attenuation and prolongation in the rate of monosaccharide absorption and a subsequent flattening of the insulin response kinetics when consuming complex vs. simple CHO in the diet. Thus, the substitution of complex vs simple carbohydrate sources is an important determinant in the magnitude of the glycemic and insulinogenic responses to carbohydrate meals in overweight, obese and NIDDM conditions and which favors an improvement metabolic control, including the subsequent magnitude of insulin resistance that may be generated over time by the CHO regimen. The luminal absorption of monosaccharides once generated occurs rapidly without hormonal actions, while most peripheral tissues including skeletal muscle and adipose tissue are dependent on insulin actions for glucose uptake to occur, and in the presence of insulin resistance, delays the rate of glucose uptake in peripheral tissues.12-14
The administration of a glucose tolerance test following a standardized dosage of glucose is among the most common laboratory assays to assess the status of glucose disposal and insulin resistance in peripheral tissues.16 The slope of the glucose curve observed first 30-45 minutes following the administration of the glucose load corresponds to the rate of intestinal luminal glucose uptake following an orally administered glucose challenge, while the first 30minutes following an intraperitoneally administered dose of glucose reflects the systemic uptake from abdominal tissues, and may attain greater plasma concentrations than orally administered glucose due to the more rapid delivery to absorptive surfaces, in addition to a greater surface are of absorptive tissues.17 The remaining segments of the curve from 45 to 60 minutes going forward are representative of the rate of tissue uptake in peripheral tissues from the plasma, many of which require insulin action to facilitate the transition of the glucose moieties from the extracellular to the intracellular location. Thus, the efficacy of glucose disposal during the last hour of the glucose tolerance is reflective of the availability of membrane associated insulin dependent GLUT4 transporters, and the magnitude of insulin sensitivity or insulin resistance respectively in the peripheral tissues. Some physiologic advantages of the intraperitoneal vs the oral route of administration during a glucose tolerance are the ease and speed of glucose delivery and the bypassing of the gastrointestinal and intestinal phases which may delay the rate of glucose uptake into the plasma unequally in different animal subjects, and thus introduce a potential artefact in the overall glycemic response obtained.18
Groups of adult lean and obese male and female Wistar Fatty Rats (the WDF/TaDrt-fa strain) were obtained from the University of Indiana Diabetes Research Center Training Core Laboratory (DRTC) at 20weeks of age. This strain was derived from an original diabetes prone background strain that was crossbred with the 13M Zucker fatty rat to incorporate the fatty (-fa) trait by Ikeda et al. resulting in the establishment of a rodent model of obesity+NIDDM that expressed the metabolic characteristics of adult onset obesity and NIDDM including hyperinsulinemia, insulin resistance and glucose intolerance and other pathophysiologic stigmata commonly linked to the disorder.7–10 Animals were housed in hanging steel cages in littermate pairs consisting of one lean and one obese animal, with free access to Purina chow (#5012) and house water, and acclimated to a reverse light cycle (dark phase 0800-2000h) at 20-21°C and 50% relative humidity. When 22weeks of age, the diet was changed thereafter to isoenergetic semisynthetic diets consisting of (w/w) 54% carbohydrate as cooked cornstarch (CS) or sucrose (SUC), 16 % mixed fats (equal parts lard, corn oil, beef tallow, and coconut oil), 20% protein (as equal parts lactalbumin and casein), 4% essential vitamins and minerals and 5% cellulose fiber, plus continued free access to house water.14 Animals were weighed weekly and measures of 24-hour food intakes recorded for estimation of feed efficiency ratios after 4 and 8weeks on the experimental diet. Measures of intraperitoneal glucose tolerance (glucose, 250mg/100g BW, in a 50% w/v sterile solution) were obtained at 30weeks of age after 8 weeks on the experimental diet. Glucose was measured with a glucose oxidase method,18 and fasting insulin and T3 concentrations determined via radioimmunoassay. The area under the glucose curve was calculated as outlined by Sakagiuchi et al.15 At the end of the study, animals were humanely sacrificed after an overnight fast, and fasting bloods collected from the truncal dissection and stored on ice until analytical procedures were performed. Measures of during glucose were determine in 24-hour collections in a metabolic cage. Measures of Glycosylated Hemoglobin were determined via resin separation and expressed as a percentage of the total hemoglobin.17-19 Data were analyzed via standard statistical procedures including ANOVA and Students ‘T’ test. Data are presented as the mean ±1 SEM. This study was approved by the Institutional Animal Care and Use Committee.
Measures of initial and final body weights and average weight gain during the 8 weeks of study of lean and obese rats are depicted in Figures 1 (Female) and Figure 2 (Male). Male animals of both phenotypes had an improved feed efficiency ratio, gained more weight per gram of diet consumed, and weighed more than their female littermates at the end of the study. In addition, the substitution of the sucrose for the cornstarch as a carbohydrate source further enhanced the efficiency of weight gain and resulted in greater weight gain in both male and female animals, with the greatest impact observed among the obese phenotype (Figure 3). The efficiency of growth and weight gain was determined by recording the average grams of food consumed after 8weeks of the diet and dividing by the average daily weight gain during the same period, expressed in Figure 4. Obese animals consumed more food than their lean littermates and gained more weight as well. The calculations of mean feed efficiency indicated that obese rats gained more weight per gram of food consumed than their lean littermates, and the sucrose diet was associated with a more efficient rate of weight gain in the obese phenotype, with the greatest enhancement of the efficiency of weight gain in the obese animals consuming the sucrose diet regimen.
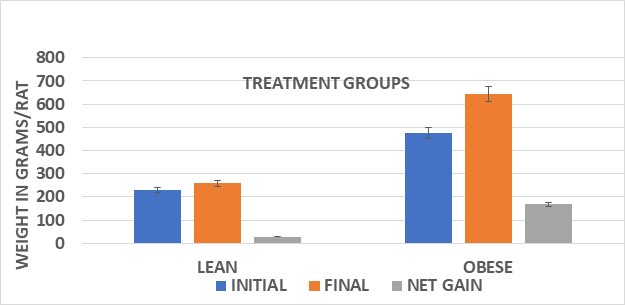
Figure 1 Body weights and net gain of male lean and obese Wistar fatty Rats. Data are mean ±1 SEM, n=3-4 rats/group. Obese > Lean (p=<0.05) and Sucrose diet > starch diet (p=<0.05) in obese phenotype.
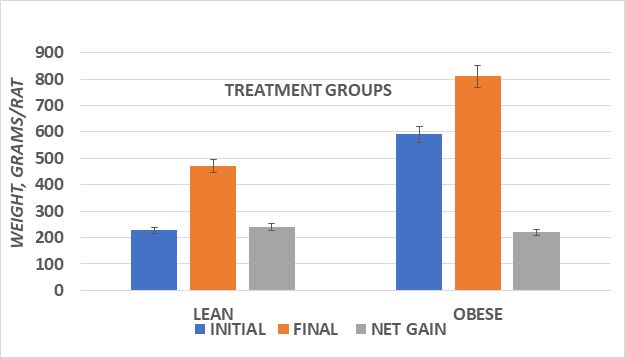
Figure 2 Body weights and net gain of male lean and obese Wistar fatty Rats. Data are mean ±1 SEM, n=10-11 rats/group. Obese > Lean (p=<0.05) and Sucrose diet > starch diet (p=<0.05) in both phenotypes.
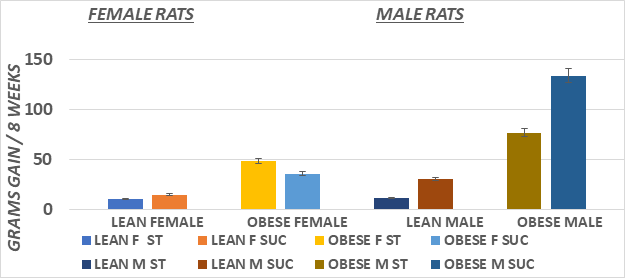
Figure 3 Body weight gain of male and female lean and obese Wistar fatty Rats. Data are mean ±1 SEM, males n=6 rats/group; Female n=3-4 rats/group. Obese > Lean (p=<0.05) and Sucrose diet > starch diet (p=<0.05) in obese phenotype.
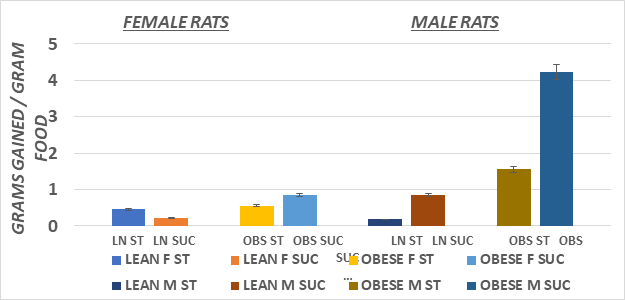
Figure 4 Feed Efficiency of male and female lean and obese Wistar fatty Rats. Data are mean ±1 SEM, males n=6 rats/group; Female n=3-4 rats/group. Suc > Starch diet in Obese males. > p=<0.05).
The systemic glycemic responses to an intraperitoneal glucose challenge in the four treatment groups of female animals is depicted in Figure 5 and indicates that the glycemic responses in the obese rats consuming the sucrose regimen were significantly greater than all other treatment groups, as also reflected by the greater AUC in that group (Figure 7). The glycemic responses in the male rats are depicted in Figure 6 and the AUC computations in Figure 8, and also indicate that the glycemic excursions of the male rats as computed via the method of Sakaguchi et al.15 were greater than observed in the female rats in each treatment group, with the most extreme responses in the obese+NIDDM rats consuming the sucrose regimen. Glycosylated hemoglobin is formed by the non-reversible post-transcriptional glycosylation of hemoglobin A at the amino-terminal valine residue of the beta chain, which occurs slowly throughout the lifespan of the red blood cell. Thus, the measures of glycosylated hemoglobin reflect the average plasma glucose over the preceding four months, corresponding with the average typical lifespan of erythrocytes. Consistent with the glycemic responses to the intraperitoneal glucose tolerances depicted above, the Glycosylated hemoglobin was modestly greater in sucrose than starch fed animals of both sexes when fed the high glycemic index sucrose regimen. Also as anticipated, the AUC of the male obese+NIDDM rats was greater than in the corresponding groups of female rats. As depicted in Table 1, glycosuria was determined in 24-hour urine collections in a metabolic cage, and also indicated that the male obese+NIDDM passed significantly more glucose when consuming the sucrose vs, the starch diet than did the female littermates fed the same dietary regimen.
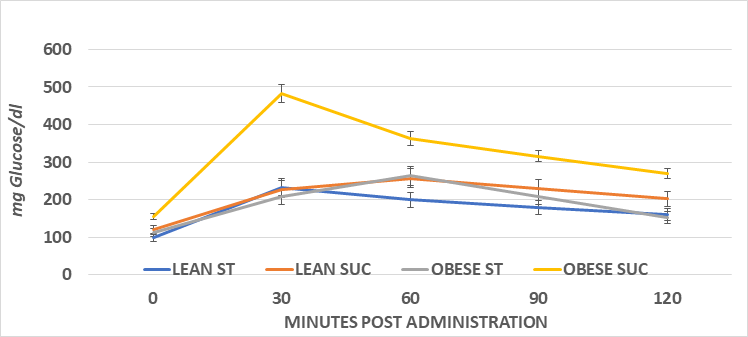
Figure 5 Phenotype on ip Glucose Tolerance in female lean and obese Wistar fatty Rats. Data are mean ±1 SEM, Female n=3-4 rats/group. Obese Sucrose > Starch diet and obese phenotype Sucrose > all other groups.
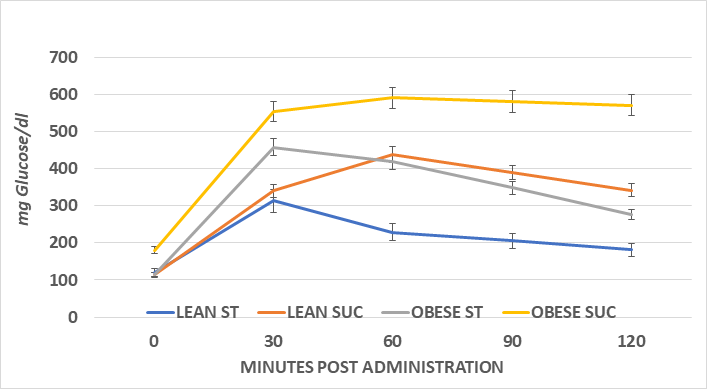
Figure 6 Effect of diet CHO type and phenotype on ip Glucose Tolerance in male lean and obese Wistar fatty Rats.
Data are mean ±1 SEM, Female n=4-6 rats/group. Obese Sucrose > Starch diet and obese phenotype Sucrose > all other groups; Lean sucrose > lean starch from 60 minutes.
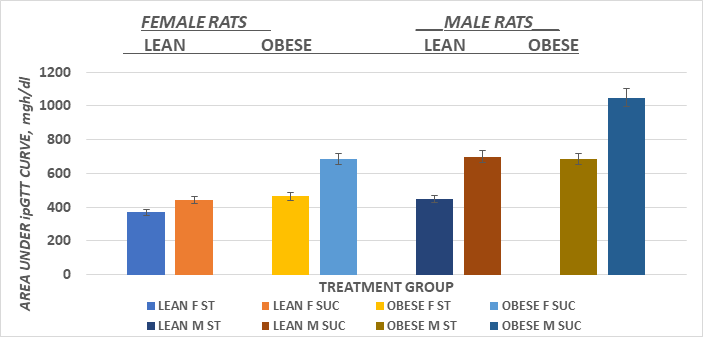
Figure 7 Effect of carbohydrate type, sex and phenotype on area under the glucose curve in male and female Wistar Fatty Rats.
Data are mean ± 1 SEM, N=4-6 rats per group. SUC > ST in obese females, and in lean and obese males (p=<0.05)
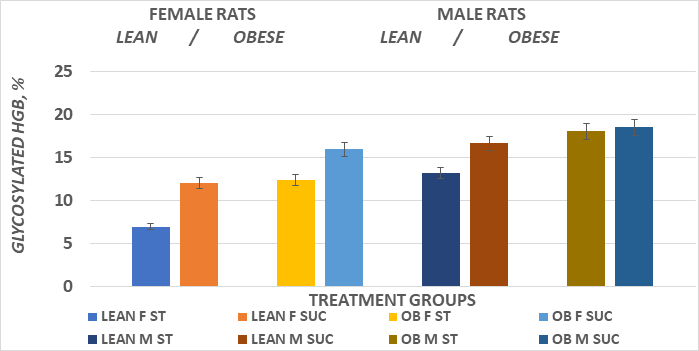
Figure 8 Effect of diet CHO type and phenotype on glycosylated hemoglobin in female and male lean and obese Wistar fatty Rats.
Data are mean ±1 SEM, Female n=3-4 rats/group, male 4-6 rats/group. In female rats Suc > Starch in both phenotypes; In lean male GHB > lean female rats, and Sucrose > Starch.
Male obese sucrose vs obese starch diet = N.S. Bloods were kept on ice until analysis were performed.
Group |
Female |
Male |
Lean Starch |
trace |
1+ |
Lean Sucrose |
trace |
1+ |
Obese Starch |
1+ |
3+ |
Obese Starch |
4++ |
4 ++++ |
|
ANOVA |
|
Diet |
NS |
<0.05 |
Phenotype |
<0.05 |
<0.05 |
Table 1 Urine glucose content of Wistar Fatty Rats
Data are mean +/- 1 SEM, N= 4-6 Rats/group.
Measures of fasting insulin and of the insulin to glucose ratio were determined at the end of the study as an indicator of the magnitude of insulin resistance that may have developed in each group in response to the gender, phenotype and diet consumed during the preceding 8 weeks. These findings indicated that the fasting insulin concentrations and the insulin to glucose ratios of the obese were greater than occurred in their lean littermates, with the greatest excursions in the male obese+NIDDM rats, and thereby consistent with the greatest magnitude of insulin resistance and of NIDDM in those animals (Figures 9&10).
The results of this study confirm the improved feed efficiency per gram of diet consumed, and the excess body weight and overall weight gain in both male and female rats expressing the obese phenotype of this strain similar to that which has been reported previously.14 In addition to the added increase in weight gain when animals were fed an isoenergetic, high sucrose vs a complex carbohydrate diet from 22 to 30weeks of age, feed efficiency and weight gain increased further in the current study. While the changes in body composition between the phenotypes was not determined in the present study, other studies have shown the differences in body weight to be due to early-onset hyperplastic-hypertrophic obesity, in association with varying magnitude of insulin resistance and impaired non-shivering thermogenesis.8,21 The Wistar Fatty Rat used in the present study occurred as the result of a cross between a diabetes-prone strain of Wistar Rats and the 13M strain of Zucker Fatty Rats, which contributed the autosomal recessive fatty (-fa) trait to the offspring.7–10 As a result, all of the obese offspring typically develop carbohydrate intolerance or non-insulin diabetes in concert with the obesity by early adulthood, with the most severe NIDDM in the obese male rats while glucose intolerance in the lean littermates regardless of diet were modest by comparison. The etiologic factors which combine to result in NIDDM are unclear but are likely linked at least in part to the absolute hyperphagia observed in the obese phenotype, in addition to hyperinsulinemia, leading to a decrease in insulin sensitivity, and other likely endocrinopathies associated with the progressive excess in body fat accretion with advancing age. The results of this study indicate that the feeding of a high glycemic index sucrose-rich diet for eight weeks to adult lean and obese littermate Wistar Fatty Rats results in greater excursions in glycemic responses to a glucose challenge in the obese+NIDDM phenotype, and that the aberrations in peripheral glucose disposal were of greater magnitude in male than female obese or lean littermate animals. In addition, isoenergetic substitution of the simple carbohydrate sucrose for cooked cornstarch in the dietary regimen resulted in further derangement in the glycemic responses including a significantly elevated Insulin to glucose ratio and glucose area under the curve (AUC) in the obese of both sexes. The magnitude of the glycemic responses, including the disposal phase of the glucose tolerance curves and the insulin to glucose ratios is consistent with the sucrose ration being more insulinogenic than the isoenergetic starch regimen in the obese phenotypes of both male and female obese rats.
In the current study, the glucose challenge was administered via the intraperitoneal route, rather than via the more common process of oral gavage. While the oral route of glucose may be considered to reflect a more physiologic approach, the intraperitoneal route offers advantages in accuracy of dosage delivered and ease and safety of delivery, due to its bypassing of the gastrointestinal element of glycemic responses. The intraperitoneal approach has been proposed to represent a more definitive response to peripheral glucose uptake and disposal in peripheral tissues than the oral gavage method.20 Advantages of the intraperitoneal administration route of the glucose challenge are proposed to reduce the stress associated with the gavage procedure and its hormonal implications on glycemic responses. Additionally, it enabled the glucose to be administered more rapidly than via the oral gavage method, exposing the administered glucose to an abundant absorptive epithelium, and effectively bypassing the gastrointestinal and luminal digestive phases in the systemic glucose uptake and disposal in peripheral tissues. With those factors, the intraperitoneal route of glucose administration has been proposed to produce a better reflection of the magnitude of insulin mediated phase of peripheral glucose uptake that may have developed in response to factors of diet and genetic predisposition. As a result, it is anticipated that the peak in blood glucose concentrations will likely have occurred earlier and achieved greater plasma glucose concentrations than if the same glucose challenge would have been administered via the oral route, as has been reported elsewhere.19,20
Rats fed a highly palatable diet tend to consume more individual meals, including snacking resulting in more calories daily and then when fed standard rat chow.30 Because the percent of glycosylated hemoglobin in blood is a reflection of the mean plasma glucose concentrations over the projected 120-day lifespan of the mammalian erythrocyte, and occurs via a nonenzymatic, mass-action chemistry process, it is likely to give a higher glycosylated hemoglobin readings then typical when rats are offered highly palatable diets as in the current study, although individual values may vary between laboratories depending on the specific method employed in their measurement.17 Thus, the frequency and carbohydrate type, carbohydrate digestibility and net carbohydrate content consumed during the preceding weeks and months are proposed to contribute to the glycosylation process and can increase or decrease the percent of glycosylated hemoglobin resulting based largely on the above contributing factors. Once the bloods have been collected, it is imperative to store them on ice to decrease potential RBC-mediated glycolytic actions, so as to ensure the plasma glucose concentrations remain preserved, and in addition to any post-collection nonenzymatic glycation remains minimal during the interval between collection and laboratory analysis. Although rats tend to commence much their daily food intake at the onset of the dark phase, they typically behave as grazers, and continue to eat throughout the 24-hour feeding cycle and may exhibit a somewhat higher percentage of glycosylated hemoglobin, even when not exhibiting overt signs of diabetes. In the present study the bloods were analyzed for evidence of glycosylated hemoglobin as soon as practicable, typically within a few hours following collection. The measures observed in the present study are presumed to be a reflection of the previous 8weeks of consuming a highly digestible, high carbohydrate diet in a grazing pattern, and the hyperphagia displayed particularly in the obese phenotype.
The obese phenotype of several rodent strains exhibit similar endocrinopathies’.22–24 Peterson et al. has reported that this strain of Wistar Fatty Rat is highly predisposed to development of obesity+NIDDM and its typical pathophysiologic sequelae in both sexes on or before attaining adult status.8 In addition, Tulp et al have reported that the obese phenotype of this strain has been shown to exhibit an impaired resting and noradrenaline-stimulated rate of non-shivering thermogenesis, an elevated Insulin to glucose ratio and an improved efficiency of weight gain, despite having an abundance of potentially thermogenic brown adipose tissue, similar to that which has been reported in the obese of other rat strains.11,14,21,25 The obese phenotype of the LA/N//-cp and SHE/N//-cp rats, which are believed to share the same genetic locus for their corpulent (-cp) trait develop obesity and its typical sequalae including hyperinsulinemia, hyperamylinemia, and impaired thyroidal and thermic responses to diet and environment, similar to the expression of those parameters as they occur in the Zucker Fatty Rat and the Wistar Fatty Rat of this study and in Corpulent rat strains.26 The endocrinologic dysregulation in the obese phenotype of the Wistar fatty Rat likely includes elements of sympathetic, thyroidal and insulinogenic hormonal activity, which when in combination may bring about a cascade of biochemical events that contribute to increases in the efficiency of energy balance, with the excess calories deposited predominately in white adipose tissue depots. Hyperinsulinemia, characteristic of the obese phenotype of this and other obese rat strains.23
The characteristics of systemic glucose disposal following intraperitoneal administration were indicative of decreased insulin sensitivity in peripheral tissues in the obese phenotype and which were further impaired when animals consumed the high sucrose regimen. Since the intraperitoneal carbohydrate challenge included only glucose, it may be concluded that the high sucrose diet as fed was more insulinogenic than the starch diet. The greater magnitude of insulin insensitivity occurred regardless of diet, but was increased further with the high glycemic index, high sucrose diet. The high sucrose diet regimen thereby produced a greater magnitude of insulin resistance, negatively altered glucose and energy homeostasis, and was associated with a delayed capacity for the efficiency of glucose disposal in insulin dependent tissues. It is likely that skeletal muscle and adipose tissue were among the most affected peripheral tissues, as these two depots that are dependent on intracellular, insulin and glucocorticoid-linked GLUT-4 receptor translocation from the endoplasmic reticulum to the plasma membrane for efficient glucose uptake and subsequent oxidation to occur.27 Insulin is a well-established hormonal modulator of lipid biosynthesis and lipid deposition in fatty tissues, and of suppressing the rate of protein degradation and protein turnover in muscle and other tissues, thereby contributing to the metabolic efficiency and increased weight gain in the obese phenotype.23,28–31 When the α-glucosidase and sucrase inhibitor acarbose was administered to animals fed a similar high sucrose diet in a related study, the glycemic responses including the insulin to glucose ratio, excess fat accretion and added weight gain mimicked those of animals fed a cornstarch based, sucrose free diet.14,21 Thus, the contribution of carbohydrate type, simple vs complex, can play a decisive role in the expression and development of the obese+NIDDM stigmata and its pathophysiologic sequela in man and animals.
The author wishes to thank Carol Stevens for assistance id data collection and the late Dr Otho E Michaelis IV for the contribution of the dietary formulation used in this study.
None.
Author declares that there is no conflict of interest.

©2022 Tulp. This is an open access article distributed under the terms of the, which permits unrestricted use, distribution, and build upon your work non-commercially.