Submit manuscript...
eISSN: 2576-4500

Aeronautics and Aerospace Open Access Journal

Research Article Volume 1 Issue 2

Self sustained oscillations for square cavities at yaw

Kuan Huang Lee,1 Keh Chin Chang,1 Kung-Ming Chung2

1Department of Aeronautics and Astronautics, National Cheng Kung University, Taiwan
2Aerospace Science and Technology Research Centre, National Cheng Kung University, Taiwan

Correspondence: Kung Ming Chung, National Cheng Kung University, 2500 Section 1, Chung-Cheng South Road, Guiren district, Tainan, 711, Taiwan , Tel 886-62392811

Received: July 20, 2017 | Published: August 22, 2017

Citation: Lee KH, Chang KC, Chang KM. Self sustained oscillations for square cavities at yaw. Aeron Aero Open Access J. 2017;1(2):76-79. DOI: 10.15406/aaoaj.2017.01.00010

Download PDF

Abstract

An experimental study was conducted to determine the characteristics for a compressible turbulent flow over square cavities at yaw. Flush-mounted dynamic pressure transducers for mean and fluctuating pressure measurements were installed along the chordwise direction. The self-sustained oscillation phenomenon was examined by spectral density function. For a fixed yaw angle, the ratio of the incoming boundary layer thickness to the depth of the cavity has an evident influence near the rear corner of cavity, including the trailing-edge expansion and the maximum pressure fluctuations.

Keywords: yawed cavity, self-sustained oscillations, pressure fluctuations, critical length, transitional cavity, mach number, gaussian distribution

Introduction

Cavities that are exposed to surface bounding flows are of high interest in both fundamental aspects and engineering applications due to the inherent complex flow structure and induced drag. Self-sustained oscillations lead to fluctuating load on airframes and generate enormous noise. Lawson & Barakos1 reviewed the numerical simulations on cavity flows from 1955 to 2009. Cavity flows are influenced by free stream conditions and cavity geometry. The most remarkable parameter is the ratio of length to depth, L/H. Charwat2 showed the critical length of a cavity flow, which is the length between the leading edge of the cavity and the attachment of shear layer, is dependent on the state of incoming boundary layer (laminar or turbulent). For a shallow cavity, Plentovich et al.3 found that there are three types of cavities, namely, an open, a transitional or a closed cavity. For supersonic cavity flows, a transitional cavity can be further split into a transitional-open or a transitional-closed cavity. In addition, for a compressible flow, the boundary between an open and a transitional cavity is at L/H of 8­–10 and that between a transitional and a closed cavity is at L/H of 9–14 .4,5 The critical L/H for a transitional cavity decreases as L increases and is more apparent for higher M

For an open cavity, the flow essentially bridges the cavity and a shear layer is formed over the cavity. There is an almost uniform distribution of static pressure along the cavity floor. The impingement of the shear layer on the rear wall of the cavity leads to high fluctuations and acoustic tones.6 A yawed rectangular cavity means the flow are parallel to the planform of a cavity, but the chordwise direction of the cavity has an angle, β MathType@MTEF@5@5@+= feaagKart1ev2aaatCvAUfeBSjuyZL2yd9gzLbvyNv2CaerbuLwBLn hiov2DGi1BTfMBaeXatLxBI9gBaerbd9wDYLwzYbItLDharqqtubsr 4rNCHbGeaGqiVu0Je9sqqrpepC0xbbL8F4rqqrFfpeea0xe9Lq=Jc9 vqaqpepm0xbba9pwe9Q8fs0=yqaqpepae9pg0FirpepeKkFr0xfr=x fr=xb9adbaqaaeGaciGaaiaabeqaamaabaabaaGcbaqcLbsaqaaaaa aaaaWdbiabek7aIbaa@3846@ , with respect to the freestream direction.7 An asymmetric flow pattern inside the cavity was observed.8 Lada & Kontis9 showed the yaw angle either disturbs the shear layer or changes the flow type, resulting in attenuation of self-sustained oscillations. The incoming boundary layer thickness to depth ratio, δ / H MathType@MTEF@5@5@+= feaagKart1ev2aaatCvAUfeBSjuyZL2yd9gzLbvyNv2CaerbuLwBLn hiov2DGi1BTfMBaeXatLxBI9gBaerbd9wDYLwzYbItLDharqqtubsr 4rNCHbGeaGqiVu0Je9sqqrpepC0xbbL8F4rqqrFfpeea0xe9Lq=Jc9 vqaqpepm0xbba9pwe9Q8fs0=yqaqpepae9pg0FirpepeKkFr0xfr=x fr=xb9adbaqaaeGaciGaaiaabeqaamaabaabaaGcbaqcLbsaqaaaaa aaaaWdbiabes7aKjaac+cacaWGibaaaa@39CA@ , is another critical parameter. Increasing δ / H MathType@MTEF@5@5@+= feaagKart1ev2aaatCvAUfeBSjuyZL2yd9gzLbvyNv2CaerbuLwBLn hiov2DGi1BTfMBaeXatLxBI9gBaerbd9wDYLwzYbItLDharqqtubsr 4rNCHbGeaGqiVu0Je9sqqrpepC0xbbL8F4rqqrFfpeea0xe9Lq=Jc9 vqaqpepm0xbba9pwe9Q8fs0=yqaqpepae9pg0FirpepeKkFr0xfr=x fr=xb9adbaqaaeGaciGaaiaabeqaamaabaabaaGcbaqcLbsaqaaaaa aaaaWdbiabes7aKjaac+cacaWGibaaaa@39CA@ could smooth out the pressure gradient near the rear corner of a cavity.2 The effect of δ / H MathType@MTEF@5@5@+= feaagKart1ev2aaatCvAUfeBSjuyZL2yd9gzLbvyNv2CaerbuLwBLn hiov2DGi1BTfMBaeXatLxBI9gBaerbd9wDYLwzYbItLDharqqtubsr 4rNCHbGeaGqiVu0Je9sqqrpepC0xbbL8F4rqqrFfpeea0xe9Lq=Jc9 vqaqpepm0xbba9pwe9Q8fs0=yqaqpepae9pg0FirpepeKkFr0xfr=x fr=xb9adbaqaaeGaciGaaiaabeqaamaabaabaaGcbaqcLbsaqaaaaa aaaaWdbiabes7aKjaac+cacaWGibaaaa@39CA@ was also noted by Sinha et al.10 A laminar incoming boundary layer generates strong vortex inside the cavity and the vortex is a more localized phenomenon near the rear face.11

Experiments were conducted to characterize a compressible turbulent flow for square cavities at yaw. The effect of δ / H MathType@MTEF@5@5@+= feaagKart1ev2aaatCvAUfeBSjuyZL2yd9gzLbvyNv2CaerbuLwBLn hiov2DGi1BTfMBaeXatLxBI9gBaerbd9wDYLwzYbItLDharqqtubsr 4rNCHbGeaGqiVu0Je9sqqrpepC0xbbL8F4rqqrFfpeea0xe9Lq=Jc9 vqaqpepm0xbba9pwe9Q8fs0=yqaqpepae9pg0FirpepeKkFr0xfr=x fr=xb9adbaqaaeGaciGaaiaabeqaamaabaabaaGcbaqcLbsaqaaaaa aaaaWdbiabes7aKjaac+cacaWGibaaaa@39CA@ on the chordwise distribution of the mean and fluctuating pressure is determined. The distribution of the power spectral density near the rear face is also reported to characterize self-sustained oscillations.

Experimental setup

Experiments were conducted in the blowdown type transonic wind tunnel at Aerospace Science and Technology Research Center, National Cheng Kung University (ASTRC/NCKU). The tunnel has a constant area test section of 600 × 600 mm2 and 1500 mm in length. The test section is assembled with solid side walls and perforated top/bottom walls. The freestream Mach number, M, is 0.64, 0.70 and 0.83 ± 0.01 MathType@MTEF@5@5@+= feaagKart1ev2aaatCvAUfeBSjuyZL2yd9gzLbvyNv2CaerbuLwBLn hiov2DGi1BTfMBaeXatLxBI9gBaerbd9wDYLwzYbItLDharqqtubsr 4rNCHbGeaGqiVu0Je9sqqrpepC0xbbL8F4rqqrFfpeea0xe9Lq=Jc9 vqaqpepm0xbba9pwe9Q8fs0=yqaqpepae9pg0FirpepeKkFr0xfr=x fr=xb9adbaqaaeGaciGaaiaabeqaamaabaabaaGcbaqcLbsaqaaaaa aaaaWdbiaaicdacaGGUaGaaGioaiaaiodacqGHXcqScaaIWaGaaiOl aiaaicdacaaIXaaaaa@3E5F@ , and the corresponding unit Reynolds number is 12.9, 15.1 and 17.2 × 10⁶ per meter, with a naturally developed turbulent boundary layer over a flat plate. The stagnation pressure p0 and stagnation temperature were maintained at 172 ± 0.5 MathType@MTEF@5@5@+= feaagKart1ev2aaatCvAUfeBSjuyZL2yd9gzLbvyNv2CaerbuLwBLn hiov2DGi1BTfMBaeXatLxBI9gBaerbd9wDYLwzYbItLDharqqtubsr 4rNCHbGeaGqiVu0Je9sqqrpepC0xbbL8F4rqqrFfpeea0xe9Lq=Jc9 vqaqpepm0xbba9pwe9Q8fs0=yqaqpepae9pg0FirpepeKkFr0xfr=x fr=xb9adbaqaaeGaciGaaiaabeqaamaabaabaaGcbaqcLbsaqaaaaa aaaaWdbiaaigdacaaI3aGaaGOmaiabgglaXkaaicdacaGGUaGaaGyn aaaa@3CF6@ kPa (25 ± MathType@MTEF@5@5@+= feaagKart1ev2aaatCvAUfeBSjuyZL2yd9gzLbvyNv2CaerbuLwBLn hiov2DGi1BTfMBaeXatLxBI9gBaerbd9wDYLwzYbItLDharqqtubsr 4rNCHbGeaGqiVu0Je9sqqrpepC0xbbL8F4rqqrFfpeea0xe9Lq=Jc9 vqaqpepm0xbba9pwe9Q8fs0=yqaqpepae9pg0FirpepeKkFr0xfr=x fr=xb9adbaqaaeGaciGaaiaabeqaamaabaabaaGcbaqcLbsaqaaaaa aaaaWdbiabgglaXcaa@3893@ 0.15 psia) and room temperature, respectively. The boundary-layer thickness, δ MathType@MTEF@5@5@+= feaagKart1ev2aaatCvAUfeBSjuyZL2yd9gzLbvyNv2CaerbuLwBLn hiov2DGi1BTfMBaeXatLxBI9gBaerbd9wDYLwzYbItLDharqqtubsr 4rNCHbGeaGqiVu0Je9sqqrpepC0xbbL8F4rqqrFfpeea0xe9Lq=Jc9 vqaqpepm0xbba9pwe9Q8fs0=yqaqpepae9pg0FirpepeKkFr0xfr=x fr=xb9adbaqaaeGaciGaaiaabeqaamaabaabaaGcbaqcLbsaqaaaaa aaaaWdbiabes7aKbaa@384A@ , at 25 mm upstream of the cavity was approximate 7 mm.12

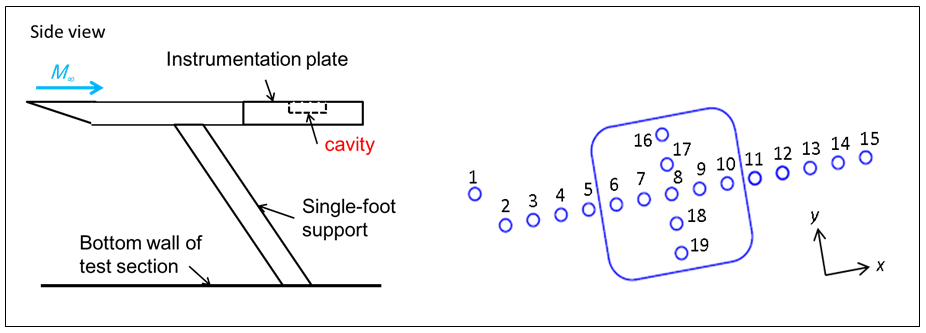
The test model consisted of a 4° sharp leading-edge flat plate and an interchangeable instrumentation plate, as shown in Figure 1. The flat plate was 450 mm × 150 mm and was supported by a single sting that mounted on the bottom wall of the test section. The instrumentation plate with a square cavity was 195 mm × 150 mm × 25 mm. For a fixed yawed angle ( β =   10 ° ) MathType@MTEF@5@5@+= feaagKart1ev2aaatCvAUfeBSjuyZL2yd9gzLbvyNv2CaerbuLwBLn hiov2DGi1BTfMBaeXatLxBI9gBaerbd9wDYLwzYbItLDharqqtubsr 4rNCHbGeaGqiVu0Je9sqqrpepC0xbbL8F4rqqrFfpeea0xe9Lq=Jc9 vqaqpepm0xbba9pwe9Q8fs0=yqaqpepae9pg0FirpepeKkFr0xfr=x fr=xb9adbaqaaeGaciGaaiaabeqaamaabaabaaGcbaqcLbsacaGGOa GaeqOSdigeaaaaaaaaa8qacqGH9aqpcaqGGaGaaGymaiaaicdacqGH WcaSpaGaaiykaaaa@3EB8@ , the geometry of cavities is summarized in Table 1. The length was 31, 43, 59 mm and the depth ranged from 2.2 to 9.7 mm, corresponding to L/H of 4.43-21.50 and δ / H MathType@MTEF@5@5@+= feaagKart1ev2aaatCvAUfeBSjuyZL2yd9gzLbvyNv2CaerbuLwBLn hiov2DGi1BTfMBaeXatLxBI9gBaerbd9wDYLwzYbItLDharqqtubsr 4rNCHbGeaGqiVu0Je9sqqrpepC0xbbL8F4rqqrFfpeea0xe9Lq=Jc9 vqaqpepm0xbba9pwe9Q8fs0=yqaqpepae9pg0FirpepeKkFr0xfr=x fr=xb9adbaqaaeGaciGaaiaabeqaamaabaabaaGcbaqcLbsaqaaaaa aaaaWdbiabes7aKjaac+cacaWGibaaaa@39CA@ of 0.73-3.50.

Figure 1 A schematic drawing of test configuration and location of pressure transducers.

Cavity

L, mm

H, mm

L/H

δ / H MathType@MTEF@5@5@+= feaagKart1ev2aaatCvAUfeBSjuyZL2yd9gzLbvyNv2CaerbuLwBLn hiov2DGi1BTfMBaeXatLxBI9gBaerbd9wDYLwzYbItLDharqqtubsr 4rNCHbGeaGqiVu0Je9sqqrpepC0xbbL8F4rqqrFfpeea0xe9Lq=Jc9 vqaqpepm0xbba9pwe9Q8fs0=yqaqpepae9pg0FirpepeKkFr0xfr=x fr=xb9adbaqaaeGaciGaaiaabeqaamaabaabaaGcbaqcLbsaqaaaaa aaaaWdbiaahs7acaGGVaGaaCisaaaa@3969@

1

31

5

6.2

1.4

2

2.2

14.09

3.18

3

43

9.7

4.43

0.72

4

7

6.14

1

5

5

8.6

1.4

6

3.5

12.29

2

7

3

14.33

2.33

8

2

21.5

3.5

9

59

9.6

6.15

0.73

10

4.2

14.05

1.67

Table 1 Geometry of the square cavities.

Dynamic surface pressure (Kulite XCS-093-25A, B screen) measurements were conducted for the cavity models. The outputs of the pressure transducers were recorded by using a National Instruments (NI-SCXI) system, with a sampling rate was 5 μ s MathType@MTEF@5@5@+= feaagKart1ev2aaatCvAUfeBSjuyZL2yd9gzLbvyNv2CaerbuLwBLn hiov2DGi1BTfMBaeXatLxBI9gBaerbd9wDYLwzYbItLDharqqtubsr 4rNCHbGeaGqiVu0Je9sqqrpepC0xbbL8F4rqqrFfpeea0xe9Lq=Jc9 vqaqpepm0xbba9pwe9Q8fs0=yqaqpepae9pg0FirpepeKkFr0xfr=x fr=xb9adbaqaaeGaciGaaiaabeqaamaabaabaaGcbaqcLbsaqaaaaa aaaaWdbiaaiwdacqaH8oqBcaWGZbaaaa@3A12@ . The uncertainties for the static surface pressure coefficient Cp and the surface pressure fluctuation coefficient C σ p MathType@MTEF@5@5@+= feaagKart1ev2aaatCvAUfeBSjuyZL2yd9gzLbvyNv2CaerbuLwBLn hiov2DGi1BTfMBaeXatLxBI9gBaerbd9wDYLwzYbItLDharqqtubsr 4rNCHbGeaGqiVu0Je9sqqrpepC0xbbL8F4rqqrFfpeea0xe9Lq=Jc9 vqaqpepm0xbba9pwe9Q8fs0=yqaqpepae9pg0FirpepeKkFr0xfr=x fr=xb9adbaqaaeGaciGaaiaabeqaamaabaabaaGcbaqcLbsacaGGdb qcfa4aaSbaaeaajugWaiabeo8aZTWaaSbaaKqbagaajugWaiaadcha aKqbagqaaaqabaaaaa@3E57@ were 2.4% and 0.4%, respectively.

Results and discussion

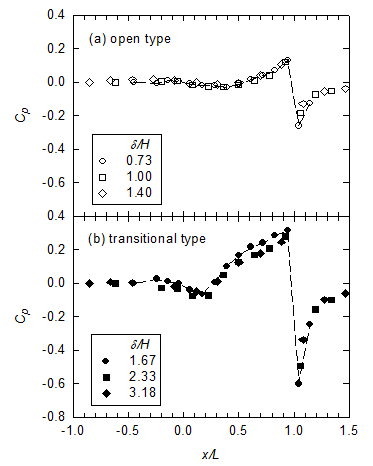
The effect of yaw angle on chordwise pressure distributions is shown in Figure 2 where M = 0.83 and L/H = 4.43 and 8.60. For a given value of L/H, there is less expansion near the rear face when β =   10 ° MathType@MTEF@5@5@+= feaagKart1ev2aaatCvAUfeBSjuyZL2yd9gzLbvyNv2CaerbuLwBLn hiov2DGi1BTfMBaeXatLxBI9gBaerbd9wDYLwzYbItLDharqqtubsr 4rNCHbGeaGqiVu0Je9sqqrpepC0xbbL8F4rqqrFfpeea0xe9Lq=Jc9 vqaqpepm0xbba9pwe9Q8fs0=yqaqpepae9pg0FirpepeKkFr0xfr=x fr=xb9adbaqaaeGaciGaaiaabeqaamaabaabaaGcbaqcLbsacqaHYo GyqaaaaaaaaaWdbiabg2da9iaabccacaaIXaGaaGimaiabgclaWcaa @3D50@ . Lee et al.7 also indicated that the yaw angle has an evident effect on the amplitude of C σ p MathType@MTEF@5@5@+= feaagKart1ev2aaatCvAUfeBSjuyZL2yd9gzLbvyNv2CaerbuLwBLn hiov2DGi1BTfMBaeXatLxBI9gBaerbd9wDYLwzYbItLDharqqtubsr 4rNCHbGeaGqiVu0Je9sqqrpepC0xbbL8F4rqqrFfpeea0xe9Lq=Jc9 vqaqpepm0xbba9pwe9Q8fs0=yqaqpepae9pg0FirpepeKkFr0xfr=x fr=xb9adbaqaaeGaciGaaiaabeqaamaabaabaaGcbaqcLbsacaGGdb qcfa4aaSbaaeaajugWaiabeo8aZTWaaSbaaKqbagaajugWaiaadcha aKqbagqaaaqabaaaaa@3E57@ near the rear face for open and transitional cavities. Regarding the effect of δ/H on square cavities at yaw, Figure 3 presents the results of mean surface pressure of open and transitional cavities for M = 0.83 in chordwise direction. For the open cavities (Figure 3(a)), little variation is observed upstream and along the floor of the cavity. Increasing δ / H MathType@MTEF@5@5@+= feaagKart1ev2aaatCvAUfeBSjuyZL2yd9gzLbvyNv2CaerbuLwBLn hiov2DGi1BTfMBaeXatLxBI9gBaerbd9wDYLwzYbItLDharqqtubsr 4rNCHbGeaGqiVu0Je9sqqrpepC0xbbL8F4rqqrFfpeea0xe9Lq=Jc9 vqaqpepm0xbba9pwe9Q8fs0=yqaqpepae9pg0FirpepeKkFr0xfr=x fr=xb9adbaqaaeGaciGaaiaabeqaamaabaabaaGcbaqcLbsaqaaaaa aaaaWdbiabes7aKjaac+cacaWGibaaaa@39CA@ results in a suppression of trailing edge expansion downstream of the cavities. For the transitional cavities (Figure 3(b)), despite the existences of suppressions downstream of the cavities as δ / H MathType@MTEF@5@5@+= feaagKart1ev2aaatCvAUfeBSjuyZL2yd9gzLbvyNv2CaerbuLwBLn hiov2DGi1BTfMBaeXatLxBI9gBaerbd9wDYLwzYbItLDharqqtubsr 4rNCHbGeaGqiVu0Je9sqqrpepC0xbbL8F4rqqrFfpeea0xe9Lq=Jc9 vqaqpepm0xbba9pwe9Q8fs0=yqaqpepae9pg0FirpepeKkFr0xfr=x fr=xb9adbaqaaeGaciGaaiaabeqaamaabaabaaGcbaqcLbsaqaaaaa aaaaWdbiabes7aKjaac+cacaWGibaaaa@39CA@ increases, the values of Cp along the rear half of the cavity (x/D = 0.5–1.0) for δ / H = 1.67 MathType@MTEF@5@5@+= feaagKart1ev2aaatCvAUfeBSjuyZL2yd9gzLbvyNv2CaerbuLwBLn hiov2DGi1BTfMBaeXatLxBI9gBaerbd9wDYLwzYbItLDharqqtubsr 4rNCHbGeaGqiVu0Je9sqqrpepC0xbbL8F4rqqrFfpeea0xe9Lq=Jc9 vqaqpepm0xbba9pwe9Q8fs0=yqaqpepae9pg0FirpepeKkFr0xfr=x fr=xb9adbaqaaeGaciGaaiaabeqaamaabaabaaGcbaqcLbsaqaaaaa aaaaWdbiabes7aKjaac+cacaWGibGaeyypa0JaaGymaiaac6cacaaI 2aGaaG4naaaa@3DBE@ are higher than those for δ / H = 2.33 MathType@MTEF@5@5@+= feaagKart1ev2aaatCvAUfeBSjuyZL2yd9gzLbvyNv2CaerbuLwBLn hiov2DGi1BTfMBaeXatLxBI9gBaerbd9wDYLwzYbItLDharqqtubsr 4rNCHbGeaGqiVu0Je9sqqrpepC0xbbL8F4rqqrFfpeea0xe9Lq=Jc9 vqaqpepm0xbba9pwe9Q8fs0=yqaqpepae9pg0FirpepeKkFr0xfr=x fr=xb9adbaqaaeGaciGaaiaabeqaamaabaabaaGcbaqcLbsaqaaaaa aaaaWdbiabes7aKjaac+cacaWGibGaeyypa0JaaGOmaiaac6cacaaI ZaGaaG4maaaa@3DB8@ and 3.18. Figure 4 shows the variations in trailing-edge expansion with δ / H MathType@MTEF@5@5@+= feaagKart1ev2aaatCvAUfeBSjuyZL2yd9gzLbvyNv2CaerbuLwBLn hiov2DGi1BTfMBaeXatLxBI9gBaerbd9wDYLwzYbItLDharqqtubsr 4rNCHbGeaGqiVu0Je9sqqrpepC0xbbL8F4rqqrFfpeea0xe9Lq=Jc9 vqaqpepm0xbba9pwe9Q8fs0=yqaqpepae9pg0FirpepeKkFr0xfr=x fr=xb9adbaqaaeGaciGaaiaabeqaamaabaabaaGcbaqcLbsaqaaaaa aaaaWdbiabes7aKjaac+cacaWGibaaaa@39CA@ for square cavities at yaw. For both open and transitional cavities, the expansion downstream of the cavities is suppressed by increasing δ / H MathType@MTEF@5@5@+= feaagKart1ev2aaatCvAUfeBSjuyZL2yd9gzLbvyNv2CaerbuLwBLn hiov2DGi1BTfMBaeXatLxBI9gBaerbd9wDYLwzYbItLDharqqtubsr 4rNCHbGeaGqiVu0Je9sqqrpepC0xbbL8F4rqqrFfpeea0xe9Lq=Jc9 vqaqpepm0xbba9pwe9Q8fs0=yqaqpepae9pg0FirpepeKkFr0xfr=x fr=xb9adbaqaaeGaciGaaiaabeqaamaabaabaaGcbaqcLbsaqaaaaa aaaaWdbiabes7aKjaac+cacaWGibaaaa@39CA@ . Note that the effect of Mach number is minimal.
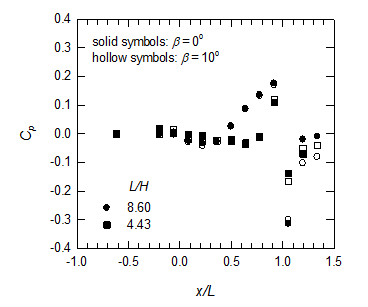
Figure 2 The chordwise static surface pressure distributions for M = 0.83 at β =   0 ° MathType@MTEF@5@5@+= feaagKart1ev2aaatCvAUfeBSjuyZL2yd9gzLbvyNv2CaerbuLwBLn hiov2DGi1BTfMBaeXatLxBI9gBaerbd9wDYLwzYbItLDharqqtubsr 4rNCHbGeaGqiVu0Je9sqqrpepC0xbbL8F4rqqrFfpeea0xe9Lq=Jc9 vqaqpepm0xbba9pwe9Q8fs0=yqaqpepae9pg0FirpepeKkFr0xfr=x fr=xb9adbaqaaeGaciGaaiaabeqaamaabaabaaGcbaqcLbsaqaaaaa aaaaWdbiabek7aIjabg2da9iaabccacaaIWaGaeyiSaalaaa@3C95@ and 10 ° MathType@MTEF@5@5@+= feaagKart1ev2aaatCvAUfeBSjuyZL2yd9gzLbvyNv2CaerbuLwBLn hiov2DGi1BTfMBaeXatLxBI9gBaerbd9wDYLwzYbItLDharqqtubsr 4rNCHbGeaGqiVu0Je9sqqrpepC0xbbL8F4rqqrFfpeea0xe9Lq=Jc9 vqaqpepm0xbba9pwe9Q8fs0=yqaqpepae9pg0FirpepeKkFr0xfr=x fr=xb9adbaqaaeGaciGaaiaabeqaamaabaabaaGcbaqcLbsaqaaaaa aaaaWdbiaaigdacaaIWaGaeyiSaalaaa@3A06@ .

Figure 3 The chordwise static surface pressure distributions for M = 0.83.

Figure 4 Trailing-edge expansion.

Figure 5 shows the results of pressure fluctuations for the open and transitional cavities for M = 0.83 in chordwise direction. For open cavities, a similar trend is evident in the distributions of C σ p MathType@MTEF@5@5@+= feaagKart1ev2aaatCvAUfeBSjuyZL2yd9gzLbvyNv2CaerbuLwBLn hiov2DGi1BTfMBaeXatLxBI9gBaerbd9wDYLwzYbItLDharqqtubsr 4rNCHbGeaGqiVu0Je9sqqrpepC0xbbL8F4rqqrFfpeea0xe9Lq=Jc9 vqaqpepm0xbba9pwe9Q8fs0=yqaqpepae9pg0FirpepeKkFr0xfr=x fr=xb9adbaqaaeGaciGaaiaabeqaamaabaabaaGcbaqcLbsacaGGdb qcfa4aaSbaaeaajugWaiabeo8aZTWaaSbaaKqbagaajugWaiaadcha aKqbagqaaaqabaaaaa@3E57@ with different values of δ / H MathType@MTEF@5@5@+= feaagKart1ev2aaatCvAUfeBSjuyZL2yd9gzLbvyNv2CaerbuLwBLn hiov2DGi1BTfMBaeXatLxBI9gBaerbd9wDYLwzYbItLDharqqtubsr 4rNCHbGeaGqiVu0Je9sqqrpepC0xbbL8F4rqqrFfpeea0xe9Lq=Jc9 vqaqpepm0xbba9pwe9Q8fs0=yqaqpepae9pg0FirpepeKkFr0xfr=x fr=xb9adbaqaaeGaciGaaiaabeqaamaabaabaaGcbaqcLbsaqaaaaa aaaaWdbiabes7aKjaac+cacaWGibaaaa@39CA@ ; in contrast, C σ p max MathType@MTEF@5@5@+= feaagKart1ev2aaatCvAUfeBSjuyZL2yd9gzLbvyNv2CaerbuLwBLn hiov2DGi1BTfMBaeXatLxBI9gBaerbd9wDYLwzYbItLDharqqtubsr 4rNCHbGeaGqiVu0Je9sqqrpepC0xbbL8F4rqqrFfpeea0xe9Lq=Jc9 vqaqpepm0xbba9pwe9Q8fs0=yqaqpepae9pg0FirpepeKkFr0xfr=x fr=xb9adbaqaaeGaciGaaiaabeqaamaabaabaaGcbaqcLbsacaGGdb qcfa4aaSbaaeaajugWaiabeo8aZTWaaSbaaKqbagaajugWaiaadcha ciGGTbGaaiyyaiaacIhaaKqbagqaaaqabaaaaa@412B@ immediately downstream of the cavities decreases as δ / H MathType@MTEF@5@5@+= feaagKart1ev2aaatCvAUfeBSjuyZL2yd9gzLbvyNv2CaerbuLwBLn hiov2DGi1BTfMBaeXatLxBI9gBaerbd9wDYLwzYbItLDharqqtubsr 4rNCHbGeaGqiVu0Je9sqqrpepC0xbbL8F4rqqrFfpeea0xe9Lq=Jc9 vqaqpepm0xbba9pwe9Q8fs0=yqaqpepae9pg0FirpepeKkFr0xfr=x fr=xb9adbaqaaeGaciGaaiaabeqaamaabaabaaGcbaqcLbsaqaaaaa aaaaWdbiabes7aKjaac+cacaWGibaaaa@39CA@ increases. For transitional cavities, the distributions of C σ p MathType@MTEF@5@5@+= feaagKart1ev2aaatCvAUfeBSjuyZL2yd9gzLbvyNv2CaerbuLwBLn hiov2DGi1BTfMBaeXatLxBI9gBaerbd9wDYLwzYbItLDharqqtubsr 4rNCHbGeaGqiVu0Je9sqqrpepC0xbbL8F4rqqrFfpeea0xe9Lq=Jc9 vqaqpepm0xbba9pwe9Q8fs0=yqaqpepae9pg0FirpepeKkFr0xfr=x fr=xb9adbaqaaeGaciGaaiaabeqaamaabaabaaGcbaqcLbsacaGGdb qcfa4aaSbaaeaajugWaiabeo8aZTWaaSbaaKqbagaajugWaiaadcha aKqbagqaaaqabaaaaa@3E57@ exhibit a similar trend with those for open cavities, and the C σ p MathType@MTEF@5@5@+= feaagKart1ev2aaatCvAUfeBSjuyZL2yd9gzLbvyNv2CaerbuLwBLn hiov2DGi1BTfMBaeXatLxBI9gBaerbd9wDYLwzYbItLDharqqtubsr 4rNCHbGeaGqiVu0Je9sqqrpepC0xbbL8F4rqqrFfpeea0xe9Lq=Jc9 vqaqpepm0xbba9pwe9Q8fs0=yqaqpepae9pg0FirpepeKkFr0xfr=x fr=xb9adbaqaaeGaciGaaiaabeqaamaabaabaaGcbaqcLbsacaGGdb qcfa4aaSbaaeaajugWaiabeo8aZTWaaSbaaKqbagaajugWaiaadcha aKqbagqaaaqabaaaaa@3E57@ amplitude demonstrates a slight drop with increasing δ / H MathType@MTEF@5@5@+= feaagKart1ev2aaatCvAUfeBSjuyZL2yd9gzLbvyNv2CaerbuLwBLn hiov2DGi1BTfMBaeXatLxBI9gBaerbd9wDYLwzYbItLDharqqtubsr 4rNCHbGeaGqiVu0Je9sqqrpepC0xbbL8F4rqqrFfpeea0xe9Lq=Jc9 vqaqpepm0xbba9pwe9Q8fs0=yqaqpepae9pg0FirpepeKkFr0xfr=x fr=xb9adbaqaaeGaciGaaiaabeqaamaabaabaaGcbaqcLbsaqaaaaa aaaaWdbiabes7aKjaac+cacaWGibaaaa@39CA@ . The effect of δ/H on C σ p max MathType@MTEF@5@5@+= feaagKart1ev2aaatCvAUfeBSjuyZL2yd9gzLbvyNv2CaerbuLwBLn hiov2DGi1BTfMBaeXatLxBI9gBaerbd9wDYLwzYbItLDharqqtubsr 4rNCHbGeaGqiVu0Je9sqqrpepC0xbbL8F4rqqrFfpeea0xe9Lq=Jc9 vqaqpepm0xbba9pwe9Q8fs0=yqaqpepae9pg0FirpepeKkFr0xfr=x fr=xb9adbaqaaeGaciGaaiaabeqaamaabaabaaGcbaqcLbsacaGGdb qcfa4aaSbaaeaajugWaiabeo8aZTWaaSbaaKqbagaajugWaiaadcha ciGGTbGaaiyyaiaacIhaaKqbagqaaaqabaaaaa@412B@ is shown in Figure 6. Increasing δ / H MathType@MTEF@5@5@+= feaagKart1ev2aaatCvAUfeBSjuyZL2yd9gzLbvyNv2CaerbuLwBLn hiov2DGi1BTfMBaeXatLxBI9gBaerbd9wDYLwzYbItLDharqqtubsr 4rNCHbGeaGqiVu0Je9sqqrpepC0xbbL8F4rqqrFfpeea0xe9Lq=Jc9 vqaqpepm0xbba9pwe9Q8fs0=yqaqpepae9pg0FirpepeKkFr0xfr=x fr=xb9adbaqaaeGaciGaaiaabeqaamaabaabaaGcbaqcLbsaqaaaaa aaaaWdbiabes7aKjaac+cacaWGibaaaa@39CA@ tends to reduce the strength of pressure fluctuations near the rear face of a cavity. Furthermore, this phenomenon is more pronounced for open cavities at low values of M.

Figure 5 The chordwise fluctuating pressure distributions for M = 0.83.
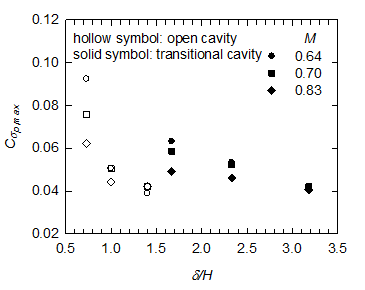
Figure 6 Peak pressure fluctuations.

Flow unsteadiness is associated with deviation of higher order moments (Skewness, α 3 MathType@MTEF@5@5@+= feaagKart1ev2aaatCvAUfeBSjuyZL2yd9gzLbvyNv2CaerbuLwBLn hiov2DGi1BTfMBaeXatLxBI9gBaerbd9wDYLwzYbItLDharqqtubsr 4rNCHbGeaGqiVu0Je9sqqrpepC0xbbL8F4rqqrFfpeea0xe9Lq=Jc9 vqaqpepm0xbba9pwe9Q8fs0=yqaqpepae9pg0FirpepeKkFr0xfr=x fr=xb9adbaqaaeGaciGaaiaabeqaamaabaabaaGcbaqcLbsacqaHXo qyjuaGdaWgaaqcbasaaKqzadGaaG4maaWcbeaaaaa@3AF3@ , and flatness, α 4 MathType@MTEF@5@5@+= feaagKart1ev2aaatCvAUfeBSjuyZL2yd9gzLbvyNv2CaerbuLwBLn hiov2DGi1BTfMBaeXatLxBI9gBaerbd9wDYLwzYbItLDharqqtubsr 4rNCHbGeaGqiVu0Je9sqqrpepC0xbbL8F4rqqrFfpeea0xe9Lq=Jc9 vqaqpepm0xbba9pwe9Q8fs0=yqaqpepae9pg0FirpepeKkFr0xfr=x fr=xb9adbaqaaeGaciGaaiaabeqaamaabaabaaGcbaqcLbsacqaHXo qyjuaGdaWgaaqcbasaaKqzadGaaGinaaWcbeaaaaa@3AF4@ , coefficients) with respect to the Gaussian distribution, in which the values of α 3 MathType@MTEF@5@5@+= feaagKart1ev2aaatCvAUfeBSjuyZL2yd9gzLbvyNv2CaerbuLwBLn hiov2DGi1BTfMBaeXatLxBI9gBaerbd9wDYLwzYbItLDharqqtubsr 4rNCHbGeaGqiVu0Je9sqqrpepC0xbbL8F4rqqrFfpeea0xe9Lq=Jc9 vqaqpepm0xbba9pwe9Q8fs0=yqaqpepae9pg0FirpepeKkFr0xfr=x fr=xb9adbaqaaeGaciGaaiaabeqaamaabaabaaGcbaqcLbsacqaHXo qyjuaGdaWgaaqcbasaaKqzadGaaG4maaWcbeaaaaa@3AF3@ and α 4 MathType@MTEF@5@5@+= feaagKart1ev2aaatCvAUfeBSjuyZL2yd9gzLbvyNv2CaerbuLwBLn hiov2DGi1BTfMBaeXatLxBI9gBaerbd9wDYLwzYbItLDharqqtubsr 4rNCHbGeaGqiVu0Je9sqqrpepC0xbbL8F4rqqrFfpeea0xe9Lq=Jc9 vqaqpepm0xbba9pwe9Q8fs0=yqaqpepae9pg0FirpepeKkFr0xfr=x fr=xb9adbaqaaeGaciGaaiaabeqaamaabaabaaGcbaqcLbsacqaHXo qyjuaGdaWgaaqcbasaaKqzadGaaGinaaWcbeaaaaa@3AF4@ are 0 and 3, respectively.13 α 3 MathType@MTEF@5@5@+= feaagKart1ev2aaatCvAUfeBSjuyZL2yd9gzLbvyNv2CaerbuLwBLn hiov2DGi1BTfMBaeXatLxBI9gBaerbd9wDYLwzYbItLDharqqtubsr 4rNCHbGeaGqiVu0Je9sqqrpepC0xbbL8F4rqqrFfpeea0xe9Lq=Jc9 vqaqpepm0xbba9pwe9Q8fs0=yqaqpepae9pg0FirpepeKkFr0xfr=x fr=xb9adbaqaaeGaciGaaiaabeqaamaabaabaaGcbaqcLbsacqaHXo qyjuaGdaWgaaqcbasaaKqzadGaaG4maaWcbeaaaaa@3AF3@ represents the asymmetry of the probability density function and the deviation in α 4 MathType@MTEF@5@5@+= feaagKart1ev2aaatCvAUfeBSjuyZL2yd9gzLbvyNv2CaerbuLwBLn hiov2DGi1BTfMBaeXatLxBI9gBaerbd9wDYLwzYbItLDharqqtubsr 4rNCHbGeaGqiVu0Je9sqqrpepC0xbbL8F4rqqrFfpeea0xe9Lq=Jc9 vqaqpepm0xbba9pwe9Q8fs0=yqaqpepae9pg0FirpepeKkFr0xfr=x fr=xb9adbaqaaeGaciGaaiaabeqaamaabaabaaGcbaqcLbsacqaHXo qyjuaGdaWgaaqcbasaaKqzadGaaGinaaWcbeaaaaa@3AF4@ shows the presence of more large amplitude events. The effect of δ / H MathType@MTEF@5@5@+= feaagKart1ev2aaatCvAUfeBSjuyZL2yd9gzLbvyNv2CaerbuLwBLn hiov2DGi1BTfMBaeXatLxBI9gBaerbd9wDYLwzYbItLDharqqtubsr 4rNCHbGeaGqiVu0Je9sqqrpepC0xbbL8F4rqqrFfpeea0xe9Lq=Jc9 vqaqpepm0xbba9pwe9Q8fs0=yqaqpepae9pg0FirpepeKkFr0xfr=x fr=xb9adbaqaaeGaciGaaiaabeqaamaabaabaaGcbaqcLbsaqaaaaa aaaaWdbiabes7aKjaac+cacaWGibaaaa@39CA@ on α 3 MathType@MTEF@5@5@+= feaagKart1ev2aaatCvAUfeBSjuyZL2yd9gzLbvyNv2CaerbuLwBLn hiov2DGi1BTfMBaeXatLxBI9gBaerbd9wDYLwzYbItLDharqqtubsr 4rNCHbGeaGqiVu0Je9sqqrpepC0xbbL8F4rqqrFfpeea0xe9Lq=Jc9 vqaqpepm0xbba9pwe9Q8fs0=yqaqpepae9pg0FirpepeKkFr0xfr=x fr=xb9adbaqaaeGaciGaaiaabeqaamaabaabaaGcbaqcLbsacqaHXo qyjuaGdaWgaaqcbasaaKqzadGaaG4maaWcbeaaaaa@3AF3@ and α 4 MathType@MTEF@5@5@+= feaagKart1ev2aaatCvAUfeBSjuyZL2yd9gzLbvyNv2CaerbuLwBLn hiov2DGi1BTfMBaeXatLxBI9gBaerbd9wDYLwzYbItLDharqqtubsr 4rNCHbGeaGqiVu0Je9sqqrpepC0xbbL8F4rqqrFfpeea0xe9Lq=Jc9 vqaqpepm0xbba9pwe9Q8fs0=yqaqpepae9pg0FirpepeKkFr0xfr=x fr=xb9adbaqaaeGaciGaaiaabeqaamaabaabaaGcbaqcLbsacqaHXo qyjuaGdaWgaaqcbasaaKqzadGaaGinaaWcbeaaaaa@3AF4@ for open and transitional cavities at x/L = 1.058 is presented in Figure 7. For either open or transitional cavities, δ / H MathType@MTEF@5@5@+= feaagKart1ev2aaatCvAUfeBSjuyZL2yd9gzLbvyNv2CaerbuLwBLn hiov2DGi1BTfMBaeXatLxBI9gBaerbd9wDYLwzYbItLDharqqtubsr 4rNCHbGeaGqiVu0Je9sqqrpepC0xbbL8F4rqqrFfpeea0xe9Lq=Jc9 vqaqpepm0xbba9pwe9Q8fs0=yqaqpepae9pg0FirpepeKkFr0xfr=x fr=xb9adbaqaaeGaciGaaiaabeqaamaabaabaaGcbaqcLbsaqaaaaa aaaaWdbiabes7aKjaac+cacaWGibaaaa@39CA@ has a subtle influence on α 3 MathType@MTEF@5@5@+= feaagKart1ev2aaatCvAUfeBSjuyZL2yd9gzLbvyNv2CaerbuLwBLn hiov2DGi1BTfMBaeXatLxBI9gBaerbd9wDYLwzYbItLDharqqtubsr 4rNCHbGeaGqiVu0Je9sqqrpepC0xbbL8F4rqqrFfpeea0xe9Lq=Jc9 vqaqpepm0xbba9pwe9Q8fs0=yqaqpepae9pg0FirpepeKkFr0xfr=x fr=xb9adbaqaaeGaciGaaiaabeqaamaabaabaaGcbaqcLbsacqaHXo qyjuaGdaWgaaqcbasaaKqzadGaaG4maaWcbeaaaaa@3AF3@ . On the other hand, with increasing δ / H MathType@MTEF@5@5@+= feaagKart1ev2aaatCvAUfeBSjuyZL2yd9gzLbvyNv2CaerbuLwBLn hiov2DGi1BTfMBaeXatLxBI9gBaerbd9wDYLwzYbItLDharqqtubsr 4rNCHbGeaGqiVu0Je9sqqrpepC0xbbL8F4rqqrFfpeea0xe9Lq=Jc9 vqaqpepm0xbba9pwe9Q8fs0=yqaqpepae9pg0FirpepeKkFr0xfr=x fr=xb9adbaqaaeGaciGaaiaabeqaamaabaabaaGcbaqcLbsaqaaaaa aaaaWdbiabes7aKjaac+cacaWGibaaaa@39CA@ , the value of α 4 MathType@MTEF@5@5@+= feaagKart1ev2aaatCvAUfeBSjuyZL2yd9gzLbvyNv2CaerbuLwBLn hiov2DGi1BTfMBaeXatLxBI9gBaerbd9wDYLwzYbItLDharqqtubsr 4rNCHbGeaGqiVu0Je9sqqrpepC0xbbL8F4rqqrFfpeea0xe9Lq=Jc9 vqaqpepm0xbba9pwe9Q8fs0=yqaqpepae9pg0FirpepeKkFr0xfr=x fr=xb9adbaqaaeGaciGaaiaabeqaamaabaabaaGcbaqcLbsacqaHXo qyjuaGdaWgaaqcbasaaKqzadGaaGinaaWcbeaaaaa@3AF4@ for the open cavity increases but that for the transitional cavity decreases. α 4 MathType@MTEF@5@5@+= feaagKart1ev2aaatCvAUfeBSjuyZL2yd9gzLbvyNv2CaerbuLwBLn hiov2DGi1BTfMBaeXatLxBI9gBaerbd9wDYLwzYbItLDharqqtubsr 4rNCHbGeaGqiVu0Je9sqqrpepC0xbbL8F4rqqrFfpeea0xe9Lq=Jc9 vqaqpepm0xbba9pwe9Q8fs0=yqaqpepae9pg0FirpepeKkFr0xfr=x fr=xb9adbaqaaeGaciGaaiaabeqaamaabaabaaGcbaqcLbsacqaHXo qyjuaGdaWgaaqcbasaaKqzadGaaGinaaWcbeaaaaa@3AF4@ at M = 0.64 and δ / H = 1.40 MathType@MTEF@5@5@+= feaagKart1ev2aaatCvAUfeBSjuyZL2yd9gzLbvyNv2CaerbuLwBLn hiov2DGi1BTfMBaeXatLxBI9gBaerbd9wDYLwzYbItLDharqqtubsr 4rNCHbGeaGqiVu0Je9sqqrpepC0xbbL8F4rqqrFfpeea0xe9Lq=Jc9 vqaqpepm0xbba9pwe9Q8fs0=yqaqpepae9pg0FirpepeKkFr0xfr=x fr=xb9adbaqaaeGaciGaaiaabeqaamaabaabaaGcbaqcLbsaqaaaaa aaaaWdbiabes7aKjaac+cacaWGibGaeyypa0JaaGymaiaac6cacaaI 0aGaaGimaaaa@3DB5@ is less than that at δ / H = 1.0 MathType@MTEF@5@5@+= feaagKart1ev2aaatCvAUfeBSjuyZL2yd9gzLbvyNv2CaerbuLwBLn hiov2DGi1BTfMBaeXatLxBI9gBaerbd9wDYLwzYbItLDharqqtubsr 4rNCHbGeaGqiVu0Je9sqqrpepC0xbbL8F4rqqrFfpeea0xe9Lq=Jc9 vqaqpepm0xbba9pwe9Q8fs0=yqaqpepae9pg0FirpepeKkFr0xfr=x fr=xb9adbaqaaeGaciGaaiaabeqaamaabaabaaGcbaqcLbsaqaaaaa aaaaWdbiabes7aKjaac+cacaWGibGaeyypa0JaaGymaiaac6cacaaI Waaaaa@3CF7@ , this requires further study. The variation of α 4 MathType@MTEF@5@5@+= feaagKart1ev2aaatCvAUfeBSjuyZL2yd9gzLbvyNv2CaerbuLwBLn hiov2DGi1BTfMBaeXatLxBI9gBaerbd9wDYLwzYbItLDharqqtubsr 4rNCHbGeaGqiVu0Je9sqqrpepC0xbbL8F4rqqrFfpeea0xe9Lq=Jc9 vqaqpepm0xbba9pwe9Q8fs0=yqaqpepae9pg0FirpepeKkFr0xfr=x fr=xb9adbaqaaeGaciGaaiaabeqaamaabaabaaGcbaqcLbsacqaHXo qyjuaGdaWgaaqcbasaaKqzadGaaGinaaWcbeaaaaa@3AF4@ with δ / H MathType@MTEF@5@5@+= feaagKart1ev2aaatCvAUfeBSjuyZL2yd9gzLbvyNv2CaerbuLwBLn hiov2DGi1BTfMBaeXatLxBI9gBaerbd9wDYLwzYbItLDharqqtubsr 4rNCHbGeaGqiVu0Je9sqqrpepC0xbbL8F4rqqrFfpeea0xe9Lq=Jc9 vqaqpepm0xbba9pwe9Q8fs0=yqaqpepae9pg0FirpepeKkFr0xfr=x fr=xb9adbaqaaeGaciGaaiaabeqaamaabaabaaGcbaqcLbsaqaaaaa aaaaWdbiabes7aKjaac+cacaWGibaaaa@39CA@ for the open cavity is more evident at larger M.

Figure 7 Skewness and flatness coefficients at x/L = 1.058.

Periodic vortex shedding and acoustic disturbance result in self-sustained oscillations in a cavity. The distributions of power spectral density for M = 0.83 with varying δ / H MathType@MTEF@5@5@+= feaagKart1ev2aaatCvAUfeBSjuyZL2yd9gzLbvyNv2CaerbuLwBLn hiov2DGi1BTfMBaeXatLxBI9gBaerbd9wDYLwzYbItLDharqqtubsr 4rNCHbGeaGqiVu0Je9sqqrpepC0xbbL8F4rqqrFfpeea0xe9Lq=Jc9 vqaqpepm0xbba9pwe9Q8fs0=yqaqpepae9pg0FirpepeKkFr0xfr=x fr=xb9adbaqaaeGaciGaaiaabeqaamaabaabaaGcbaqcLbsaqaaaaa aaaaWdbiabes7aKjaac+cacaWGibaaaa@39CA@ are presented in Figure 8. For an open cavity ( L / H   6.15 ) MathType@MTEF@5@5@+= feaagKart1ev2aaatCvAUfeBSjuyZL2yd9gzLbvyNv2CaerbuLwBLn hiov2DGi1BTfMBaeXatLxBI9gBaerbd9wDYLwzYbItLDharqqtubsr 4rNCHbGeaGqiVu0Je9sqqrpepC0xbbL8F4rqqrFfpeea0xe9Lq=Jc9 vqaqpepm0xbba9pwe9Q8fs0=yqaqpepae9pg0FirpepeKkFr0xfr=x fr=xb9adbaqaaeGaciGaaiaabeqaamaabaabaaGcbaqcfa4aaeWaaO qaaKqzGeaeaaaaaaaaa8qacaWGmbGaai4laiaadIeacqGHijYUcaqG GaGaaGOnaiaac6cacaaIXaGaaGynaaGcpaGaayjkaiaawMcaaaaa@4070@ , the peak frequencies of self-sustained oscillations decrease with increasing L. For example, the peak frequencies of the first mode are 2197, 1660, 1172 Hz for L = 31, 43, 59 mm, respectively. Although the second mode dominates for all three cases, the sound pressure levels (SPLs) of these peaks for δ / H =   0.73 MathType@MTEF@5@5@+= feaagKart1ev2aaatCvAUfeBSjuyZL2yd9gzLbvyNv2CaerbuLwBLn hiov2DGi1BTfMBaeXatLxBI9gBaerbd9wDYLwzYbItLDharqqtubsr 4rNCHbGeaGqiVu0Je9sqqrpepC0xbbL8F4rqqrFfpeea0xe9Lq=Jc9 vqaqpepm0xbba9pwe9Q8fs0=yqaqpepae9pg0FirpepeKkFr0xfr=x fr=xb9adbaqaaeGaciGaaiaabeqaamaabaabaaGcbaqcLbsaqaaaaa aaaaWdbiabes7aKjaac+cacaWGibGaeyypa0JaaeiiaiaaicdacaGG UaGaaG4naiaaiodaaaa@3E5D@ (L = 59 mm) are higher than those for δ / H = 1.00 MathType@MTEF@5@5@+= feaagKart1ev2aaatCvAUfeBSjuyZL2yd9gzLbvyNv2CaerbuLwBLn hiov2DGi1BTfMBaeXatLxBI9gBaerbd9wDYLwzYbItLDharqqtubsr 4rNCHbGeaGqiVu0Je9sqqrpepC0xbbL8F4rqqrFfpeea0xe9Lq=Jc9 vqaqpepm0xbba9pwe9Q8fs0=yqaqpepae9pg0FirpepeKkFr0xfr=x fr=xb9adbaqaaeGaciGaaiaabeqaamaabaabaaGcbaqcLbsaqaaaaa aaaaWdbiabes7aKjaac+cacaWGibGaeyypa0JaaGymaiaac6cacaaI WaGaaGimaaaa@3DB1@ and 1.40 (L = 43 and 31 mm, respectively). For a transitional cavity ( L / H   14.05 ) MathType@MTEF@5@5@+= feaagKart1ev2aaatCvAUfeBSjuyZL2yd9gzLbvyNv2CaerbuLwBLn hiov2DGi1BTfMBaeXatLxBI9gBaerbd9wDYLwzYbItLDharqqtubsr 4rNCHbGeaGqiVu0Je9sqqrpepC0xbbL8F4rqqrFfpeea0xe9Lq=Jc9 vqaqpepm0xbba9pwe9Q8fs0=yqaqpepae9pg0FirpepeKkFr0xfr=x fr=xb9adbaqaaeGaciGaaiaabeqaamaabaabaaGcbaqcfa4aaeWaaO qaaKqzGeaeaaaaaaaaa8qacaWGmbGaai4laiaadIeacqGHijYUcaqG GaGaaGymaiaaisdacaGGUaGaaGimaiaaiwdaaOWdaiaawIcacaGLPa aaaaa@4128@ , both the peak frequencies and their associated amplitudes are nearly the same. However, the level of energy in low-frequency range (1000–4000 Hz) observed for δ / H =  1 .67 MathType@MTEF@5@5@+= feaagKart1ev2aaatCvAUfeBSjuyZL2yd9gzLbvyNv2CaerbuLwBLn hiov2DGi1BTfMBaeXatLxBI9gBaerbd9wDYLwzYbItLDharqqtubsr 4rNCHbGeaGqiVu0Je9sqqrpepC0xbbL8F4rqqrFfpeea0xe9Lq=Jc9 vqaqpepm0xbba9pwe9Q8fs0=yqaqpepae9pg0FirpepeKkFr0xfr=x fr=xb9adbaqaaeGaciGaaiaabeqaamaabaabaaGcbaqcLbsaqaaaaa aaaaWdbiabes7aKjaac+cacaWGibGaeyypa0JaaeiiaiaabgdacaqG UaGaaeOnaiaabEdaaaa@3E4B@ (L = 59 mm) is higher than those observed for δ / H =  2 .33 MathType@MTEF@5@5@+= feaagKart1ev2aaatCvAUfeBSjuyZL2yd9gzLbvyNv2CaerbuLwBLn hiov2DGi1BTfMBaeXatLxBI9gBaerbd9wDYLwzYbItLDharqqtubsr 4rNCHbGeaGqiVu0Je9sqqrpepC0xbbL8F4rqqrFfpeea0xe9Lq=Jc9 vqaqpepm0xbba9pwe9Q8fs0=yqaqpepae9pg0FirpepeKkFr0xfr=x fr=xb9adbaqaaeGaciGaaiaabeqaamaabaabaaGcbaqcLbsaqaaaaa aaaaWdbiabes7aKjaac+cacaWGibGaeyypa0JaaeiiaiaabkdacaqG UaGaae4maiaabodaaaa@3E45@ and 3.18 (L = 43 and 31 mm, respectively). The effect of δ / H MathType@MTEF@5@5@+= feaagKart1ev2aaatCvAUfeBSjuyZL2yd9gzLbvyNv2CaerbuLwBLn hiov2DGi1BTfMBaeXatLxBI9gBaerbd9wDYLwzYbItLDharqqtubsr 4rNCHbGeaGqiVu0Je9sqqrpepC0xbbL8F4rqqrFfpeea0xe9Lq=Jc9 vqaqpepm0xbba9pwe9Q8fs0=yqaqpepae9pg0FirpepeKkFr0xfr=x fr=xb9adbaqaaeGaciGaaiaabeqaamaabaabaaGcbaqcLbsaqaaaaa aaaaWdbiabes7aKjaac+cacaWGibaaaa@39CA@ on the PSD distributions for M = 0.70 and 0.64 for a given L/H(≈ 6.15 and 14.05) shows a similar trend.
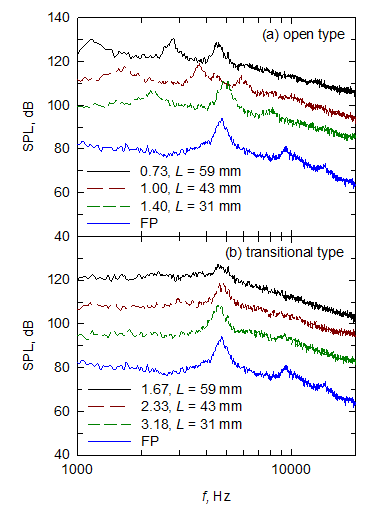
Figure 8 Power spectral density.

Conclusion

This experimental study determines the characteristics of square cavities at yaw ( β =   10 ° ) MathType@MTEF@5@5@+= feaagKart1ev2aaatCvAUfeBSjuyZL2yd9gzLbvyNv2CaerbuLwBLn hiov2DGi1BTfMBaeXatLxBI9gBaerbd9wDYLwzYbItLDharqqtubsr 4rNCHbGeaGqiVu0Je9sqqrpepC0xbbL8F4rqqrFfpeea0xe9Lq=Jc9 vqaqpepm0xbba9pwe9Q8fs0=yqaqpepae9pg0FirpepeKkFr0xfr=x fr=xb9adbaqaaeGaciGaaiaabeqaamaabaabaaGcbaqcLbsacaGGOa aeaaaaaaaaa8qacqaHYoGycqGH9aqpcaqGGaGaaGymaiaaicdacqGH WcaSpaGaaiykaaaa@3EB8@ for a compressible turbulent flow. For a given value of M, an increase in δ / H MathType@MTEF@5@5@+= feaagKart1ev2aaatCvAUfeBSjuyZL2yd9gzLbvyNv2CaerbuLwBLn hiov2DGi1BTfMBaeXatLxBI9gBaerbd9wDYLwzYbItLDharqqtubsr 4rNCHbGeaGqiVu0Je9sqqrpepC0xbbL8F4rqqrFfpeea0xe9Lq=Jc9 vqaqpepm0xbba9pwe9Q8fs0=yqaqpepae9pg0FirpepeKkFr0xfr=x fr=xb9adbaqaaeGaciGaaiaabeqaamaabaabaaGcbaqcLbsaqaaaaa aaaaWdbiabes7aKjaac+cacaWGibaaaa@39CA@ results in a suppression of trailing edge expansion downstream of the cavities. The effect of Mach number is minimal. Further, increasing δ / H MathType@MTEF@5@5@+= feaagKart1ev2aaatCvAUfeBSjuyZL2yd9gzLbvyNv2CaerbuLwBLn hiov2DGi1BTfMBaeXatLxBI9gBaerbd9wDYLwzYbItLDharqqtubsr 4rNCHbGeaGqiVu0Je9sqqrpepC0xbbL8F4rqqrFfpeea0xe9Lq=Jc9 vqaqpepm0xbba9pwe9Q8fs0=yqaqpepae9pg0FirpepeKkFr0xfr=x fr=xb9adbaqaaeGaciGaaiaabeqaamaabaabaaGcbaqcLbsaqaaaaa aaaaWdbiabes7aKjaac+cacaWGibaaaa@39CA@ reduces the strength of pressure fluctuations near the rear face of a cavity and this phenomenon is more pronounced for open cavities at low values of M. For self-sustained oscillations, the peak frequencies decrease with an increase in the cavity length. The SPLs of these peaks are higher at a lower value of δ / H MathType@MTEF@5@5@+= feaagKart1ev2aaatCvAUfeBSjuyZL2yd9gzLbvyNv2CaerbuLwBLn hiov2DGi1BTfMBaeXatLxBI9gBaerbd9wDYLwzYbItLDharqqtubsr 4rNCHbGeaGqiVu0Je9sqqrpepC0xbbL8F4rqqrFfpeea0xe9Lq=Jc9 vqaqpepm0xbba9pwe9Q8fs0=yqaqpepae9pg0FirpepeKkFr0xfr=x fr=xb9adbaqaaeGaciGaaiaabeqaamaabaabaaGcbaqcLbsaqaaaaa aaaaWdbiabes7aKjaac+cacaWGibaaaa@39CA@ .

Acknowledgements

The authors acknowledge the financial support by the Ministry of Science and Technology (MOST 103-2923-E-006-006-MY3).

Conflict of Interest

The authors declare that there is no conflict of interests regarding the publication of this paper.

References

  1. Lawson SJ, Barakos GN. Review of numerical simulations for high speed turbulent cavity flows. Progress in Aerospace Sciences. 2011;47(3):186‒216.
  2. Charwat AF, Roos JN, Dewey FC, et al. An investigation of separated flow. Part 1. The pressure field. J Aerospace Science. 1961;28(6):457‒470.
  3. Plentovich EB, Stallings RL, Tracy MB. Experimental cavity pressure measurements at subsonic and transonic speeds. NASA Technical Paper. 1993;3358:1‒80.
  4. Stallings RL, Wilcox F. Experimental cavity pressure distributions at supersonic speeds. NASA Technical Paper. 1987;2683:1‒77.
  5. Tracy MB, Plentovich EB. Cavity unsteady-pressure measurements at subsonic and transonic speeds. NASA Technical Paper. 1997;3669:1‒78.
  6. McGregor OW, White RA. Drag of rectangular cavities in supersonic and transonic flow including the effect of cavity resonance. AIAA J. 1970;8(11):1959‒1964.
  7. Lee KH, Chung KM, Chang KC. The effect of yaw Angle on a compressible rectangular cavity flow. Inter J Aero Eng Article. 2017. p. 13.
  8. Czech M, Savory E, Toy N, et al. Flow regimes associated with yawed rectangular cavities. The Aero J. 2001;105(1045):125‒134.
  9. Lada C, Kontis K. Experimental studies of open cavity configurations at transonic speeds with flow control. J Aircraft. 2011;48(2):719‒724.
  10. Sinha SN, Gupta AK, Oberai M. Laminar separating flow over backsteps and cavities. II cavities. AIAA J. 1982;20(3):370‒375.
  11. Grace SM, Dewar WG, Wroblewski DE. Experimental investigation of the flow characteristics within a shallow cavity for both laminar and turbulent upstream boundary layers. Experiments in Fluids. 2004;36(5):791‒804.
  12. Chung KM. Investigation on transonic convex-corner flows. Journal of Aircraft. 2002;39(6):1014‒1018.
  13. Kim J. On the structure of pressure fluctuations in simulated turbulent channel flow. J Fluid Mech. 1989;205:421‒451.
Creative Commons Attribution License

©2017 Lee, et al. This is an open access article distributed under the terms of the, which permits unrestricted use, distribution, and build upon your work non-commercially.