MOJ
eISSN: 2574-9773


Research Article Volume 1 Issue 4
Department of Physics, Walchand Institute of Technology, India
Correspondence: Hunge YM, Department of Physics, Walchand Institute of Technology, Solapur, Maharashtra, India
Received: July 20, 2017 | Published: August 21, 2017
Citation: Hunge YM. Photoelectrocatalytic degradation of methylene blue using spray deposited ZnO thin films under UV illumination. MOJ Poly Sci. 2017;1(4):135-139. DOI: 10.15406/mojps.2017.01.00020
ZnO thin films have been deposited onto glass and FTO coated glass substrates using spray pyrolysis method. The structural, morphological, compositional and photocatalytic properties of ZnO thin films are studied. The photoelectrochemical (PEC) study shows that, both short circuit current (Isc) and open circuit voltage (Voc) are (Isc=0.575mA and Voc=0.425V) relatively higher at 450°C substrate temperature. The structure and morphological properties of ZnO thin films are studied by X-ray diffraction (XRD), Field emission scanning electron microscopy (FE-SEM). XRD study reveals that the films are polycrystalline in nature with hexagonal crystal structure. FE-SEM images show that the substrate surface is well covered with a uniform and ball like morphology. Photoelectrocatalytic degradation of methylene blue dye in aqueous solutions is studied. The end result shows that the degradation percentage of methylene blue using ZnO photoelectrode has reached 95% under ultraviolet light illumination after 60 min.
Keywords: methylene blue (MB), spray pyrolysis method, zinc oxide (ZnO), pollution, industrialization, hazardous, contaminants, dye, acids, alcohols
MB, methylene blue; PEC, photo electrochemical; Isc, short circuit current; Voc, open circuit voltage; XRD, x-ray diffraction; FE-SEM, field emission scanning electron microscopy; AOP, advanced oxidation process; CBD, chemical bath deposition; EDS, energy dispersive x-ray spectroscopy; BET, brunauer-emmer-teller; FWHM, full width at half maximum
In recent year, the whole world facing the problem of pollution due to rapid development in industrialization and increase in population. Pollution may be in the form of sound, air and water pollution. Among these in recent few years’ water pollution is severe problem because 1.4 billion peoples are exposed to hazardous drinking water due to poor sources of water quality and absence of adequate water treatment methods.1-3 The removal of organic contaminants such as a dye, acids, alcohols, from the wastewater is a very serious problem in the world. These organic contaminants are responsible for increasing the water pollution. Different methods such as coagulation, filtration and adsorption, advanced oxidation process (AOP) have been used for the elimination organic impurities from the waste effluents.4,5 In the recent few years, advanced oxidation processes (AOPs), proved to be an effective process for the removal of organic impurities from the wastewater.6 Heterogeneous photocatalysis comes under AOPs and has marvelous potential to degrade the organic impurities present in the wastewater by means of oxidation- reduction reactions.7,8 Although there are several semiconductor materials have been used for the degradation of organic contaminants present in the wastewater, which includes such as TiO2, WO3, Bi2WO6, ZnO, Bi2O3, CdS etc.9 The biggest advantage of ZnO in comparison with TiO2 is that it absorbs over a larger fraction of UV spectrum and the corresponding threshold of ZnO is 425 nm. ZnO has emerged to be a more efficient catalyst concerning water detoxification because it generates H2O2 more efficiently with high reaction and mineralization rates. Also it has more number of surface active sites with high surface reactivity 10. ZnO has been found to be a suitable alternative to TiO2 and is in fact proven to be more efficient than TiO2 in the photo degradation of pesticides and herbicides. Thin films of ZnO are prepared by various methods, including sol-gel, chemical bath deposition (CBD), electron beam evaporation, hydrothermal route, vacuum evaporation and spray pyrolysis.11 Among these methods, spray pyrolysis method is a simple, coast effective and which can be used to deposit large area thin films with mechanical durability.
In the present work, ZnO thin films have been deposited onto the glass and FTO coated glass substrates by spray pyrolysis method and studied the effect of substrate temperatures on the structural, morphological properties ZnO thin films. The deposited thin films are characterized by the photo electrochemical (PEC), X-ray diffraction (XRD), Field emission scanning electron microscope (FE-SEM), Brunauer-Emmer-Teller (BET) and energy dispersive X-ray spectroscopy (EDS) techniques. The preparation of ZnO thin films by spray pyrolysis method and its use in the degradation of MB is reported first time. This paper presents detailed studies on degradation of methylene blue (MB) using ZnO photoelectrodes. Methylene blue (MB) has been successfully degraded using ZnO thin films, without the use of external catalyst like HClO4, NaH2PO4 etc.
Material synthesis
ZnO thin films are deposited onto glass and FTO coated glass substrates. The appropriate quantity of zinc acetate (Zn (CH3COO)2. 2H2O) Aldrich, 99.99%, AR grade is dissolved in double distilled water to obtain 0.1 M precursor solution. The substrate temperature varied from 400, at the interval of 50°C to 500°C. The substrate temperature was optimized by using PEC technique. The resulting 100 ml solution was sprayed onto pre-cleaned FTO substrates for different temperatures assisted with compressed air as a carrier gas. The fine aerosols of aqueous zinc acetate solution after being sprayed through an atomizer onto the preheated substrate underwent a pyrolytic decomposition, thereby forming a thin uniform solid film. While varying the substrate temperature, other preparative parameters such as solution concentration (0.1 M), spray rate (5cc/min), nozzle-to-substrate distance (32 cm) were kept constant for all experiments. For the application purpose the large area (10 ×10 × 0.125 cm3) ZnO electrodes were deposited by spray pyrolysis onto conducting glass plates (spray deposited fluorine doped tin oxide on corning glass, FTO, with sheet resistance of 10–20 Ὠ/sq.).
Catalyst characterization
The deposited thin films were characterized by the photo electrochemical (PEC), X-ray diffraction (XRD), Field emission scanning electron microscopy (FE-SEM), Brunauer-Emmer-Teller (BET), Energy dispersive X-ray spectroscopy (EDS) techniques. PEC cell consisting of ZnO thin film as photoelectrode, 0.05 M NaOH solution as an electrolyte and stainless steel as a counter electrode, were fabricated. The PEC cell was illuminated using ultraviolet light. The structural characterization of deposited thin films was carried out, by using the X-ray diffraction patterns obtained with CuKα radiation (λ = 1.5406A0) from a Bruker D2 Phase in the range of 25-70°C. The morphological characterization of the films was studied by using a MIRA3 XMU TESCAN field emission scanning electron microscope (FE-SEM). The surface area was analyzed by nitrogen adsorption/desorption at 77K using a Gas Sorption System (Micro-metrics, Instruments, ASAP 2420). The chemical composition of the thin films was examined using an energy dispersive X-ray spectroscopy (EDS) system attached to an FE-SEM (M MIRA3 XMU Tescon Orsay Holding). The thickness of the films was measured using Ambios XP- 100 stylus surface profilometer.
Photoelectrocatalytic degradation
In photo electrocatalytic degradation experiment, to study the photocatalytic activity of large area (64 cm2) deposited ZnO thin film, degradation reactor was fabricated by using ZnO thin film as a working electrode and stainless steel disc as a counter electrode. Teflon gasket was inserted in between the photoelectrode and the counter electrode, in order to bring the maximum number of impurities present in water in contact with the surface of photoelectrode. The photoelectrode was illuminated from the backside using ultraviolet light with the active surface area (64cm2). In order to increase the rate of reaction the external bias voltage of 1.5 V was applied using an Amel potentiostat (model 2059). The 0.05 mM methylene blue in aqueous electrolyte was used as model organic impurities for the degradation. The electrolyte was re circulated through the single PEC reactor with a constant flow rate 14.4 l/hr. using a Gilson MINIPLUS peristaltic pump, made in France with silicon tubing.12,13 The concentration of methylene blue in the solutions was determined at the time interval of 0, 10, 20, 30, 40, 50 and 60 minutes by measuring the extinction coefficient using a UV - Vis - NIR spectrophotometer. The extinction was measured in 1 cm quartz cell using UV- Vis-NIR spectrophotometer (Shimadzu: UV-1800).14
Photoelectrochemical (PEC) study
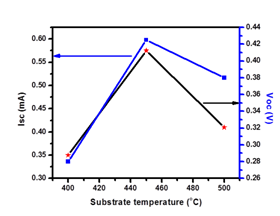
PEC cell is formed by the semiconductor electrode along with the counter electrode in an appropriate redox electrolyte. The glass/FTO/ZnO substrate and graphite are immersed in a 0.1 M NaOH solution and the difference between dark and light voltages is recorded using a voltmeter. After illumination, it is observed that both the Isc and Voc increase with increase in substrate temperature, attain a maximum value ((Isc = 0.575 mA & Voc = 0.425 V) for the film deposited at 4500C substrate temperature and then decrease with further increase in substrate temperature, which may be attributed to variation in the stoichiometry with respect to substrate temperature. The low values of Isc and Voc at low temperature are due to the partial decomposition of the spraying solution. The relatively maximum values of Isc and Voc at an optimized substrate temperature (4500C) may be due to the formation of stoichiometric compound. The decrease Isc and Voc after 450 0C temperature is due to evaporation of spraying solution, before reaching to the substrate. Figure 1 shows the variation of short-circuit current density (Isc) and open-circuit voltage (Voc) as a function of substrate temperature, which confirms 4500C substrate temperature is an optimized substrate temperature.15 The thickness of ZnO thin film deposited at 4500C substrarte temperature is 270 nm.

Figure 1 Variation of Isc (mA) and Voc (V) values against substrate temperature (0C) for ZnO thin films deposited on FTO coated glass substrates.
X-ray diffraction study
X-ray diffraction pattern of ZnO thin film deposited at optimized substrate temperature (4500C) are shown in Figure 2. It is seen that, the films deposited at 4500C is polycrystalline in nature, having hexagonal crystal structure. ZnO thin film deposited at 450°C is highly crystalline and having preferred orientation is observed along (002) plane. Higher intensity indicates higher extent of crystallization along that plane. The planes well match with the Joint Committee for Powder Diffraction Standards (JCPDS card No. 01-071-6424). Other planes at 2θ values 2θ = 47.73°, 56.74° and 62.94° are observed with relatively low intensity with (h k l) values (102), (103) and (201) respectively. The crystallite size (D) was calculated using the Debye - Scherrer’s formula.16
(1)
where λ = 1.5406 A° the wavelength of the CuKα line, β is the full width at half maximum (FWHM) for corresponding peak in radians and θ is the Bragg's angle. Crystallite size (D) is calculated for most prominent peak (002) for the film deposited at 450 0C is 29 nm.
Morphological study
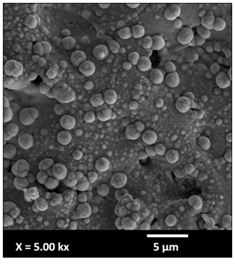
Field emission scanning electron microscopy (FE-SEM) image of ZnO thin films deposited at 4500C substrate temperatures is shown in the Figure 3. Deposited films are, compact, pin-hole-free and adherent to the substrate. At the optimized substrate temperature of 4500C, film surface is observed to be uniform. FE-SEM images show that the substrate surface is covered with a uniform and small ball like morphology, which increases the surface area which is useful for enhancing photocatalytic activity.
Brunauer-Emmer-Teller (BET) study
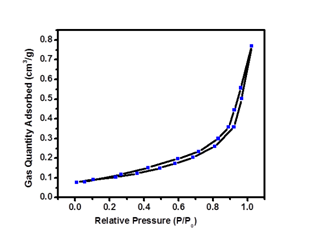
To examine the porous structure of the ZnO thin film nitrogen adsorption-desorption isotherms was measured and shown in Figure 4. It can be seen clearly that the sorption isotherms of the ZnO exhibit hysteresis loops, which are the main characteristics of the porous structure. BET measurement is used to calculate the active surface area available for the redox reactions.17 Film deposited at 4500C shows a BET surface area of 80.71 m2 /g. Such a large surface area of ZnO thin film is good material for high photocatalytic activity and offers more surface active sites for the adsorption of the organic molecules, which result in enhanced the photocatalytic activity.18

Figure 3 Field emission scanning electron micrograph of ZnO thin film deposited at 4500C substrate temperature.

Figure 4 Nitrogen adsorption-desorption isotherm of ZnO thin film deposited at 4500C substrate temperature.
Energy dispersive X-ray spectroscopy (EDS) study
The chemical composition and stoichiometry of ZnO thin film is examined by using energy dispersive X-ray spectroscopy. Figure 5 shows EDS pattern of ZnO thin films deposited onto glass substrates by spray pyrolysis method. The study reflects the presence of two elements Zn and O and no other element or impurity found in the fabricated sample. Table 1 shows the EDS data of ZnO thin film. The atomic percentage of the Zn and O elements in the ZnO thin films are 53.12% and 46.88 % respectively.
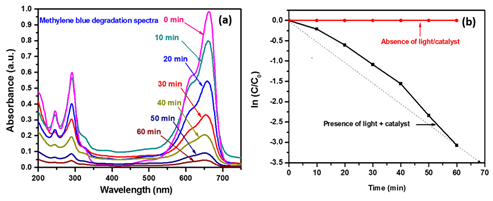
The photo electrocatalytic degradation of methylene blue under the ultraviolet light irradiation is performed to investigate the photocatalytic activity of ZnO photoelectrode using the single cell photo electrochemical reactor with electrical bias 1.5 V and backside illumination. The cell was illuminated with 20 W UV OMNILUX lamp with an excitation wavelength of 365 nm. Figure 6(A) shows the change in extinction spectra of MB collected at various time intervals during its photo electrocatalytic degradation experiment. The extinction spectra are recorded in the wavelength range from 200 to 750 nm. Figure 6(A) shows the maximum absorbance at 660 nm decreased gradually and finally disappeared after 60 min indicating the complete photo electrocatalytic degradation of MB but, there is shift in absorbance peak with irradiation time this is may be due the formation of byproduct during the degradation process. During the course of the degradation experiments, the concentration of MB decreases due to its photo electrochemical oxidation of MB present in the polluted water. The continuous decrease of the absorbance indicates decrease in MB concentration and this decrease in MB concentration is visually confirmed by the reaction solution decoloration. In this experiment the degradation percentage (%) of is calculated by using the following formula19
(2)

Figure 6 A) Extinction spectra for degradation of methylene blue using ZnO thin film, B) Kinetics of degradation.
where, Ext0 is an extinction of organic impurities taken at time 0 min. i.e. before starting the experiment and Extt is extinction taken after completion of the experiment. It is found that, the 95 % degradation of MB dye is observed in 60 min under ultraviolet light illumination. The kinetics of reaction can be expressed using equation and follows a pseudo first order reaction.20
(3)
where C stands for the concentration of the solute or the concentration of oxidizable atoms in the organic compound; C0 the initial concentration of solute t is the time, k can be taken as the apparent first order rate constant of the degradation reaction. Moreover, k is proportional to the area of the electrode and therefore to the photocurrent.21 The extinction is further used to plot variation in ln (Ext/Ext0) as a function of reaction time as shown in Figure 6(B). The slope of this plot gives the rate constant (k), to be k = 4.18×10⁻⁵s-1. In the absence of light and catalyst there is no degradation because there is no redox reactions take place on the surface of photo catalyst.22
The ZnO thin films can successfully be synthesized by spray pyrolysis method. The effect of the substrate temperature on the structural, optical properties of the sprayed ZnO thin films is studied. The photo electrochemical (PEC) study optimizes the substrate temperature. The films are polycrystalline in nature with hexagonal crystal structure. The FE-SEM study reveals that the surface is well covered with the ball like morphology at the optimized substrate temperature of 450°C. EDS study reveals that the deposited film contains Zn and O elements. The oxidative degradation of methylene blue dye is achieved up to 95 % using ZnO photoelectrodes under ultraviolet light illumination.
None.
The author declares no conflict of interest

©2017 Hunge. This is an open access article distributed under the terms of the, which permits unrestricted use, distribution, and build upon your work non-commercially.