MOJ
eISSN: 2374-6912


Research Article Volume 3 Issue 1
1Department of Otolaryngology, Head and Neck Surgery, First Affiliated Hospital of Anhui Medical University, China
2Center for Biotechnology and Genomic Medicine, Medical College of Georgia, USA
Correspondence: Yehai liu, Department of Otolaryngology, Head and Neck Surgery, First Affiliated Hospital of Anhui Medical University, China.
Co-correspondence: Liyong Zhang, Center for Biotechnology and Genomic Medicine,Medical College of Georgia, USA
Received: December 16, 2015 | Published: January 27, 2016
Citation: Liu Y, Liu Z, Xia Z, et al. Up-regulation of microrna-125b induced by 5-fluorouracil (5-FU) treatment inhibits cell growth and proliferation in pancreatic cancer cells. MOJ Cell Sci Rep. 2016;3(1):30-37. DOI: 10.15406/mojcsr.2016.03.00048
MicroRNAs (miRNAs) are a class of small non-coding RNAs that play regulatory roles in protein synthesis by repressing translation or cleaving RNA transcripts. Their aberrant expression has been shown to be involved in human diseases, including cancer. The functional importance of miRNAs is evidenced by many biological processes in which they are implicated, including developmental timing, cell proliferation, apoptosis, metabolism, cell differentiation and morphogenesis. However, little is known about the roles of miRNAs in 5-Fluorouracil (5-FU) resistance and metabolism pathway in pancreatic cancer cells. To address this enigma, miRNA profiles that correlate with 5-FU treatments are defined using miRNA microarray, and comparison of miRNA profiles reveals specific differences between untreated and 5-FU treated pancreatic cancer cells. A subset of miRNAs is being upregulated in 5-FU treated pancreatic cancer cells, with the most significantly upregulated miRNAs being miR-125b, miR-181a, miR-181b, miR-181d, miR-27a, miR-222, miR-30a-5pre and miR-495. Transient transfection of the Pre-miRTM miRNA precursor molecules for miR-125b showed that it inhibited cell proliferation. Expression plasmids of miR-125b were constructed and transfected into human pancreatic cancer cell line PANC-1. PANC-1 miR-125b transfected stable clones showed decreased cell growth and proliferation. Our study suggested that miR-125b may act as a tumor suppressor and present a novel strategy for anticancer therapy.
Keywords: microRNA microarray; 5-FU; Pancreatic cancer; microRNA-125b; Cell growth; Cell proliferation
5-FU: 5-Fluorouracil; miRNA: microRNA; FBS: Fetal Bovine Serum; DMEM: Dulbecco’s Modified Eagle’s medium
Pancreatic cancer is one of the most frequently reported gastrointestinal tumors and has been reported to have a 5-year survival rate of < 5%. It is most commonly diagnosed at an advanced stage and the most frequently administered chemotherapeutic compound for patients with advanced disease has been 5-Fluorouracil (5-FU) [1]. 5-FU alone remains one of the standard treatments in advanced pancreatic cancer. The well-known mechanism of the anti-tumor effects of 5-FU is to inhibit DNA and RNA synthesis [1]. In addition, cell resistance to cytotoxic agents and radiation are two other factors contributing to the poor prognosis of pancreatic cancer [2].
Recently it has been demonstrated that miRNAs may provide an additional post-transcriptional mechanism by which protein expression can be negatively regulated by either translational repression or mRNA degradation. MiRNAs are produced endogenously in mammalian cells approximately 60-nt long pre-miRNA hairpin intermediates. They are further processed to around 22-nt miRNA duplexes which regulate the stability or translational efficiency of target mRNAs by base-pairing to complementary sites on the targets [3]. The functional importance of miRNAs is evidenced by many biological processes in which they are involved, including developmental timing, cell proliferation, apoptosis, metabolism, cell differentiation and morphogenesis [4,5]. It has been shown that miRNAs are aberrantly expressed or mutated in cancer, suggesting that they may play a role as a novel class of oncogenes or tumor suppressor genes [6,7]. However, the roles of miRNAs in 5-FU resistance and metabolism pathway remain largely unknown in pancreatic cancer cells. Our study was concentrated on defining miRNA profiles correlated with 5-FU treatment in pancreatic cancer. By comparing miRNA profiles of 5-FU treated and non-treated pancreatic cancer cells, we were able to identify potential upregulated miRNAs as a result of 5-FU treatment in pancreatic cancer cells. The functional study further confirmed miR-125b maybe served as a tumor suppressor gene.
Cell culture and 5-FU treatment
Human pancreatic cell lines PANC-1 and Panc-10.05 were purchased from American Type Culture Collection (ATCC, Manassas, VA). PANC-1 was maintained in Dulbecco’s Modified Eagle’s medium (DMEM, HyClone, Logan, UT) supplemented with 10% fetal bovine serum (FBS) (Sigma, St. Louis, MO, USA), 100 μg/ml streptomycin and 100 μg/ml penicillin (pH 7.2-7.4). Panc-10.05 was maintained in RPMI-1640 medium (HyClone, Logan, UT) supplemented with 15% fetal FBS 100 μg/ml streptomycin and 100 μg/ml penicillin (pH 7.2-7.4). MTT assay was performed to determine the 5-FU (Sigma, St. Louis, MO, USA) concentration causing 50% growth inhibition (IC50) for PANC-1 and Panc-10.05 after 72 hours of 5-FU treatment compared with the control groups which have no treatment.
RNA extraction
Total RNAs were isolated using mirVanaTM miRNA Isolation Kit (Ambion, Austin, Texas) according to the instructions of the manufacturer. The quality of the RNA was assessed by 15% denaturing polyacrylamide gel electrophoresis and spectrophotometry (Eppendorf BioPhotometer, Eppendorf, Hamburg, Germany).
MicroRNA microarray
MiRNA microarray analysis was performed by LC Sciences (http://www.lcsciences.com/; Houston, TX). In brief, poly-A tails were added to the RNA sequences at the 3’-ends using a poly (A) polymerase, and nucleotide tags were then ligated to the poly-A tails. For each dual-sample experiment, two-sets of RNA sequences were added with tags of two different sequences. The tagged RNA sequences were then hybridized to the miRNA microarray chip (Atactic µ ParaFlo™ micro fluidics chip, LC Sciences, Houston, Texas) containing 328 human mature miRNA transcripts listed in Sanger miRBase Release 8.0 (http://www.sanger.ac.uk/Software/Rfam/mirna). The probe sequences are available upon request. The labeling reaction was carried out during the second hybridization reaction using tag-specific dendrimer Cy3 and Cy5 dyes. Total RNAs from untreated cells and cells treated with 5-FU were labeled with Cy3 and Cy5, respectively. The human miRNA chip includes nine repeats for each miRNA. Multiple control probes were included in each chip, which were used for quality control of chip production, sample labeling and assay conditions. Hybridization signals were detected by Axon Genepix 4000B Microarray Scanner (Molecular Devices, Sunnyvale, CA) and saved as TIFF files. Numerical intensities were extracted for control, background, and miRNA probes and converted into Microsoft Excel spreadsheets.
Data analysis
The data were corrected by subtracting the background and normalizing to the statistical median of all detectable transcripts. Background was calculated from the median of 5% to 25% of the lowest-intensity cells. The data normalization balances the intensities of Cy3- and Cy5-labeled transcripts so that differential expression ratios can be correctly calculated. Statistical comparisons were performed by ANOVA (Analysis of Variance) using the Benjamini and Hochberg correction for false-positive reductions. Differentially detected signals were generally accepted as true when the ratio of the P value was less than 0.01. Clustering analysis was made with a hierarchical method and visualized using the TIGR MeV (Multiple Experimental Viewer) (the Institute for Genomic Research) microarray program.
Real-time RT-PCR
Expression of miRNAs was measured using mirVanaTM qRT-PCR miRNA Detection Kit and mirVana™ qRT-PCR Primer Sets (Ambion, Austin, Texas) according to the instructions of the manufacturer. Briefly, cDNA was generated after reverse transcription of 20 ng of total RNA. The PCR reaction consisting of appropriate number of cycles (95 °C for 15 s, 60 °C for 30 s) was performed using an iCycler (Bio-Rad, Hercules, CA) after an initial denaturation step (95 °C for 3 min). Moreover, the real-time PCR products were separated on a 3.5% agarose gel and visualized with ethidium bromide on the ChemiImager Imaging System 5500 (Alpha Innotech, San Leandro, CA). The 5 S RNA was used as an internal control.
Northern blotting
Northern blot analysis was performed as previously described [8]. Briefly, 10 µg of RNA from each sample was separated on 15% polyacrylamide gel with 8 M urea and transferred onto Bright Star®-Plus positively charged nylon membrane (Ambion, Austin, Texas) using semi-dry transfer apparatus (Bio-Rad, Hercules, CA). Blots were prehybridized at 65°C for 1 hour in prehybridization buffer (200 mM Na2HPO4, pH7.0, 5% SDS) and subjected to hybridization with 32P-labeled miR-125b, -181a, -181b, -27a or -222 probe overnight. 32P-labeled U6 probe was used as an internal control. Following hybridization, membranes were washed twice for 10 min each at 25°C using low-strengency buffer (25 mM Na2HPO4, pH7.5, 5% SDS, 3×SSC), and once for 10 minutes at 42°C using high-strengency buffer (1% SDS, 1×SSC). The blots were exposed to X-ray film for 72-96 hours (PIERCE, Rockford, IL). The oligonucleotides used as probes are the complementary sequences of the mature miRNA obtained from miR Registry (http://www.sanger.ac.uk/Software/Rfam/mirna/). miR-125b: 5’-tcacaagttagggtctcaggga-3’; miR-181a: 5’-actcaccgacagcgttgaatgtt-3’; miR-181b: 5’-cccaccgacagcaatgaatgtt-3’; miR-27a: 5’-gcggaacttagccactgtgaa-3’ and miR-222: 5’-gagacccagtagccagatgtagct-3’. An oligonucleotides complementary to the U6 RNA (5’-gcaggggccatgctaatcttctctgtatcg-3’) was as control used to normalize expression levels.
Transient transfection
The Pre-miRTM miRNA Precursor Molecules for miR-125b were purchased from Ambion (Austin, TX). Transfection was performed using LipofectamineTM 2000 (Invitrogen, Carlsbad, CA) according to the instructions of the manual. Briefly, PANC-1 and Panc10.05 cells were seeded on 6-well plates one day before transfection. Next day Pre-miRTM miRNA Precursor Molecules were diluted in 250 μl of Opti-MEM, and mixed gently. Meanwhile, 10 μl LipofectamineTM 2000 was diluted in 250 μl of Opti-MEM, and mixed gently. After incubation of 20 minutes at room temperature, the diluted Pre-miRTM miRNA Precursor Molecules were combined with diluted LipofectamineTM 2000, and mixed gently for incubation of 5 minutes at room temperature. The complexes were added to each well containing cells and medium. Cells were incubated at 37°C in CO2 for 24 hours prior to testing.
Preparation of constructs and stable transfection
A single-stranded DNA oligos was designed for hsa-miR-125b according to the instructions of the BLOCK-iT Pol II miR RNAi Expression Vector kit (Invitrogen, Carlsbad, CA). The top and bottom strand oligos were annealed to generate a double-stranded oligo suitable for cloning into the pcDNA6.2-GW/EmGFP-miR vector (Invitrogen, Carlsbad, CA). The pcDNA6.2-GW/EmGFP-miR-neg control plasmid contains an insert between bases 1519 and 1578 that can form a hairpin structure just as a regular pre-miRNA, but is designed not to target any known vertebrate gene. TOP10 competent E. coli was transformed with the expression plasmid. Plasmid DNA was isolated and sequenced by automated sequencing to confirm the sequence. Stable transfection was performed in both PANC-1 and Pac-10.05 cells. Cells were transfected with either the expression plasmid or the control vector using LipofectamineTM 2000 (Invitrogen, Carlsbad, CA). After blasticidin (3μg/ml, Invitrogen, Carlsbad, CA) screening, the stable clones were identified by semi-quantitative RT-PCR and Northern blot.
MTT assay
Cell proliferation rate was determined by MTT assay. Parent cells and transfectants with miR-125b expression plasmid as well as control vector clones were digested with trypsin and inoculated in 96-well plates at a concentration of 1×10³ cells/well after counting. Cells were incubated at 37°C in a humidified incubator containing 5% CO2. Cell viability was examined every day for 7 days. According to manufacture instructions, 30 µl of MTT (5 mg/ml, dissolved in 1×PBS) was added to each well. The plates were incubated for an additional 4 hour, then measured the absorbance at 570 nm in a Bio-Kinetics Reader (Bio-Rad) after 150 ml of DMSO was added to each well to solubilize the formazan crystals. Experiments were carried out in quadruplicate, and the results were shown as mean ± SD of three independent experiments.
Clonogenecity assay
Parent cells and stable clones with miR-125b expression plasmid as well as control vector were digested with trypsin and seeded in 10 cm petri dishes at a concentration of 500 cells/well after counting. The plates were incubated at 37 °C in a humidified incubator containing 5% CO2. When the colonies became visible (2-4 weeks), cells were fixed with methanol, stained with Gimesa and counted. Experiments were carried out in triplicate, and the results were shown as mean ± SD of three independent experiments.
Flow cytometry assay
Flow cytometry assay was performed by propidium iodide (PI) staining. Parent cells and clones with miR-125b, as well as control vector were grown to 80-90% confluence, then digested with trypsin, washed twice with PBS and fixed overnight at 4 0C in 70% ethanol. The fixed cells were washed twice with PBS and then incubated with 5 μg/ml PI and 50 μg/ml RNase A in PBS for 1 hour at room temperature. Flow activated cell sorter analysis was carried out using a FACS Calibur flow cytometer (Becton Dickson, Mountain View, CA) with CELLQUEST software. A total of 10,000 events were measured per sample.
RT-PCR array
The Human Apoptosis PCR Array was performed (Superarray Biosciences Corporation, Frederick, MD) according to the instructions of the manufacturer. Briefly, 500 ng total RNA of each sample was transcribed to the first-stranded cDNA. Then aliquoted the mixture to the 96-well PCR Array plate after mixing the cDNA with the real-time PCR master mix. Real-time RCR was carried out on the iCycler (Bio-Rad, Hercules, CA). The data was analyzed using the PCR Array analysis template provided by the manufacturer.
Western Blot
Total cell lysates were prepared with the lysis buffer [1% SDS, 10 mmol/L Tris-HCl (pH 7.6), 20 µg/µL aprotinin, 20 µg/µL leupeptin, and 1 mmol/L 4-(2-aminoethyl) benzenosulfonyl fluoride]. The protein concentration was determined using the Bicinchoninic Acid Protein Assay kit (Pierce, Rockford, IL). Equal amounts of protein samples were separated on SDS-PAGE gels and transferred to polyvinylidene difluoride membranes (Millipore, Billerica, MA). After blocking, the membranes were incubated with mouse monoclonal antibody against IGF1R (1:200 dilution; Santa Cruz Biotechnology, Inc., Santa Cruz, CA), and rabbit anti-human BIRC1 (1:1,000 dilution; R&D Systems, Inc. Minneapolis, MN), at 4°C overnight. After washing, the membranes were incubated with secondary antibody at a dilution of 1:3,000 at room temperature for 1 hour. Proteins were detected with the enhanced chemiluminescence kit (Amersham Pharmacia Biotechnology, Inc., Piscataway, NJ) and anti-ß-actin antibody (Sigma, St. Louis, MO) was used as loading control.
Statistical analysis
Results were shown as mean ± SD. Student’s t test was used for comparison unless particular test was notified. P < 0.05 was considered statistically significant.
Determination of IC50 for PANC-1 and Panc-10.05
IC50 is necessary for this study. Therefore, both pancreatic cell lines PANC-1 and Panc 10.05 were treated for 72 hours with various concentrations of 5-FU. MTT assay results indicated that IC50 for PANC-1 and Panc-10.05 are 75 μg/ml and 200μg/ml, respectively. These concentrations were the guideline for the 5-FU treatment in this study.
MiRNA profiles correlated to 5-FU induced cell toxicity
In order to examine the miRNA profiles correlated with 5-FU induced cell toxicity towards pancreatic cancer cells, total RNAs from 5-FU treated and non-treated pancreatic cancer cells were isolated and miRNA microarray analyses were performed after assessing the quality of total RNA. Correlation analysis was performed to ensure the quality of miRNA microarray analysis. By correlating the results from 2 chips, the fluorescence labeling, handling, and system related biases can be eliminated and therefore the expression pattern and level are reliable to the true biological differences. A list of differentially expressed miRNAs (at P < 0.01) between 5-FU treated and untreated cells was identified and presented in Table 1. We further selected miR-125b, miR-181a, miR-181b, miR-27a and miR-222 based on the differential expression ratio (ratio > 1.5) and availability of the primer set for validation.
miRNA Candidatesb |
+/- ratioc |
Chromosomal Location |
Up-regulated |
||
hsa-let-7g |
1.5 |
3p21.2 |
hsa-let-7i |
1.42 |
12q14.1 |
hsa-mir-100 |
2.13 |
11q24.1 |
hsa-mir-103-1 |
1.67 |
5q34 |
hsa-mir-103-2 |
1.67 |
20p13 |
hsa-mir-107 |
1.69 |
10q23.31 |
hsa-mir-125a |
1.82 |
19q13.41 |
hsa-mir-125b-1 |
4.02 |
11q24.1 |
hsa-mir-125b-1 |
4.02 |
21q21.1 |
hsa-mir-181a-1 |
2.31 |
1q31.3 |
hsa-mir-181a-2 |
2.31 |
9q33.3 |
hsa-mir-181b-1 |
2.72 |
1q31.3 |
hsa-mir-181b-2 |
2.72 |
9q33.3 |
hsa-mir-181d |
4.33 |
19p13.12 |
hsa-mir-20a |
1.43 |
13q31.3 |
hsa-mir-221 |
1.44 |
Xp11.3 |
hsa-mir-222 |
1.63 |
Xp11.3 |
hsa-mir-27a |
2.38 |
19p13.12 |
hsa-mir-29a |
1.52 |
7q32.3 |
hsa-mir-30a-5pre |
1.78 |
6q13 |
hsa-mir-30c-1 |
1.25 |
1p34.2 |
hsa-mir-30c-2 |
1.25 |
1q13 |
hsa-mir-31 |
1.64 |
1p21.3 |
hsa-mir-495 |
2.42 |
14q32.31 |
Down-regulated |
||
hsa-let-7a-1 |
0.83 |
9q22.32 |
hsa-let-7a-2 |
0.83 |
11q24.1 |
hsa-let-7a-3 |
0.83 |
22q13.31 |
hsa-mir-10a |
0.77 |
11q21.32 |
hsa-mir-15b |
0.73 |
3q25.33 |
hsa-mir-191 |
0.68 |
3p21.31 |
hsa-mir-21 |
0.76 |
17q23.2 |
Table 1: Differentially expressed miRNAs between 5-FU treated and untreated cellsa.
Validation of selected differentially expressed miRNAs Five differentially over-expressed miRNA candidates miR-125b, miR-181a, miR-181b, miR-27a and miR-222 were verified by real-time RT-PCR and Northern blot in 5-FU treated and non-treated pancreatic cancer cells. The results indicated that miR-125b, miR-181a, miR-181b, miR-27a and miR-222 were indeed overexpressed in 5-FU treated PANC-1 and Panc-10.05 cells by both real-time RT-PCR (Figure 1A) and Northern blot analysis (Figure 1B). These results were consistent with what we observed from the miRNA microarray analysis.
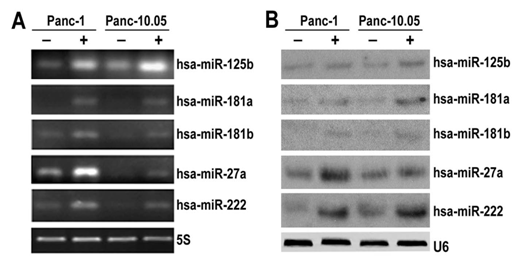
Figure 1: Confirmation of miRNA microarray results.
Inhibition of cell proliferation of miR-125b In order to evaluate the functions of miRNAs correlated with 5-FU treatment, miRNA precursors were introduced into the cells and the cell proliferation was examined. Transient transfection was performed to determine the minimum concentration of the precursor molecules of selected miRNA to reduce cell toxicity and nonspecific effects. Real-time RT-PCR results showed that the minimum concentration of miR-125b precursor was 2.5 nM for both PANC-1 and Panc-10.05 (Figure 2). We also compared the inhibition of the cell growth rate between the minimum (2.5 nM) and maximum (80 nM) concentration of the miRNA precursor and found no significant difference (at P < 0.05, Data not shown). Therefore, the minimum concentration of miR-125b precursor was used for the following experiments.
MTT assay of transient transfection with the minimum concentration of miRNA precursors showed that miR-125b inhibited cell proliferation in both PANC-1 cells (50%) and Panc-10.05 cells (75%) (Figure 2 & 3). But it did not achieve the same inhibition effects as 5-FU treatment.
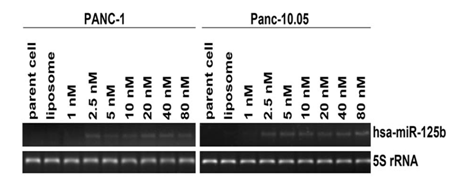
Figure 2: Optimization experiment for transient transfection of miR-125b.
The final concentration of miR-125b was 2.5 nM for PANC-1 and Panc-10.05.
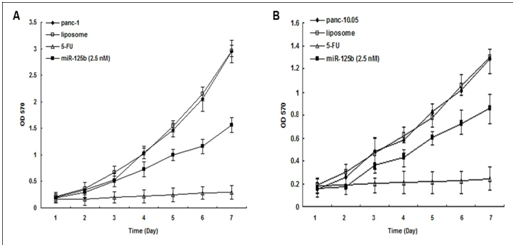
Figure 3: MTT assay for miR-125b transient transfection.
miR-125b inhibited PANC-1 cell growth and proliferation individually compared with controls. PANC-1: parental cells; panc-10.05: parental cells; liposome: parental cells with Lipofectamine 2000 only.
Selection of positive miR-125b stable transfected clones A single-stranded DNA oligos for miR-125b (Table 2) was designed and synthesized to construct the expression plasmids. After the expression plasmid contain the desired miRNA was constructed, the sequence was verified and confirmed. Sequencing results were analyzed using the program SeqManTM of DNAStar software (DNAStar, Inc.). Pancreatic cancer cell lines PANC-1 and Panc-10.05 were stably transfected with either the expression plasmid or the control vector using LipofectamineTM 2000. After blasticidin (3μg/ml, Invitrogen, Carlsbad, CA) screening, the stable clones from PANC-1 were identified by real-time RT-PCR and Northern blot analysis (Figure 4). We screened 30 clones from each stable transfection experiment and 4 positive clones were selected for the further characterization. We also tried different transfection reagents (LipofectamineTM 2000 and LipofectamineTM LTX) and different concentrations of blasticidin (0.5μg/ml, 1.5μg/ml and 3μg/ml respectively), but there were no stable clones obtained from Panc-10.05 cell transfection. It may be due to its sensitivity to blasticidin.
Top Strand Oligo |
5’-TGCTGTCCCTGAGACCCTAACTTGTGGTTTTGGCCACTGACTGACCACAAGTTGGTCTCAGGGA-3’ |
Bottom Strand Oligo |
5’-CCTGTCCCTGAGACCAACTTGTGGTCAGTCAGTGGCCAAAACCACAAGTTAGGGTCTCAGGGAC-3’ |
Table 1: DNA oligo sequences utilized to construct the miR-125b expression plasmids.
Characteristics of miR-125b stable transfected clones
In order to determine which positive clone had the same characteristics as the 5-FU treated cells, cell growth and proliferation rate of stable clones with miR-125b were tested using MTT assay and Clonogenecity assay. Results shown in Figure 5 and Figure 6 indicated different characteristics of each stable transfected clone. In miR-125b stable transfected clones, only clones 5 and 14 showed a significantly inhibition of cell growth and proliferation rate compared with the control vector clones and PANC-1 parent cells under normal culture conditions (Figure 5B & 6B). From these results, we selected clones 5 & 14 which have repressed growth rate similar to the 5-FU treated cells and precursor molecules transfected cells.
Inhibition of cell proliferation can be the consequence of cell cycle arrest. Therefore, flow cytometry was performed to determine the alteration of cell cycle. As shown in Figure 7, miR-125b stable transfected clones 5 and 14 showed G2/M phase arrest compared with the control vector clones, while no apoptosis was detected in the stable clones. To identify the potential protein targets of the microRNAs of interest, 2D DIGE and RT-PCR array were performed.
Potential protein targets for miR-125b
To explore the potential protein targets of miR-125b, the human apoptosis RT-PCR array is used due to miR-125b inhibits cell growth and proliferation. There were two genes appeared to be down regulated more than 2 folds in miR-125b clones 5and 14 with 2 folds differences when compared with the parent cell line. Western blot analysis was followed to confirm the protein expression of BIRC1 and IGF1R. Both BIRC1 and IGF1R expression were down-regulated in miR-125b clones 5 and 14 and similar to 5-FU treated cells (Figure 8).
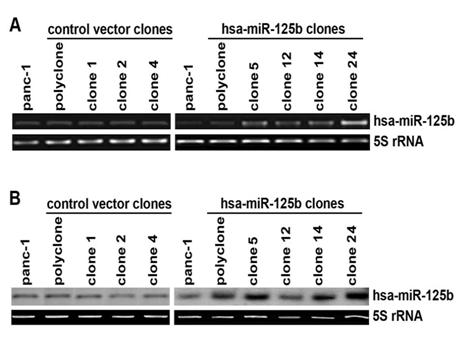
Figure 4: Positive clones screening by real-time PCR and Northern blot.
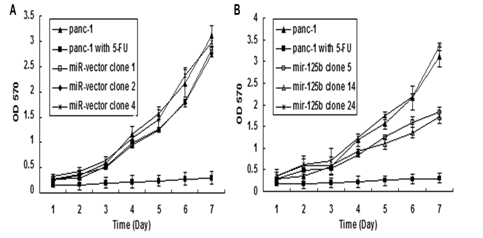
Figure 5: MTT assay of miR-125b, -27a and -222 stable transfectants.
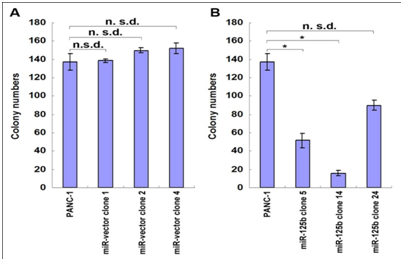
Figure 6: Clonogenecity assay of miR-125b stable transfectants.
Compared with the untreated cells, twenty-four up regulated miRNAs and seven down-regulated miRNAs were identified in 5-FU treated cells. Among them, 8 miRNAs (miR-125b, miR-181a, miR-181b, miR-181d, miR-27a, miR-222, miR-30a-5pre and miR-495) showed the most significant up regulation in 5-FU treated group, while other 6 miRNAs were down regulated compared with the untreated group, including miR-15b and miR-21. It has been suggested that miR-21 might play an important role in preventing apoptosis and has been shown to be up regulated in different cancers, pancreatic neuroendocrine tumors included[9, 10]. Moreover, it has been reported that miR-21 was overexpressed in pancreatic cancer and its strong expression predicted limited survival in patients with node-negative disease [11]. If miR-21 is truly involved the 5-FU regulation, it should be down regulated according to the effect on growth inhibition by 5-FU. We indeed found that miR-21 was down regulated in our studies after 5-FU treatment.
For the up regulated miRNAs, miR-125b is one of the most significantly miRNAs which possibly involve in 5-FU metabolism pathway based on its negative effects on proliferation in different cancers. MiR-125b negatively regulated proliferation in oral squamous cell carcinoma cells [12]. Downregulation of miR-125b expression was found in OSCC, breast cancer and prostate cancer [13,14]. But in pancreatic cancer, the differential expression of miR-125b is controversial. Volinia et al. [15] reported that the majority of miRNAs were increased in the tumor compared to normal pancreas, including miR-125b [9,15]. Bloomston et al. [9] also showed that miR-125b was found to be overexpressed in pancreatic cancer compared with normal pancreatic tissue, which was also overexpressed in chronic pancreatitis [9]. The miR-125b expression affected in both diseased tissues is more likely to reflect the desmoplastic reaction of tumor rather than changes specific to PDAC. However, the studies of Lu et al showed miR-125b was decreased in pancreatic cancer compared with normal pancreatic tissues, but little is known about its function in pancreatic cancer [16]. To define how miR-125b affects the pancreatic cell proliferation, the human pancreatic cell lines PANC-1 and Panc-10.05 cells were transfected with Pre-miRTM miRNA precursor molecules of miR-125b, and the results showed that it inhibited cell proliferation in both cell lines. But the inhibition is not the same dramatic as that of 5-FU treated cells, suggesting that there are other miRNAs induced by 5-FU involving in this process. To understand the role of miR-125b, its stable transfected clones were established in PANC-1 cell line. The stable clones (5 and 14) transfected with miR-125b plasmids both showed decreased cell growth and proliferation (about 68% and 87% inhibition for colony formation) which matched with the 5-FU treated cells and precursor molecules transfected cells. But there was no change of cell proliferation in another stable clone 24 which had the highest expression level of miR-125b, suggesting its nonspecific effect. Our results were supported by the previous studies showing over expressing miR-125b, which could inhibit cell proliferation in OSCC, bladder cancer, thyroid cancer and hepatocellular carcinoma [12,17]. In pancreatic cancer, our results are similar to the findings reported by Lu et al. [16]. miR-125b was included in a general downregulation of miRNAs associated with differentiation in tumors compared with normal tissues [16]. Recent studies showed that miR-125b could promoter neuronal differentiation in human cells [18]. In the present studies, exogenous miR-125b inhibition of tumor growth may be partly through restoring differentiation capabilities of cancer cells. Further testing whether there are dysregulated genes associated with differentiation in the above tumor will help us better understand the role of miR-125b in the process of recovery of cancer differentiation.
Inhibition of cell proliferation can be the consequence of cell cycle arrest or apoptosis, flow cytometry assay was performed. As shown in Figure 7, miR-125b stable transfected clones 5 and 14 showed G2/M phase arrest compared with the control vector, while no apoptosis was detected in the stable clones. It seems that clone 14 has a little higher cell growth inhibition (Clonogenecity assay, 87% versus 68%) accompanying higher percentage G2/M phase arrest (50.35% versus 30.14%) than clone 5. To probe the molecular mechanisms involved in the tumor growth inhibition by miR-125b, human apoptosis RT-PCR array was performed. Two potential protein targets BIRC1 and IGF1R with more than 2-fold of downregulation was identified and confirmation by Western blot. Blotting results (Figure 8) showed that the protein level of BIRC1 and IGF1R was dramatically decreased in 5-FU treated cells and miR-125b transfected clones 5 and 14 compared with the vector controls and the parental. However, no evident decrease of expression IGF1R in clone 24 which has no inhibition effect on cells (data not shown). The IGF-IR has been implicated in promoting oncogenic transformation, growth, and survival of cancer cells [19-21]. And it is one of the growth factor receptors known to affect the G2/M transition and to be overexpressed in pancreatic cancer [22]. Reduction of IGF1-R was followed by G2/M phase arrest and colony formation inhibition in the present study. Our finding was supported by the hypothesis that the autocrine interaction between the IGF1-R and its ligand regulates cell proliferation of pancreatic carcinoma cells [21]. In experimental studies, inhibition of IGF-IR substantially reduced pancreatic cancer growth and angiogenesis [23]. EM164, an Anti-Insulin-like Growth Factor I Receptor Antibody caused regression of established BxPC-3 human pancreatic tumor xenograft in SCID mice [24]. Therefore, miR-125b-induced downregulation of IGF1-R may be partly responsible for the observed inhibition of cell proliferation in PANC-1 cells. IGF signaling through the IGF-IR may be an important factor in tumor cell drug resistance [25]. Furthermore, inhibition of IGF-IR with antibodies or small-molecule kinase inhibitors has been found to enhance the cytotoxic effects of a number conventional chemotherapy agents, 5-FU included, both in vivo and in vitro [26]. Also decreased expression IGF1-R by over expressing miR-125b may sensitized pancreatic cancer cells to 5-FU which needs further studies. It is also important to determine whether miR-125b can directly repress the expression of IGF1-R.
BIRC1, also named Neuronal apoptosis inhibitory protein (NAIP), which is a member of the IAPs, is expressed in mammalian cells and inhibits the apoptosis induced by a variety of signals [27]. NAIP has been linked to the inherited disease, spinal muscular atrophy (SMA). NAIP may be involved in the mechanisms of resistance of tumor cells to various chemotherapeutic agents. It has been reported NAIP is overexpressed in breast cancer patients with unfavorable clinical features such as stage and tumor size, suggesting that NAIP would play a role in the disease manifestation [28]. In colorectal cancer BIRC1 transcript that was more abundant in tumors than in non-neoplastic tissues appeared to reflect important events for colon carcinogenesis [29]. Our results showed that BIRC1 was down-regulated in 5-FU treated cells and miR-125b stable transfected clones 5 and 14, indicating reduction of BIRC1 might contribute to the inhibition of apoptosis of pancreatic cancer cells. However, we didn’t detect the apoptosis in miR-125b stable transfected cells. Other methods used to test the early apoptosis of cells may be the better choice. Or BIRC1 may have an unidentified role in cell proliferation.
It has been found that miRNA genes are frequently located in chromosomal regions characterized by non-random aberrations in human cancer, suggesting that resident miRNA expression might be affected by these genetic abnormalities [30]. MiR-125b, which inhibited pancreatic tumor growth in the present studies, is located at chromosome 11q23-24, which is one of the region’s most frequently deleted in breast, ovarian, and lung tumors [31,32]. Loss of 11q24.1 and 22q13.31 were also associated with these more advanced tumor cases in endocrine pancreatic tumors [33]. Thus, the miR-125b might be an important candidate for this role.
In summary, our findings indicated the expression of mir-125b induced by 5-FU treatment, may inhibit tumor growth in part through down-regulation of the expression of IGF1R, suggesting a novel strategy for anticancer therapy.

©2016 Liu, et al. This is an open access article distributed under the terms of the, which permits unrestricted use, distribution, and build upon your work non-commercially.