MOJ
eISSN: 2374-6912


Research Article Volume 3 Issue 3
Analytical and Bioanalytical Development, Bristol-Myers Squibb Company, USA
Correspondence: Surendran Rajendran, Analytical and Bioanalytical Development, Bristol-Myers Squibb Company, Route 206 and Province Line Road, Princeton, NJ 08543, USA, Tel 6092524933, Fax 6092527768
Received: May 13, 2016 | Published: May 19, 2016
Citation: Nabbie FN, Zhang YJ, Piccoli S, et al. Higher order complex mediated positive interference in biomarker quantitation: a case study. MOJ Cell Sci Rep. 2016;3(3):90-94. DOI: 10.15406/mojcsr.2016.03.00060
Biomarker quantitation by Ligand Binding Assays is susceptible to interference. Such interference usually manifests as a signal decrease resulting in target underestimation. However, a recently developed biomarker assay for soluble CD137 exhibited an uncharacteristic positive interference in presence of the therapeutic antibody urelumab (anti-CD137). Urelumab was found to be capable of formation of higher order complex through simultaneous multivalent interactions with both soluble CD137 and assay reagents. Higher Order Complex formation by urelumab was qualitatively confirmed by light scattering methods. This Higher Order Complex network enhanced the signal output leading to overestimation of the soluble CD137 analyte. Thus the positive interference in the soluble CD137 biomarker assay appears to be caused by the therapeutic antibody-mediated formation of a Higher Order Complex network.
Keywords: ligand binding assays, biomarker, higher order complex, light scattering, cd137
LBA, ligand binding assays; sCD137, soluble cd137; HOC, higher order complex; SEC-MALS, size exclusion chromatography–multi angle light scattering; DLS, dynamic light scattering; PK/PD, pharmacokinetics/pharmacodynamics; HAMA, human anti-mouse antibody; ANOVA, analysis of variance; HPLC, high performance liquid chromatography
Biomarker quantitation is an integral part of modern drug discovery and development, especially where quantitation is crucial to establish the initial assessment of safety, tolerability, PK/PD (Pharmacokinetics / Pharmacodynamics) as well as exposure-efficacy relationships to predict the optimal clinical dose necessary to achieve the desired target coverage levels. Among all the available techniques, the ligand binding assay (LBA) is the predominant one used to quantitate protein biomarkers, due to the advantages of excellent sensitivity, wide response range, specificity, ease of sample preparation (no prior extraction), and high throughput / automation possibilities.
Though LBAs are analytically sensitive and easy to perform, they may have interference issues. These interferences could be analyte-dependent or analyte-independent, and may falsely increase (positive interference) or decrease (negative interference) the measured result. The common interferences by hemoglobin (hemolysis), bilirubin (icterus), triglycerides (lipemia), various anticoagulants and human anti-mouse antibody (HAMA) are generally analyte-independent. Analyte-dependent interferences are caused by interactions between components in the sample with one or more assay reagents. Matrix effects are the sum of these interference effects of all components which appear in a specimen and adversely influence the measurement of a target analyte.
Interference by the drug is one of the main types of the matrix effects noticed specifically in clinical samples for targeted biomarkers.1,2 Increasingly, drugs are large molecule biologics, more specifically monoclonal antibodies targeting specific soluble or cell membrane associated proteins. The levels of the target proteins are often measured as potential pharmacodynamics or predictive biomarkers. This compels us to understand the effect of the therapeutic protein in large excess, present in the samples of patients undergoing treatment, on this biomarker assay. This effect could be of any form and has high potential to interfere in the assay quantitation.
The biomarker sCD137 is the soluble form of the membrane bound cytokine receptor CD137 which is generated by differential splicing or proteolytic cleavage and released by activated T cells. It is detected at enhanced levels in sera of patients of chronic lymphocytic leukemia, lymphoma, rheumatoid arthritis, multiple sclerosis, systemic lupus erythematosus, Behcet’s disease, acute pancreatitis and acute coronary syndrome.3-7 It is suggested as a useful prognostic marker for adverse events in patients with acute coronary syndrome.7 Recombinant sCD137 prevents type 1 diabetes and has been shown to be useful in immunosuppressive therapies.8 Recently it has been shown to be a natural immunosuppressant that functions as a homeostatic regulator of excess immunity.8 Hence sCD137 quantitation has potential utility for diagnosis and monitoring treatment of patients of various disease areas.
During assay development for quantitation of sCD137 a positive interference was observed in the presence of urelumab. Urelumab is a fully human IgG4 anti-sCD137 monoclonal antibody developed for the treatment of cancer and solid tumors. It activates CD137 by specifically binding to it, leading to stimulation of CD137 expressing immune cells to deliver signals that promote effector functions of anti-tumor cytotoxic T lymphocytes.9 In this study the specific positive interference by the drug urelumab in the sCD137 biomarker quantitation is investigated to understand the underlying interference mechanism.
Materials
BSA and phycoerythrin-labeled anti-mouse IgG detection antibody were from Jackson Immuno Research (West Grove, PA). Reagent antibodies (neat and biotinylated) were either from R&D Systems (Minneapolis, MN) or developed in house (Table 1). Phosphate buffered saline (PBS) was obtained from Mediatech (Herndon, VA). Human serum and EDTA plasma samples were purchased from Bioreclamation (Hicksville, NY). Serum based diluents was purchased from R&D systems (RD6-40). Protein standards for SEC-MALS were from Bio-Rad (Hercules, CA). sCD137 was obtained from R&D systems (Minneapolis, MN) in the form of a recombinant human 4-1BB/TNFRSF9/ CD137 Fc chimera.
Detection Reagent |
||||||
|---|---|---|---|---|---|---|
R&D |
MAb |
MAb |
BD-MAb |
BD-MAb |
||
Capture |
R&D pAb |
27193 |
364 |
11217 |
7270 |
19 |
MAb8D11 |
26285 |
138 |
17267 |
17427 |
11 |
|
MAb5B9 |
28117 |
135 |
149 |
256 |
15 |
|
BD-MAb127 |
8902 |
85 |
2275 |
1429 |
18 |
|
BD-MAb4B4-1 |
6190 |
131 |
87 |
88 |
19 |
|
Table 1 The fluorescence signal result of the antibodies for capturing the sCD137 with each of them as the detection reagent in the Luminex platform for selection of the best reagent pair
Assay procedure development for sCD137
Each reagent antibody screened was conjugated using a standard Luminex bead (Luminex, TX) conjugation procedure using two-step carbodiimide coupling chemistry.10 Five anti-sCD137 antibodies were screened on the Luminex platform to select the best reagent pair (Table 1). All of them were of IgG isotype; four were mouse monoclonal antibodies and the remaining was a goat polyclonal antibody. Using the best reagent pair (BMS MAb 8D11 and R&D goat anti-sCD137 PAb], the sCD137 assay was developed on the Luminex platform following the manufacturer’s protocol.11
Lyophilized sCD137 recombinant protein was reconstituted with PBS. Standard curves and QC samples were prepared by spiking sCD137 in human serum. Calibration standards, QCs, blank solution and unknown plasma or serum samples were diluted two fold with assay diluent (RD6-40) and 50 µL of the dilution was added to each well of a 96 well filter plate as prescribed.11
A calibration curve ranging from 50 to 50,000 pg/mL (0.5 to 1000 pM) was constructed. Accuracy and precision for quantitation of sCD137 in human serum was evaluated from multiple assay runs. Six runs were performed by different analysts on different days with standard curves, three QCs and blank each in duplicate in each run. Results were analyzed by one-way analysis of variance (ANOVA) to obtain intra- and inter-assay precision.
Size exclusion chromatography – multi angle light scattering (SEC-MALS)
Isocratic separations were made using an Agilent 1100 series HPLC instrument with diode array absorbance detector (Agilent Technologies, CA) on a 5 µm particle size GFC–PROTEIN KW–803 8x300 mm column (Shodex-Showa Denko America, Inc., NY) of 700 kDa exclusion limit, and in buffer containing 200 mM potassium phosphate (pH 6.8), 150 mM sodium chloride, and 0.02% sodium azide at a flow rate of 1 mL/min with an injection volume of 20 µL. A Wyatt Technology MiniDawn TREOS laser light scattering instrument was attached downstream from the HPLC, followed by a Wyatt Optilab T-rex differential refractometer, both of which were calibrated according to the manufacturer’s guidelines (Wyatt Technology Corporation, CA). BSA and protein standards (Bio-Rad) were also run to verify system performance and as references for retention time. The elution profiles were analyzed with Origin (MicroCal), Astra (Wyatt), and Chem-Station (Agilent).12,13
Dynamic light scattering (DLS)
The hydrodynamic radius was measured in the Wyatt DynaPro plate reader plus (Wyatt Technology Corporation, CA) at 830 nm and 20°C in 200 mM potassium phosphate (pH 6.8), 150 mM NaCl, and 0.02% sodium azide. Signals were analyzed by the Dynamics software to obtain the translational diffusion coefficient and from that the hydrodynamic radii of the complexes in the samples were calculated.14,15
Assay development
The five anti-sCD137 antibodies were screened to select the best capture and detection pair as determined by fluorescence signal output (Table 1). Based on the signal to noise ratio the best detection Ab reagent was the R&D PAb. The rank order of the screened antibodies as capture reagent with the R&D PAb as the detection reagent was MAb5B9, R&D PAb, MAb8D11 > BD-MAb127 > BD-MAb4B4-1.
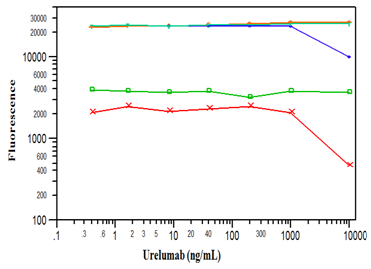
As the assay was intended to measure total CD137 (both free and drug bound) the antibodies were screened in the presence of the drug (Figure 1). All three capture reagents (R&D PAb, MAb8D11, and MAb5B9) were similar in their binding to the sCD137 and detection by the goat PAb. However, as the urelumab concentration increased beyond 1000 ng/mL, the signal for the reagent MAb5B9 decreased. In contrast, the signal from the MAb8D11 reagent was not affected even at these high urelumab concentrations. This indicated that the MAb8D11 binding epitope on the sCD137 was distinct from both the urelumab and goat PAb binding epitopes. Based on these results, MAb8D11 and the biotinylated R&D PAb were selected as the capture and detection reagents respectively. The assay range in human serum on the Luminex platform was from 50 to 50,000 pg/mL sCD137 (Figure 2) with bias and CVs of less than 20% (data not shown).

Figure 1 Fluorescence signal output from BD MAb4B4-1 (x), BD MAbM127 (  ), MAb5B9 (
 ), MAb8D11 (
 ), and R&D PAb (Y) used as capture reagent with 1 µg/mL of biotinylated R&D PAb as the detection antibody in Luminex platform as a function of increasing urelumab concentration.
Drug interference in the sCD137 assay
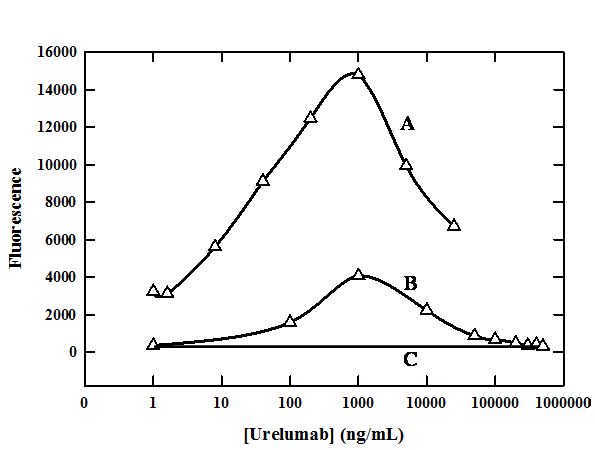
Urelumab present in the sample elevated the signal output and thus interfered significantly in the sCD137 bioanalysis (Figure 3). At a 100 ng/mL constant concentration of sCD137, the output signal increased with increasing urelumab concentration of up to 1000 ng/mL. However, above that concentration of urelumab, the signal decreased (Figure 3 Curve A). Urelumab concentrations of up to 500,000 ng/mL at a different concentration of sCD137 (20 ng/mL) were used to confirm this observation (Figure 3 Curve B). Here, signal also increased with increasing urelumab concentration up to a maximum of 1000 ng/mL, after which diminution of signal was observed, reaching baseline at 100,000 ng/mL urelumab concentration (Figure 3 Curve B). At the maximum, the signal had increased more than tenfold compared to the baseline with no change in the sCD137 concentration. Thus, the presence of urelumab in the samples resulted in aberrantly higher apparent values for sCD137. This phenomenon of following a classical bell-shaped precipitin curve was also confirmed at various other sCD137 concentrations (data not shown).
Effect of sCD137 concentration on elevated signal
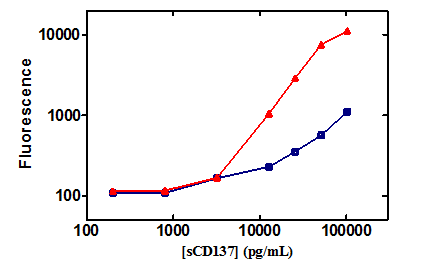
The interference that manifested in the presence of urelumab was also dependent on the sCD137 concentration. Figure 4 shows the increase in fluorescence signal in the presence and absence of urelumab as a function of sCD137. In the absence of urelumab, there was a gradual increase in signal as the analyte sCD137 concentration increased (blue curve). But in the presence of 200 µg/mL of urelumab, there was a steep increase in the signal with increase in sCD137 (red curve). The signal response both in presence and absence of urelumab was similar up to the 3200 pg/mL sCD137 concentration. Above that sCD137 concentration the presence of urelumab contributed to a significant increase in the signal. In the presence of urelumab, sCD137 at 10,000 pg/mL generated a signal equivalent to ten times higher sCD137 (100,000 pg/mL) concentration than in the absence of urelumab (Figure 4).
HOC size characterization
Though the hypothesis of formation of HOC adequately explained the elevated signals in the immunoassay, direct confirmation of the putative complexes was desired. Light scattering methods such as SEC-MALS and DLS are appropriate for this evaluation. Table 2 shows that at the constant concentrations of 150 µg/mL of sCD137 and 1.5 mg/mL of capture antibody, the amount of complex increased with increasing concentration of urelumab, reaching a maximum and then decreasing above 1000 ng/mL urelumab concentration. This initial increase followed by a decrease of HOC percentage as a function of urelumab concentration is qualitatively similar to the one observed in the immunoassay (Figure 3) and should produce the complex at the maximum signal.

Figure 3 The fluorescence signal output profiles in the Luminex platform as a function of urelumab concentration at
(A) 100 ng/mL
(B) 20 ng/mL and
(C) zero ng/mL
sCD137 concentrations with constant excess capture and biotinylated detection antibody reagents.

Figure 4 The fluorescence intensity signal curves as a function of sCD137 concentration in buffer (  ), and with 200 µg/mL urelumab (
  )in the Luminex assay platform.
The hydrodynamic radius is a direct measure of the size of protein complexes and was measured by DLS from the translational diffusion coefficient, which in turn is determined from the intensity fluctuations of the scattered light. The measured hydrodynamic radius of the complex increased with increase in urelumab concentration, consistent with the other observations and hypothesis. Above 1000 ng/mL urelumab the larger complex completely disappeared (Table 2). The hydrodynamic radius of a 150 kDa antibody is 5.1 nm. At 5000 ng/mL urelumab concentration, the DLS showed only a standard antibody peak (5 nm) with no detectable level of HOC. This absence of observed HOC corresponds well with drop of HOC percentage at that concentration by SEC-MALS (Table 2). The dependence of HOC development on the presence of urelumab strongly suggests that it is causative in their formation, providing the critical link between other components.

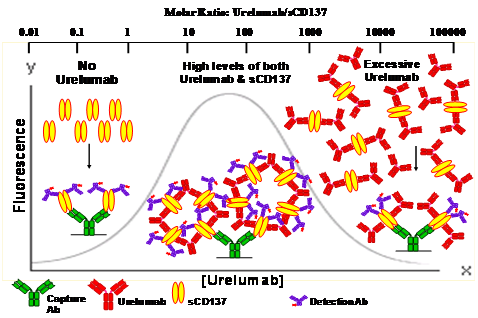
Figure 5 Schematic illustrating the population dynamics of formation of network of HOC as a function of urelumab concentration on the micro bead surface in the Luminex platform. The gray continuous line depicts the rise and fall of the fluorescence signal as the urelumab concentration increased yielding the bell shaped curve typical of an antibody-antigen reaction.
[urelumab] |
Higher Order Complex |
|
|---|---|---|
Percent (%)A |
Radius (nm)B |
|
40 |
3.4 |
118.6 |
200 |
7.2 |
162.4 |
1000 |
9.2 |
179.8 |
5000 |
0.8 |
Not detectable |
Table 2 The Apercentage and Bhydrodynamic radius of HOC measured using SEC-MALS and DLS respectively as a function of urelumab concentration at the constant excess concentrations of 150 µg/mL of sCD137 and 1.5 mg/mL of capture reagent antibody
The pattern of urelumab-dependent HOC formation as measured by light scattering methods qualitatively confirmed the corresponding signal phenomenon observed in the immunoassay (Figure 3, 4). The observed difference in the complex dissociation between the two methodologies (sharp decrease observed by SEC-MALS and DLS in contrast to the gradual decrease observed in the immunoassay (Figure 3)), is possibly due to the differences in concentrations and sensitivity of the techniques used, as light scattering methods require higher amounts of HOC for a reliable measurement. To alleviate this HOC mediated interference a simple process of incubation of the reaction mixture with 300 mM acetic acid followed by neutralization with 1.15 M Tris-HCl just before adding detection reagent was developed and this process completely removed the interference (data not shown).
Proposed hypothesis: urelumab mediated HOC formation is caused by multiple multivalent interactions leading to positive interference in the sCD137 assay
This proposed hypothesis explains the increased fluorescence signal observed in the presence of urelumab in the immunoassay. It is based on the following points:
The sCD137 exists predominantly as homodimer linked by disulfide bonds.8 Our SEC-MALS study confirmed that the sCD137 is predominantly in its homodimer form (data not shown). As per our hypothesis, in the absence of urelumab there should be no detectable complex as all of the sCD137 exists in free (unbound) form, as shown at the left side of the schematic (Figure 5). Urelumab in vivo could simultaneously bind two sCD137 molecules. Similarly, sCD137, a homodimer, has two urelumab binding sites, one site per monomer, and could bind to the capture reagent both directly and via urelumab and thus form HOC through a network of multiple multivalent interactions.
This complex formation would increase until urelumab is in sufficient stoichiometric excess to sCD137 that it is rendered functionally monovalent (antibody excess) and could no longer serve as a bridge between the excess sCD137 and the capture antibody. On either side of the maximum signal peak, only direct binding of sCD137 to the capture is thus possible. In contrast, under the peak, the sCD137 could be captured either directly or by the urelumab-sCD137 dimer complex. Since the capture, detection, and urelumab antibodies all have non-overlapping binding sites, the urelumab binding to sCD137 is not competitive to the detector antibody. Thus, in our experiments this network of HOC could cause an increased nonlinear binding of biotinylated detection reagent, leading to a higher fluorescence signal as observed in figures 3 and 4. This proposed hypothesis of formation of the network of HOC leading to positive interference in sCD137 assay is well supported qualitatively by the results of two independent light scattering methods - DLS and SEC/MALS - by demonstrating increased size and mass of the complex in the presence of urelumab.
The HOC formation process is a complicated, three component, reversible equilibrium phenomenon governed by the concentration of the bridging reagent urelumab (Figure 5). In the first of three phases, in the ascending edge there is insufficient urelumab concentration to form a multicomponent complex. As the urelumab concentration increases into the second phase, the peak region, where the HOC is formed by the concatenation of bivalent urelumab with multiple bivalent sCD137 molecules. Though HOC of different sizes or structures could be formed, most likely circular structures would predominate, as the linear polymers are less stable energetically.16 In the peak region, the delicate thermodynamic stability of the huge-sized HOC in solution would be maintained by the complex multiple multivalent binding interactions between urelumab and sCD137. In the third phase, the descending side of the peak, as the urelumab concentration increases, the HOC disappears which could be due to the stoichiometric excess shifting the equilibrium, leading to the dissociation of HOC polymers by saturation of binding sites on the sCD137. As a result, each sCD137 is bound only by two half-complexed urelumab antibodies, analogous to classic precipitin over saturation or a hook effect.
Here a unique situation of monoclonal antibody drug contributing positive signal interference in a bioanalytical assay quantitating a target biomarker was investigated and underlying mechanism characterized. The degree of interference depends on the concentration levels of both the drug and the target biomarker in the samples, and requires non-overlapping epitopes on the target biomarker for both the drug and the analytical reagents. Unlike general drug interferences characterized by a decrease in assay output signal leading to underestimation of the analyte, in this case, due to the HOC formation, the drug urelumab elevated the signal leading to overestimation of sCD137 biomarker concentration. Hence it is crucial that when an assay for a biomarker which also is the drug target, and the possibility of multiple polyvalent interactions exists, one needs to test response at multiple therapeutic protein concentrations up through Cmax with greater than stoichiometric amounts of soluble target to assess the therapeutic protein mediated interference resulting in false positive signal. Therapeutic protein drug mediated network of HOC formation would be a challenge from the drug development and bioanalysis points of view. It is important to experimentally assess and mitigate any potential therapeutic protein drug mediated matrix effect for the biomarker assays.
None.
The author declares no conflict of interest.

©2016 Nabbie, et al. This is an open access article distributed under the terms of the, which permits unrestricted use, distribution, and build upon your work non-commercially.