MOJ
eISSN: 2374-6912


Research Article Volume 3 Issue 5
1Truman Graduate School of Public Administration Affairs, Mongolia International University Mongolia
2Law College Dehradun, Uttaranchal University, India
Correspondence: Rajan Sharma, Director, Truman Graduate School of Public Administration Affairs, Mongolia International University Mongolia, Mongolia
Received: May 16, 2016 | Published: December 30, 2016
Citation: Mohanty A, Sharma R, Islam SS. Impact of climate induced natural disasters in costal Odisha focused on socio-economic vulnerability. MOJ Cell Sci Rep. 2016;3(5):146-151. DOI: 10.15406/mojcsr.2016.03.00073
Orissa has been prone to both anthropogenic and non anthropogenic hazards and calamities since long . Between the period 1965 to 2004, floods have occurred 17times, droughts 19times, and cyclones have hit the state 7times (OSDMA, 2011). These natural disasters have not only led to loss of human lives but also resulted in extensive damages Climate induced natural disasters (CINDs) like droughts, floods, cyclones and heat waves have become serious problem to Orissa. Fluctuating weather conditions in the state suggest that it is reeling under a climatic chaos. It has been experiencing contrasting weather like heat waves to cyclone and from drought to flood for more than decade. The dramatic change in state’s ecology and weather conditions may be due to induction by climate change. Intergovernmental Panel on Climate Change (IPCC) links vulnerability with climatic change and point out that the vulnerability of a region depends largely on its wealth, and poverty, which limits adaptive capabilities (IPCC, 2000). The socio-economic systems for state like Orissa are more vulnerable to CIND because of high reliance on natural resource, limited ability to adapt financially and intuitionally, low per capita GDP, high poverty and lack of safety nets. Vulnerability is social condition of measuring coping ability and differs in degree for regions, economic sectors and social groups. The paper tries is to work out strategies to improve the ability of the poor people to be more resilient to current natural hazards as well as to the risks associated with long-term climate induced natural disasters by developing composite index of social vulnerability (CISV) for the districts of Orissa. Working out a social vulnerability index for a complex state like Orissa raises several problems in selecting suitable indicators, aggregation of these indicators and also decision in assigning weights. The purpose of the paper to select suitable indicators as criterion data, criterion standardization derived by dividing by mean, weightage by multivariate (PCA) analysis and combining by means of simple aggregation. This piece of work will raise a debate in academic world by proposing a methodology to overcome the persistent dichotomy in different school of vulnerability research. Objective of this assessment is to highlight the priority areas for policy implication in building adaptive capacity for the extremely vulnerable districts.
Keywords: climate induced natural disasters, composite index of social vulnerability, principal component analysis, human development index
CIND, climate induced natural disasters; PCA, principal component analysis; HDI, human development index; CISV, composite index of social vulnerability
The state of Orissa which is known as the disaster capital of India situated on the eastern coast, periodically experiences loss of life and severe damage from tropical cyclones, floods and droughts.1 In the last 100 years, the state has been disaster affected for 90 years; floods have occurred for 49 years, droughts for 30 and cyclones have hit the state for 11 years. Since 1965, calamities are not only becoming more frequent but striking areas that never had experienced such phenomena. In the last 10 years, calamities have claimed more that 30,000 lives mostly on the coastal belt (Info change, 2001). A deadly cocktail of floods, cyclones and droughts have made Orissa the disaster capital of India. Agricultural land has turned into fallow land, and this in return has led to widespread malnutrition and even starvation in some parts of the state. Further, this is one of the poorest states in India where more than two third of the population are below poverty line. Poverty has made the vulnerable segment of the population yet more vulnerable to the consequences of CINDs, especially for those living in high risk coastal areas and hilly western and southern parts of Orissa. CINDs have become a burden for the poor people of Orissa which leads to serious fiscal imbalances by heavy demands on revenue expenditure, expenditure on restoring assets. There is a significant reduction of revenue in terms of taxes and duties, due to the crop loss and property loss.
CINDs turning into severe disasters are mediated by the social vulnerability entwined into a complex interrelationship of social, economic, political, technological and institutional factors that render an exposure unit vulnerable or resilient in the face of extreme events. Understanding as to how different societies will respond to and adapt to these changes is thus a key element of research and policy relating to global environmental change.2 All individual or social groups exposed to hazard are not equally vulnerable rather affected human being show a pattern of differential loss. Vulnerability are social conditions of measuring the coping ability and also as combination of social resistance (the ability to absorb the damaging impacts of the hazard and continue functions) and resilience (the ability to recover from the loss quickly.3,4 The purpose of the paper is to build a theoretical framework and developing a methodology in establishing Composite Index of Social Vulnerability to CIND. The framework of methodology relies upon the structural functionalist paradigm targeting social systems and regional systems as units of analysis. In the context of this paper, the units of analysis are districts of Orissa. The challenges for development are considerable, not least because the impacts are complex and highly uncertain.
The climate change impact and vulnerability give insight that several demographic attribute, social aspects and economic well being factors are important indicators of climate induced vulnerability. Demographic attributes cited most often throughout the literature include age,4-8 gender,9-14 race, ethnicity and caste.14-17 These demographic variables play important role in quick assessment of households to recover.11,18,19 The social vulnerability is driven by structure of family, social cohesiveness among the community, social capital and social networking.9,19 Heinz Center for Science, Economics, and the Environment, 2000, and Puente, 1999). There is several additional vulnerability factors associated with personal limitations and special needs population. Those vulnerability indicators include restrictions in mobility, the ability to care for one self, and the ability to work, and the persons usually affected by these variables are those with disabilities, transients, homeless or the institutionalized.19 Lastly, there are a number of economic factors that can also increase vulnerability, such as poverty,20 level of education,4 occupation and employment type,4-6 natural resource dependant population.1
Eight indicators like dependant population (DP), percent of rural population (PRP), social dependant population (SDP), special need population (SNP), percent of illiterate population (PILP), percent of population dependent on natural resources (PPSDEN), percent of marginal workers (PMW) and human health (HH) have been considered for constructing composite index of social vulnerability.
Dependent population
The two demographic groups are tend to be more susceptible to climate induced natural disasters are children and the elders. In general population with a low dependency ratio (high proportion of working age adults) and in good health are likely to have the widest coping ranges and thus be least vulnerable in the face of climate change exposure. The underdevelopment status of Orissa, which by definition has high birth rates and declining death rates. The result is expanding population and high dependency ratio formed largely out of under 15 age groups rather than over 65 age groups.
Natural resource dependant population
The extreme events induced by CIND may create significant disturbances and immediate threats to natural resources of state in 21st century. Orissa has more climatic sensitive economy than any other state in the country because more than two-third of population depend upon natural resource for their livelihoods. The immediate impact of CIND inform of change in water availability may increase baseline vulnerability because of high percentage of population of state belong to natural resource dependant livelihood category such as primary industries (agriculture, fishing and forestry) and the productivity of which is a function of water availability. This is a potent indicator to measure social vulnerability to ongoing environmental changes in the state.
Poverty
This is most apparent indicator to show vulnerability in the space. It shows the economic condition of the people in term of size of operational landholding, type of house the posses, availability of cloths, food security, sanitation, ownership of consumer durables, literacy status, status of household labour force, means of livelihood, status of children (going to school), type of indebtedness, reason for migration from household and preference for assistance. CIND will compound existing acute and persistent poverty (47.15% of population BPL, Planning Commission, Government of India) of the state by further reducing there accesses to drinking water, negatively affects their health and poses a threat to food security where livelihood choices are limited. Hence it is important indicator to measure the ability to cope with CIND.
Marginal workers
The marginal workers are defined as the percentage of landless laborers in the agricultural workforce, provides an indication of inequality in landholdings. Landless laborers are generally poor and have little security of income; in times of agricultural distress, laborers are the first to lose their income due to CIND. The states of Orissa has largest share of landless laborers in the agricultural workforce in the country and are thus more vulnerable to shocks generated by CIND because of social and economic disruption as a result of droughts, floods, cyclone or other climatic stresses.
Illiteracy
Education is the principal attribute for assessing quality of population and plays an important role in linking social and economic development. Increased literacy levels reduce vulnerability by increasing people’s capabilities and access to information, thus their ability to cope with adversities. More the percentage of illiterate people the more vulnerable to CIND because lack of awareness about the global changes affecting the climate of the state.
Socially dependant population (SC+ST)
About 23 per cent of the population comprises the indigenous tribal population, mostly concentrated in the north-western and south-western districts of the state with traditional means of livelihood. They solely depend on the on forests for livelihood. The population belonging to Scheduled Caste constitutes little more than 16 per cent of the state’s population. The processes of modernization and CINDs have largely marginalized them in economic terms, threatening their livelihood security. Hence it is a suitable indicator for understanding the dynamics of social vulnerability.
Rural population
Rural households of Orissa tend to rely heavily on climate-sensitive resources such as local water supplies and agricultural land; climate-sensitive activities such as arable farming and livestock husbandry; and natural resources such as fuel wood and wild herbs. CIND will reduce the availability of local resources, limiting the option of rural household and compelling them to migrate to urban area as alternative strategies. This can be an indicator for assessing the lack of resilience and also have narrow coping ranges for villagers to cope CIND in Orissa.
Human health
Health is an important determinant of well-being in the broadest sense of the term. Improved health is desirable not only in itself, but also because it leads to enhanced capability to work and improve adaptive capacity in climate change scenario. Improved health and nutritional status contribute to increased life expectancy. The state of Orissa is one of the malaria prone belts of India. A little more than one one-fifth death in Orissa is caused by Infectious and parasitic diseases. Hence no of people affected by different diseases are taken as indicator to measure status of heath in the state to cope with CINDs.
A wide variety of multivariate statistical techniques are available to derive a composite index from set of indicators. The choice of most appropriate method depends upon the type of problem, the nature of data and objective of the analysis. In vulnerability science, indicators are in general correlated and researchers are not in a position to study the dynamic of social vulnerability with set of independent variables. It has been critised by researchers in constructing composite index using method like ranking and indexing because of arbitrariness and allocation of equal weights.21-23 Hence one has to look into alternative dimension reduction technique which would enable to summarize the whole set of information into a manageable form without much loss of information content of the original data. The theme of multivariate analysis is simplification and to summarize a large set of data by means relatively few indicators.24
Kendell25 had earlier developed a composite index formula by using inter-dependent indicators to agricultural productivity which is called as ‘first principal component’ by Hotelling.26 In principal component analysis (PCA), a set of original variable is transformed to set of uncorrelated variables called principal components. The new variables are linear function of original variables and derived in decreasing order of importance. The objective is to find the principal components which account the most variation in the original data set. According to Chatfield & Collin,24 there is generally a little point in carrying PCA unless the variables have similar variance. The conventional way of getting the unit variance is to standardize the variable i.e. making the variable scale free. In the present study the indicators are made scale free by dividing each by their respective mean. This method unlike the other approaches of scale transformation (ranking, standardization, normalization and division by standard deviation) does not lead to shift in origin of the indicators in a given space.27-29 The Eigen vector corresponding to largest Eigen value of the projection matrix gives the required weight for the indicators. The weights of the indicators are given in Table 1.


Figure 1 Source: Human Development Report-2004.
Indicators |
PCA - 1 |
PCA - 2 |
DP(CH+OLD) |
0.708 |
0.543 |
PRP |
0.558 |
0.768 |
SDP(SC+ST) |
0.772 |
-0.488 |
SNP(BPL) |
0.805 |
-0.037 |
PILP |
0.889 |
-0.157 |
PPSDEN |
0.844 |
0.472 |
PMW |
0.858 |
-0.079 |
HH |
0.65 |
-0.585 |
% of Variation |
64% |
25% |
Table 1 Weight assigned to indicators by Principal Component Analysis
The weights are multiplied to the standardize indicators and then placed in an additive model to produce the composite index of social vulnerability score for each districts and ranked according to hierarchy of their variables as shown in Table 2. More than half (60 %) of districts of Orissa exhibit moderate to least vulnerable levels of social vulnerability and 40% having high to extreme vulnerability. The CISV ranges from 0.443 (low social vulnerability) to 1.107 (high social vulnerability) with mean vulnerability score of 0.760 (SD-0.184) for all districts in Orissa. The coping ability of 16 districts are less than state average (0.741) to resist or handle any kind of climate induced natural hazard in Orissa.30-33
Districts |
CISV |
Rank |
District |
HDI |
Rank |
Khurda |
0.443 |
30 |
Khurdha |
0.736 |
1 |
Puri |
0.52 |
29 |
Jharsuguda |
0.722 |
2 |
Jagatsinghpur |
0.525 |
28 |
Cuttack |
0.695 |
3 |
Kendrapa |
0.557 |
27 |
Sundargarh |
0.683 |
4 |
Bhadrak |
0.564 |
26 |
Debagarh |
0.669 |
5 |
Cuttack |
0.581 |
25 |
Anugul |
0.663 |
6 |
Jajpur |
0.586 |
24 |
Puri |
0.657 |
7 |
Nayagarh |
0.6 |
23 |
Bhadrak |
0.646 |
8 |
Balasore |
0.614 |
22 |
Mayurbhanj |
0.639 |
9 |
Ganjam |
0.645 |
21 |
Kendrapara |
0.626 |
10 |
Angul |
0.652 |
20 |
Kalahandi |
0.606 |
11 |
Jharsiguda |
0.656 |
19 |
Dhenkanal |
0.591 |
12 |
Baragarh |
0.678 |
18 |
Sambalpur |
0.589 |
13 |
Dhenkanal |
0.684 |
17 |
Nuapada |
0.581 |
14 |
Orissa |
0.741 |
Orissa |
0.579 |
||
Sonepur |
0.743 |
16 |
Nayagarh |
0.571 |
15 |
Boudh |
0.77 |
15 |
Sonapur |
0.566 |
16 |
Bolagiri |
0.772 |
14 |
Bargarh |
0.565 |
17 |
Sambalpur |
0.778 |
13 |
Baleshwar |
0.559 |
18 |
Keonjhar |
0.82 |
12 |
Jagatsinghpur |
0.557 |
19 |
Kalahandi |
0.852 |
11 |
Ganjam |
0.551 |
20 |
Mayurbhanj |
0.859 |
10 |
Balangir |
0.546 |
21 |
Deogarh |
0.891 |
9 |
Jajapur |
0.54 |
22 |
Sundergarh |
0.899 |
8 |
Baudh |
0.536 |
23 |
Gajapati |
0.914 |
7 |
Kendujhar |
0.53 |
24 |
Koraput |
0.943 |
6 |
Rayagada |
0.443 |
25 |
Nabragapur |
0.993 |
5 |
Nabarangapur |
0.436 |
26 |
Rayagada |
1.009 |
4 |
Koraput |
0.431 |
27 |
Khandhamal |
1.079 |
3 |
Gajapati |
0.431 |
28 |
Nuapara |
1.099 |
2 |
Kandhamal |
0.389 |
29 |
Malkanigiri |
1.107 |
1 |
Malkangiri |
0.37 |
30 |
Table 2 Composite Index of Social Vulnerability and Human Development Index for districts of Orissa
Districts having least coping ability to CIND
Analysis reveals that the district having least coping ability is Malakangiri (1.107) followed by Nuapara (1.099), Kandhamal (1.079), Rayagada (1.009) and Nabrangpur (0.993) to the occurrence of any kind of climate induced natural disasters in Orissa. These districts have less potential to cope with any kind of extreme events. These districts are most vulnerable to climatic variabilitydue to high percentage of dependent population, high reliance on natural resources, limited ability to adapt financially and institutionally, low per capita GDP and high poverty, and a lack of safety nets. The district of Malkangiri covered with steep Ghats, plateaus and valleys sparsely inhabited by primitive tribes like Bondas, Koyas, Porjas and Didiyas has least potential to cope with CIND in Orissa. The coping ability in this district is least due to presence of high percentage of SC&ST (78.32%) population, level of illiteracy is high (68.74%), prevalence of high level of poverty and also majority (91.3%) of the population depend upon primary activities for their livelihood. It is also one of the malaria prone belts of Orissa. Malkangiri is one of the most backward districts of Orissa and deserves a special attention and proper planning to enhance the capability to cope with upcoming climatic shocks. The tribal hilly district of Nuapada has 2nd least potential cope with natural disasters in Orissa. The coping ability is low because of 85% of families live below the Government of India poverty line of Rs.15,000 (US$300) per annum, high percentage of dependant population (24.69 %), majority of the population depend upon natural resource for their livelihood and 46.12 % belong to marginal workers having no agricultural land. This is one of the poorest district of Orissa where 50% of families are 'very poor' with an income of only Rs.6000 (US$120) per annum (Ministry of Rural Development BPL survey, 2002).
District |
CISV-Score |
Rank |
Nabrangapur |
0.993 |
5 |
Rayagada |
1.009 |
4 |
Khandhamal |
1.079 |
3 |
Nuapara |
1.099 |
2 |
Malkanigiri |
1.107 |
1 |
Kandhamal district, in the heart of Orissa, is God’s own country - an area of great natural beauty, dotted with springs, waterfalls, lush forests and green hills back in headline as symbol of religious strife ranked 3rd in coping ability to counter CIND. Almost 66% of the land area of the district is covered with dense forest and towering mountains which provide shelter to more than half (52%) of population of aboriginal people like khandas classified under the ancient Gondid race of proto Austroloid group have high dependency ratio (24.13%), whereas more than two-third population depend upon solely on forest product and is also one of the malaria prone belt of Orissa. Almost 78.48 % of populations live below poverty lines which further reduce the ability to cope with any kind of natural hazards. The social and religious divide artificially created will further reduce their ability to cope because thousands have been rendered homeless and without hope or sustenance. The district of Rayagada has been the homeland of various tribal communities with their sub-tribes rank 4th position having less coping ability to counter CIND in Orissa. Majority of population (70.32 %) belong to marginalized section of society having very low literacy level (35.61%), health status is very poor and also depend upon pre-agricultural economy based on foraging, hunting & gathering but they now primarily depend on a subsistence agriculture i.e. shifting cultivation or slash and burn cultivation or Podu are the factors playing role in creating inability of the district to cope with climatic stresses in Orissa. District of Nabrangpur has mostly tribal, nomadic and aboriginal ranked 5th position having least potential to cope natural hazard in Orissa. This district has high dependant population, high degree of poverty, high level of illiteracy and also depend upon agriculture and forest product for their livelihood are the criteria for least ability to counter natural hazards in Orissa.
Districts having high coping ability to CIND
The top five districts having more potential to cope with CIND in Orissa are Khurda, Puri, Jagatsingpur, Kendrapada and Bhadrak. These districts of Orissa have high capability to cope any kind climate induced extreme events because of less reliance on natural resources, less percentage of population belong to marginalized section of the society, less prevalence of poverty and have wide range of capacity to adapt financially and institutionally. The district of Khurda topped the list because of less degree of poverty (59.17 %), high percentage of urbanization (42.93 %), having access to alternative source of income, low dependency ratio (19.86), well communicated and informed and less percentage population from marginalized section. The coastal district of Puri is famous for its historic antiquities, religious sanctuaries, architectural grandeur, sea-scape beauty and moderate climate secured 2nd position in the row having potential to cope CIND. The district of Puri has less prevalence of poverty, less percentage of ST population, high level of literacy rate, larger percentage of population is working class are engaged mainly in the secondary sector and the income generated from tourism sector plays indirect role making the district economically sound than other districts to cope with natural disaster in state. The district of Jagatsingpur rank 3rd in coping ability is because of low percentage of SC & ST (22.23%), low level of poverty, high literacy rate and health condition in this district also very good. The district of Kendrapa and Bhadarak rank 4th and 5th position, respectively in hierarchy in coping ability to CIND in Orissa. The coping ability of both the districts are quite high in ranking are because of high level of urbanization, low percentage of ST population, low amount of poverty, diversified economic activity and access to good education and information technology. These coastal districts have high potential to absorb the climatic shocks and stresses in the whole state.
District |
CISV-Score |
Rank |
KHURDA |
0.443 |
30 |
PURI |
0.52 |
29 |
JAGATSINPUR |
0.525 |
28 |
KENDRAPA |
0.557 |
27 |
BHADRAK |
0.564 |
26 |
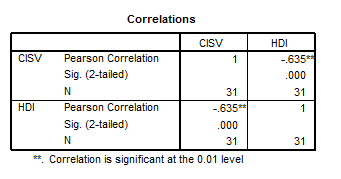
Comparison between CISV and HDI
The relation between CISV and HDI are inverse i.e. the district having high human development index should have low social vulnerability i.e. coping ability should be high and vice versa. There is a moderate, negative association (-.635) between CISV and HDI as shown in the Table3.
The HDI only measures the well being taking only few socio-economic indicators but not a different kind of non conventional social indicators. The reason for using CISV instead of the HDI for measuring coping ability for climate induced natural disaster as follows; First, one of the stated goals of the HDI is to achieve a stable indicator; therefore, the HDI may mask much of the variability in Social Vulnerability that can be identified by the CISV. Second, the CISV has a much stronger theoretical base in measuring both potential of society to cope with disaster and also developmental aspects than the HDI. The CISV tries to give different weight using multivariate technique (PCA) to indicators for the construction of better index. This is not to suggest that the CISV does not need much refinement, but only that it is a better and more interesting indicator than the HDI, particularly while developing composite index at micro-level study (district, block and villages).
The academia do not have consensus within their community about social vulnerability or its correlates. These correlates are largely derivative from local case studies of climate induced natural disasters and community responses. There have been few attempts to develop larger theoretical or conceptual understandings the dynamics indicators of social vulnerability, instead the clear need to develop such a robust and replicable set. The work on the Composite Index of Social Vulnerability demonstrates that there is a considerable potential for such an index when used in the context of measuring sustainability, development, climate change impacts, disaster managements and any other kind of spatially change. The CISV can assist local decision makers in pinpointing those factors that threaten the sustainability and stability of the districts (or community). Using this index in conjunction with biophysical risk index, help in mitigating efforts or empower the manager of disaster management who can target the most vulnerable groups or districts. Whilst the index, therefore, has important academic and policy applications, its development has also raised a number of potential directions for further research. It has to be used with appropriate regard to the limitations and it marks the first robust and systematic assessment of relative levels of social vulnerability in Orissa. This is the first index constructed on micro scale and complimentary index to Human Development Index constructed by UNDP. There is a need to try and validate the index by applying the model (with appropriate data) to past historical hazards to explain why they did or did not translate into impacts (disasters). The researchers should try in developing robust indicators and indexes which can really capture the ground reality. As international agreements such as the UN Framework Convention on Climate Change incorporate the goals of sustainable development and human threats as key provisions, there will be a need for additional research on indicators for measurement and prediction. The CISV presents a major effort towards meeting this need.
None.
The author declares no conflict of interest.

©2016 Mohanty, et al. This is an open access article distributed under the terms of the, which permits unrestricted use, distribution, and build upon your work non-commercially.