Journal of
eISSN: 2373-4426


Review Article Volume 10 Issue 2
Department of nursing, Woldia University, Ethiopia
Correspondence: Mesfin Wudu Kassaw, Department of nursing, College of health science, Woldia University, Ethiopia
Received: September 29, 2019 | Published: April 30, 2020
Citation: Kassaw MW, Abebe AM, Abate BB, et al. Proportion of structural congenital anomaly in eastern Africa; A systematic review and meta-analysis. J Pediatr Neonatal Care. 2020;10(2):43-50. DOI: 10.15406/jpnc.2020.10.00412
Introduction: Birth of abnormal child is a stressful situation for mothers and for the society. Globally, about 8 million children were born each year with congenital abnormalities. Out of this, 3.3 million children died before the age of five years while 3.2 million survivors suffer from severe mental or physical disability. As it was a major global concern, the trends of congenital anomaly were also altered using advancing technology during antenatal care in diagnosing and treating the defects.
Methods: The review has one objective, and the search strategy were performed based on the review question or objective. The search of articles was performed by 5 investigators. Electronic databases mainly PubMed and google scholar were used for published studies. Gray literatures like research and trials registers, thesis and dissertations catalog, and organizational reports were also scrutinized independently using the search logic grid by all authors.
Ethics and dissemination: This review used published data, and the ethical approval was not applicable. This systematic review and meta-analysis were aimed to indicate the burden of structural congenital anomaly in eastern Africa for policy makers. The result also indicated for the region, and will be released online to make it available for all countries.
Results: The pooled proportion of structural congenital anomaly in eastern Africa was 4.54 per 1000 with 95% CI of (4.23-4.85). Of the researches included in this review the maximum proportion of structural congenital anomaly was 6.08 per 1000 children and the minimum structural congenital anomaly was 3.97 per 1000 children.
Conclusions: According to the findings of this meta-analysis, the pooled proportion of structural congenital anomalies is high in relative to WHO’s worldwide structural congenital anomaly report. Congenital anomaly imposed huge financial, social and psychological costs on individuals, and heath care systems annually. Therefore, promotion of maternal health with an emphasis on ANC follow-up would be essential to decrease the prevalence of birth anomaly.
Protocol registration: The protocol for this review has been published in the PROSPERO, International Prospective Register of systematic reviews at (http://www.crd.york.ac.uk/PROSPERO with a protocol identification number of CRD42019123190.
Keywords: structural congenital anomaly, eastern africa, proportion, meta-analysis
Congenital anomaly is a structural or functional anomaly that may occur during intrauterine life. The anomaly can be identified prenatally, at birth or later in life. An approximate of 94% of severe congenital anomaly occurred in low and middle-income countries.1 A birth of abnormal child is a stressful situation for mother as well as for the society. More than 8 million children are born each year with congenital abnormalities globally, out of these 3.3 million dice before the age of five years while 3.2 million survivors suffer from severe mental or physical disability. Although it is a major global concern, the advancing technology and early antenatal diagnosis of birth defects has altered the trends congenital abnormalities.2
Even if congenital anomaly cannot be linked to a specific causes, some of the known causes or risk factors are single gene defects, chromosomal disorders, environmental chemicals, maternal infections such as rubella, maternal illnesses like diabetes mellitus (DM), iodine and folic acid deficiency and exposure to medicinal and recreational drugs including alcohol, tobacco and radiation were revealed.1 The interaction of genetic component with environmental factors in utero could lead to congenital disorders, while some birth defects are mainly secondary to environmental factors. Early identification and treatment of infections before and during pregnancy can avoid the congenital disorders resulting from such infections as syphilis and rubella.3 In addition, taking family history of genetic diseases and counseling of parents could minimize the risks of birth disorders.4 In Kenya, congenital anomaly contributed for 1/3 of all neonatal deaths following infections, birth asphyxia, and preterm births.5 In Somalia, congenital anomalies attributed for 6.4% neonatal deaths,6 and in Djibouti, congenital anomaly accounted for the 14th top 25 years of life lost.7 The proportion of perinatal deaths due to congenital anomaly was increasing as a result of reduction in mortality from other causes secondary to a gradual improvement in the management of prematurity, asphyxia and sepsis through tertiary care newborn units across the countries. Thus, birth defects in the coming decades are likely to emerge as a major cause of morbidity and mortality.8 This review is designed with an aim to determine the prevalence of only structural congenital anomaly among the 11 eastern African countries including Madagascar.
The purpose of this review was to determine the prevalence of structural congenital anomalyusing studies done from 2009 to 2019 in 11 eastern African countries.
For this systematic review and meta-analysis, the question was developed using CoCoPop (Condition, Context and population) mnemonics. Therefore, the review question is; “What is the prevalence or proportion of structural congenital anomaly in eastern Africa?”.
Search strategy: The search strategy was implemented in two stages. The first phase was searching from databases and the second was searching the reference of retrieved papers. The database, PubMed and google scholar, search was performed by four investigators (Mesfin Wudu, Ayelign Mengesha, Biruk Beletew and Ayele Mamo). One investigator (Alemu Birara) was search gray literatures like research and trials registers, thesis and dissertations catalogs, and organizational reports using the logic grid, CoCoPop mnemonics for the review question (Table 1). The searching term consider all of the 11 east African countries among infant or children. Thus, the key searching terms were composed of condition, context and population mnemonics as following; “congenital anomaly or birth defects or congenital malformation and newborns or infants or children and third world country or developing country or low income country or horn of Africa or eastern Africa or gulf of Aden or Ethiopia or Djibouti or Somalia or Eritrea or Sudan or Kenya or Uganda or Tanzania or Burundi or Rwanda or Madagascar. A manual search for additional relevant studies using references from retrieved articles were performed by all of the 5 authors of this review. The searching of researches was restricted to human studies with English language only. Literatures were downloaded to Endnote version 7 to maintain and manage citations and to facilitate the review process.
Condition |
Context |
Population |
Congenital Anomaly |
Third world country |
Newborns |
Birth Defects |
Developing Country |
Infants |
Congenital Malformation |
Low income country |
Children |
|
Horn of Africa |
|
|
Eastern Africa |
|
|
Gulf of Aden |
|
|
Ethiopia |
|
|
Djibouti |
|
|
Somalia |
|
|
Eritrea |
|
|
Sudan |
|
|
Kenya |
|
|
Uganda |
|
|
Tanzania |
|
|
Burundi |
|
|
Rwanda |
|
|
Madagascar |
|
Table 1 A logic grid (search map) for the proportion or prevalence of structural congenital
Types of studies, participants, and exposure: studies that was conducted using a cross-sectional, cohort and case control design after 2009 among children of eastern Africa were the sources of data for this review. Authors believe that the factors of congenital anomaly are time dependents. Thus, reviewing papers that published before 2009 may increase the heterogeneity of the meta-analysis result. Studies that focused on mother-child pairs, parents, relatives or genetics and only child were included. Studies in vivo or studies that assess risk of environment independents of human subjects were excluded.
Contextually similar researches done before 2009, carried out on animals, written in none-English language, used a none cross-sectional or cohort or case control design were excluded. In addition, researches with poor quality based on JBI criteria were excluded whenever the reviewers agreed to reject the paper but clear reason were documented for exclusion. The exclusion was declared when two authors’ appraisal is congruent unless a third reviewer assigned. Thus, the decision either to include or reject the paper would be dependent on the third reviewer. Moreover, PRISMA9 flowchart were used in including and excluding papers as well as to present the whole phase of data extraction process.
Outcome measures: The outcome of this review was proportion of structural congenital anomaly. Congenital anomalies might be physical birth defects like club foot, spinal bifida, or vital organ anomalies like kidney, heart or stomach anomaly and functional congenital anomaly. Yet the concern of this review is only structural congenital anomaly identified clinically or using diagnostic imaging as per the reports of researches.
Data extraction: Titles and abstracts were retrieved using the search strategy. Additional sources were screened by all of the five authors to identify studies that were potential to be included. The title then abstracts and at the end the full text of all the potentially eligible studies were assessed for eligibility by all authors independently. Two reviewers were assessed a single study at the same time. If two of the reviewers agreed to include or exclude the paper, it was treated as it is. But if the two reviewers had discordant review result, a third reviewer was invited and evaluated the paper. The decision was made by 2 of the 3 reviewers’ decision. Information on the author, year of publication, journals, design, area or place (rural/urban) of study, sample size, response rate, and other data that were significantly related to congenital anomaly were extracted. Electronic mails were sent to the corresponding or first author of the studies or abstracts for missing information and waited up to 3 or 4 weeks for their responses. If there was no response, the paper excluded with a justification of not available.
Assessment of risk of bias: the authors piloted the studies in group for possible bias using JBI,10 and Glasgow university11 critical appraisal checklist.
Assessment of heterogeneity and data synthesis: The heterogeneity of studies was assessed using graphic aid particularly forest plot. The overlapping of confidence intervals was assumed, if there is heterogeneity. The other statistical tests considered were chi-squared test (Cochran Q test) and I square statistic (I2).12
Statistical methods: Statistical analysis were carried out using the statistical software package Stata version 14 with build in meta-analysis commands. Using the command sensitivity analysis, subgroup analysis, funnel plot, and Egger test13 were performed.
From PubMed, google scholar, and other gray literatures, a total of 16 researches were included for both qualitative and quantitative analysis after critically appraised using JBI checklist. Five of the studies were from Kenya, the other 5 studies were from Ethiopia, 3 studies were from Sudan, 2 studies were from Uganda, and 1 study from Eritrea. Unfortunately, we can not access studies from the other eastern African countries (Table 2).
Based on the inclusion criteria, and critical appraisal checklist, a total of 16 researches were included to determine the pooled proportion of structural congenital anomaly in the 11 of eastern Africa countries (Figure 1&2). The pooled proportion of structural congenital anomaly in eastern Africa was 4.54 per 1000 with 95% CI (4.23-4.85). Of the researches included in this review the maximum proportion of congenital anomaly was 6.08 per 1000 children and the minimum congenital anomaly was 3.97 per 1000 children.
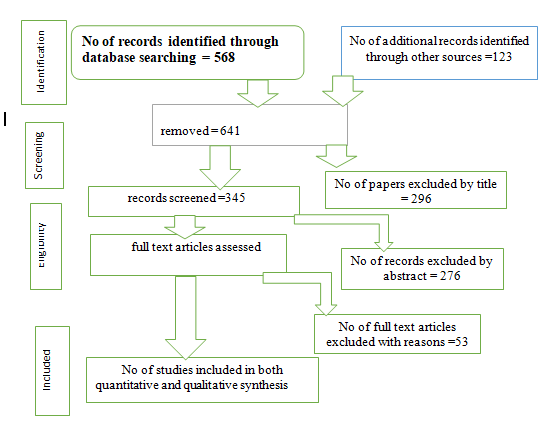
Figure 1 The schematic diagram of PRISMA flow chart in assessing proportion of structural congenital anomaly in eastern Africa.
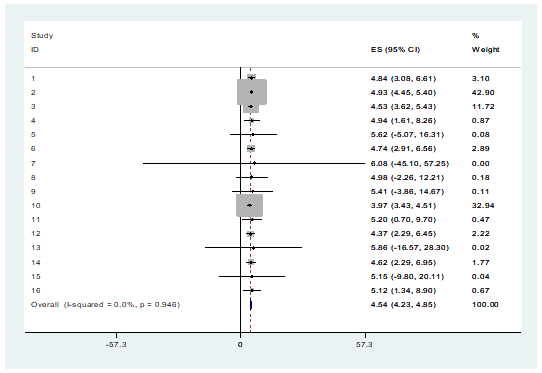
Figure 2 The pooled proportion of structural congenital Anomaly for the studies conducted from 2009 -2018 on proportion of structural congenital anomaly in eastern Africa.
Test of heterogeneity
The heterogeneity of the studies was tested using visual (subjective) techniques, Galbraith plot. The test checked whether all the points lied within the 95% confidence bounds or not. Except one study, all were within the 95% confidence interval and assured the studies are homogeneous on visualization (Figure 3).
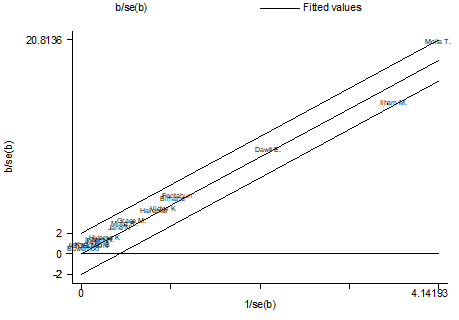
Figure 3 The test of heterogeneity using the subjective technique, Galbraith plot for the studies conducted from 2009 -2018 on proportion of congenital anomaly in eastern Africa.
Test of heterogeneity
The heterogeneity of the studies was also tested using objective technique. The objective technique estimates the magnitude of true heterogeneity (I2), and it was 0 with a p-value of 0.94. This indicated the studies are homogeneous and no need of further heterogeneity check and management like subgroup analysis or sensitivity analysis.
Funnel plot
The presence of publication biases in this meta-analysis were examined by visually checking for symmetry in funnel plots. The plot shows that most studies were on the top and one study is on the bottom. All the studies were clustered symmetrically around the mean effect size, although it clustered to the right side and very proximal to the mean from right side (Figure 4).
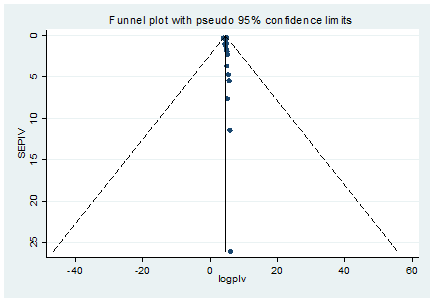
Figure 4 The test of publication bias using the subjective technique, funnel plot for the studies conducted from 2009 -2018 on proportion of congenital anomaly in eastern Africa .
Objectively testing using Egger’s technique
The presence of publication biases in this meta-analysis were also examined using objective method, Egger’s technique. The plot showed the absence of bias, since the line modeled in the Egger plot passed through the origin with a p-value of 0.5, bias coefficient (intercept) of 0.16, a standard error of 0.23 and a p-value of 0.03. The test thus provides strong evidence for the absence of small-study effects (Figure 5).
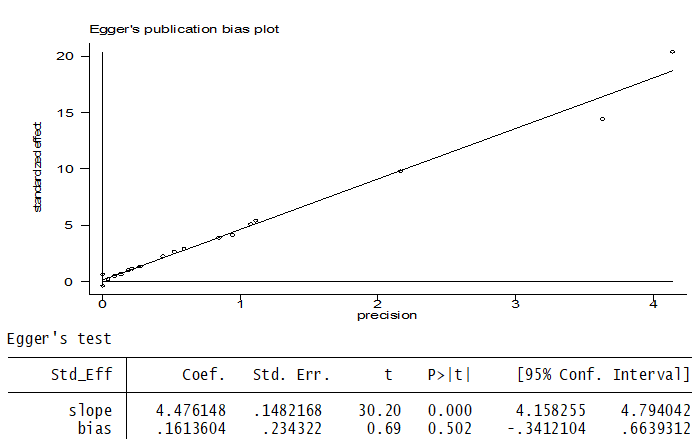
Figure 5 The test of publication bias using the objective technique, Egger’s plot for the studies conducted from 2009 -2018 on proportion of congenital anomaly in eastern Africa.
Cumulative meta-analysis
The pattern of effects and its significance over time of publications using meta-cum for binary data were assessed. All the studies cumulative effect was significant, even though the confidence interval is wide (Figure 6).
The current study was carried out as a systematic review and met-analysis to reveal the proportion of congenital anomalies in eastern Africa during 2009-2018. Based on the results of this review, the total proportion rate of congenital anomalies in eastern Africa was 4.54 per 1000 (95% CI, 4.23 - 4.85) live births. The World Health Organization’s report showed 303,000 newborns were born with congenital anomalies in 2016. In estimation 99 million births was been in a year worldwide, that gave the global proportion of congenital anomalies were 3 per 1000 live births. The report of WHO is slightly lower than the proportion of congenital anomalies in eastern Africa.14 Even the difference in rate is not as such considerable; it might be due to the difference in sample size. This review’s proportion is also higher than that reported by the European Surveillance of Congenital Anomalies registry, which was 21.5 per 1000 births.15 A review and meta-analysis in Iran reported the proportion of congenital anomaly was 18/1000 live births,16 which is higher than this review done for eastern Africa. The difference might be because of economical, particularly diet intake difference and use of better diagnostic tools in Iran. Those eastern Africa countries are the poorest countries, which causes to utilized organic diets most of the time due to lack of packed shop diets in relative to Iran.
The pooled prevalence of congenital anomaly in India was 18.5 per 1000 which is also higher than the review and meta-analysis of eastern Africa,17 which might be because of diagnostic tool and life style difference across eastern Africa and India. In addition to the above pooled prevalence, a number of primary studies reported congenital anomaly as follow across the world. A study from Pakistan in 2014 reported a prevalence rate of 70.4/1000 live births,18 and another study from Pakistan in similar year reported a prevalence rate of 6.2/1000 live births for congenital anomalies.19 A study across 22 European countries (2010) reported a prevalence rate of 23.9/1000 live births for congenital anomalies.20 In the UK reported a prevalence rate of 30.7/1000 live births for boys and 24.3/1000 live births for girls in 2014.21 The prevalence rate of congenital anomalies in Nigeria (2014) was 20.73/1000 live births,22 in India (2016), it was 23/1000 live births23 and in Sudan 2.4%,24 in North-West Nigeria, 7.1 per 1000.25 Irrespective of data difference, primary research and meta-analysis, all researches reported a higher prevalence than this review. This difference could be because of socio-economical difference, and health care service provided. The lower proportion of congenital anomaly was documented in two leading hospitals in Nigeria. The proportion was 2 per 10000 and 4 per 1000, which 3 per 1000.26 The study is lower than this current review, eastern Africa. This might be the difference in time period. The review consider data from 2009-2018 but the comparison was studied in 2003. The upgrade of genetic screening for congenital anomaly and update of surveillance tools could increase the cases of CAS. In general, the proportion of congenital anomaly in eastern Africa is low, while comparing with many others countries as discussed above. This report might be low because of lack of diagnostic tools and surveillance checklist. Therefore, for such countries with limited resources the recently published manual for birth defects surveillance is an excellent tool that enlists steps for facilitating birth defects surveillance.27–43
According to the findings of this meta-analysis, the Proportion of congenital anomalies is high in Eastern Africa, in relative to WHO’s worldwide report, which annually imposes huge financial, social and psychological costs on individuals, and heath care systems. Therefore, promotion of maternal health, community awareness about safe health practice, ANC follow-up and seeking health care for early diagnosis and prevention of birth defects would be essential and need to addressed to the communities. In addition, researchers should address the factors of congenital anomaly for specific actions.
This review is done on all types of congenital anomalies to determine the proportion irrespective of factors and different types of anatomic or physiologic anomalies. Thus, we recommended a specific meta-analysis with its’ factors for the purpose of implementation. There was also a lack of homogeneity in reporting anomalies by different studies, overlap of some anomalies, lack of homogenous coefficients for the estimation of proportion rate in different studies.
Conceived the title and designed the study: MWK, AMA, ABZ, and BBA. Searching literatures: MWK, ABZ, AMK and BBA. Extract the data: MWK, BBA, AMA, AMK, and ABZ. Critically revising the work: MWK, AMK, BBA, AMA, and ABZ. Writing the final paper: MWK, BBA, and ABZ. In finalizing this paper, all authors have been read and approved the final version of the manuscript.
This review used published data, and the ethical approval were waived by Woldia University, health science college institutional review board. This systematic review and meta-analysis were expected to indicate the burden of congenital anomaly in eastern Africa for policy makers. The final report of this review will be published in a peer-reviewed journal.
We are glad to thank all the researchers whose studies were used in this meta-analysis. We also thank the college of health science research and community service office for the facilitation of systematic review and meta-analysis training for the staffs.
The authors declare there are no conflicts of interest.
None.

©2020 Kassaw, et al. This is an open access article distributed under the terms of the, which permits unrestricted use, distribution, and build upon your work non-commercially.