Journal of
eISSN: 2373-4469


Research Article Volume 1 Issue 2
Correspondence: Benjamin D Yu, Division of Dermatology, Institute for Genomic Medicine, 9500 MC-0869, La Jolla, CA 92093, USA, Tel 858 534 9426, Fax 858 534 9425
Received: June 07, 2014 | Published: July 29, 2014
Citation: Kumar S, Ricker C, Yu BD. Chromatin remodeling of embryonic stem cells by EIA alters global histone h3 lysine 18 acetylation and loss of pluripotency. J Investig Genomics. 2014;1(2):43-51. DOI: 10.15406/jig.2014.01.00009
Oncoviruses such as the E1A adenovirus are capable of simultaneously interfering with several classes of chromatin-modifying proteins and are useful in studying epigenetic regulation of gene expression. The genomic landscape of the embryonic stem cells is highly complex, which is characterized by numerous locus-specific chromatin modifications and controlled by more than hundred enzymes. To better understand the regulatory mechanisms involved in maintaining stem cell identity, we introduced E1A and mutant isoforms into mouse ESC (mESC). We found that E1A rapidly suppresses stem cell identity, leading to the loss of stem-cell specific gene expression, silencing of stem-cell specific enhancers, and loss of pluripotency. Analysis of mutant E1A isoforms in mESC reveal a specific requirement for its N-terminal domain involved in sequestration of lysine acetyl transferases, P300/CBP, but not for domains involved in pRB- or P400-family interaction. In response to E1A, acetylation of P300 targets, H3K18 and H3K27, was globally inhibited. Furthermore, H3K18 acetylation, which is enriched at the promoters of pluripotency-associated genes, was rapidly eliminated from the promoters of OCT4, NANOG, SOX2 and KLF4. These studies indicate that E1A deregulates transcriptional machinery necessary for ESC self-renewal and pluripotency and suggests that promoter-associated H3K18ac may be involved in maintaining stem cell identity.
Keywords: e1a, stem cell, histone, acetylation, pluripotency, chromatin, embryonic
ESC, embryonic stem cell; H3K9ac, H3K14ac, H3K18ac, H3K23ac, H3K27ac, histone h3 lysine (position) acetylation; iPSCs, inducing pluripotent states; HAT, histone acetyl transferases
During early mammalian development, uncommitted cells demonstrate tremendous developmental potential.1 Isolation and cultivation of cells from the inner cell mass of blastocysts revealed several properties of embryonic stem cells (ESC), including pluripotent properties and the ability to propagate indefinitely in vitro.2,3 The self-renewing property of ESC and their ability to generate diverse cell types has major implications for biology and has the potential for new avenues of medical therapy.4 To investigate the mechanisms which enable pluripotency and self-renewal, the ESC state has been extensively probed using a variety of molecular and biochemical approaches.2 Genome-wide analyses of the regulatory landscape of cells in the ESC state, demonstrate stem-cell specific gene expression profiles, conservation of gene expression between different species and cell lines, and specific epigenetic regulatory patterns. Combinations of stem-cell determining transcription factors, including POU5F1, SOX2, NANOG, and KLF4, or non-coding RNAs have been identified, which contribute to the maintenance of pluripotency activity in vivo5‒8 or are capable of inducing pluripotent states (iPSCs).9
Epigenetic alterations in the chromatin state also demonstrate common patterns among stem cells.10,11 Covalent modifications of histones such as lysine acetylation and methylation are present at promoter sites of active and inactive genes in stem cells. Genetic inactivation of enzymes involved in modification of these residues reveal critical roles for histone methylation or demethylation, including maintenance of stem cell identity, repression of non-stem cell genes, or permissiveness for differentiation.12‒15 ESC-specific patterns of major histone acetylation site have also been identified.16,17 The general state of histone acetylation appears to contribute to maintenance of the pluripotent state. Acetylation of histones alters the local net charge and improves the accessibility of DNA to transcriptional machinery necessary for transcription initiation and elongation.18 At least seven H3 lysine acetylation marks, K9, K14, K18, K23, K27, K36, and K56, have been identified and are generated by multiple histone acetyl transferases (HAT).19‒22 Genetic ablation of single HATs (p300, CBP, PCAF, and GCN5) have no distinct effects on self-renewal and pluripotency which might be explained by genetic or regulatory redundancies.23‒25
The adaptability of the mammalian cell to genetic alterations adds to the complexity of studying the functions of specific histone marks. Genetic inactivation of multiple HATs occurs over many cell passages and potentially allow for compensatory mechanisms to obscure the immediate functions of regulatory proteins. A number of viral proteins interact with global transcriptional regulatory mechanisms and have been used in the past to inactivate one or more regulatory pathways. For example, the E1A adenoviral oncoprotein is capable of inhibiting multiple HATs simultaneously and acutely.26‒29 In addition to the efficiency and rapid inhibitory actions of E1A oncoprotein, well-characterized E1A mutant isoforms have been developed to further narrow its effect on specific classes of transcriptional regulators, including P300/CBP, retinoblastoma protein, and P400.30‒33 Here we studied the consequences of E1A transduction on the proliferation and pluripotency of mouse ESC. Through the use of E1A mutant proteins, we narrowed its effects on ESC behavior to its interaction with P300-family proteins. These findings were further investigated by analysis of P300 histone targets and revealed global down regulation of H3K18ac and H3K27ac. Analysis of H3K18ac occupancy reveals enrichment in ESC and depletion in response to E1A and differentiation. These studies provide an approach to globally alter histone regulation to study its acute effects on chromatin regulation and ESC identity.
Viral vectors and purification
Adenovirus control (dl312) and 12S E1A (dl1500) were kindly provided by Arnold J Berk (UCLA); p300 mutant R2G E1A was received from Elizabeth Moran; pRb mutant (dl1109), p400 mutant (dl1102) were obtained from JS Mymryk, Canada. Wild type and mutant adenoviruses were cultured, and purified as described in the product manual of ViraBind Adenovirus Purification Kit (Cell Biolabs). Adenovirus titers were calculated by plaque assay as described by Clontech, USA. For lentiviral vectors, 12S E1A was amplified from wild type 12S E1A Adenovirus using Phusion High Fidelity polymerase (NEB), using cloning AdE1A forward (GTCGACGAATTCATGAGACATATTATCTGCCACGG) and reverse (CTCGAGGATCCTTATGGCCTGGGGCGTTT) primers, and sequence verified. Lentivirus vector was generated by cloning wild type 12S E1A into pSin-EF2-Sox2-Puro at EcoRI and BamHI site (Addgene, #16577). EOS-GFP lentiviral vector was purchased from Addgene (Addgene, #21318). Lentivirus generation was performed as described in the SBI (System Biosciences) user manual using 293T cells. Lentivirus purification and concentration was performed as described previously.34
Mouse embryonic stem cell culture and differentiation
Mouse E14Tg2a.4 embryonic stem cells35 were passaged and cultured in mouse ESC media (DMEM-Knockout media (Life Technologies), 15% ES qualified fetal bovine serum, non-essential amino acids, 2-mercaptoethanol, antibiotics, SNL-derived LIF). R1 embryonic stem cells36 were cultured on mitomycin C-inactivated CF-1 mouse feeder layers in the presence of LIF. For differentiation, LIF was withdrawn for 2days and then treated with 1µM all-trans retinoic acid (Sigma) was used.
Cell analysis by immunostain, flow cytometry and alkaline phosphatase staining
Immunofluorescence staining was performed on paraformaldehyde-fixed cells. Primary antibodies used were: E1A (1:250, sc-25, Santa Cruz Biotechnologies), OCT3/4 (1:500, sc-0981, Santa Cruz Biotechnologies). Secondary staining (Life Technologies) was performed with Alexa Fluoro-labeled species-specific antibodies and imaged on an Olympus BX51 with X-lite fluorescent lamp. For flow cytometry, embryonic stem cells were dissociated, neutralized, fixed and permeabilized with BD Cytofix/Cytoperm Kit (BD Biosciences) and stained with anti-E1A for flow cytometry on Millipore Guava easyCyte 8HT. Alkaline phosphatase staining was performed according to manufacturer instructions (Stemgent). For cytospin staining, cells were trypsinized, washed with PBS, diluted to 106/mL in PBS, centrifuged on a Shandon Cytospin 4.
Histone, western and immunoprecipitation analysis
For histone analysis, 106 cells per 100µl were lysed in extraction buffer (PBS; 0.5% Triton X 100 (v/v); 2 mM phenyl methyl sulfonyl fluoride (PMSF); 0.02% (w/v) NaN3); centrifuged; washed; resuspended in 0.2N HCl; incubated overnight at 4°C; and cleared by centrifugation. Supernatants containing histones were analyzed on Qubit protein assay kit (Life Technologies). 0.25µg histone proteins were loaded on 4-20% Bis-Tris gradient gel (Life Technology) and western performed as described in Odyssey manual (LI-COR, USA). Anti-histone acetylation antibodies include H3K18ac (Abcam, ab1191); H3K9/14ac (CellSignal, 9677), H3K23ac (Millipore, 07-355-S) and H3K27ac (CellSignal, 4353S; Abcam, ab4729), total H3 (Abcam, ab1791) according to manufacturer instructions. Blots were stained with goat anti-mouse IgG (IRDye 800CW, Li-COR, USA) and goat anti-rabbit IgG (IRDye 680CW, Li-COR, USA), visualized and quantitated using an Odyssey Infrared Imager (Li-COR, USA). Levels of specific H3 acetylation were determined by normalizing each density value by total H3 loading control. For immunoprecipitation, cells were collected, lysed in cell lysis buffer [50mM Tris‐HCl pH 8.0, 150mM NaCl, 1mM EDTA, 1% NP40, 10% glycerol with complete protease inhibitor cocktail (Roche)] and cleared by centrifugation. Dynal magnetic beads were coated with IgG, E1A (Santa Cruz Biotechnologies, sc-25) or p300 (Santa Cruz Biotechnology, sc-585X), incubated with pre-cleared whole cell extracts overnight at 4C. Beads were washed with cell lysis buffer, boiled in 2x sample buffer, and analyzed by Western blot using LI-COR western blotting system.
Chip-seq analysis using CEAS
For analysis of H3K18ac occupancy in embryonic stem and differentiated cell types, CEAS software was used for gene and genome-wide analysis.37 Datasets used for ChIP-seq of human ESC and derived cell types include: GSM602259, GSM605304, GSM908948, GSM956006, GSM956007, GSM818024, GSM818022, GSM818023. To determine hESC differentiated embryoid body vs. undifferentiated GSE23034 gene sets,38 GEO2R was used to identify differential expressed genes.39 Top 2% and bottom 2% hESC-specific gene expression lists (Supplemental Table S1) were used to determine occupancy of H3K18ac in human ESC vs. derived cell types.
Quantitative real-time PCR analysis of RNA and chromatin immunoprecipitation
RNA was extracted using Trizol reagent (Invitrogen), treated RNase-free DNase and further concentrated using a RNA Clean & Concentrator kit (Zymo Research). Real-time qPCR performed with Maxima First Strand cDNA Synthesis and SYBR Green/ROX qPCR Kits (Thermo Fisher) in triplicate on a Lightcycler 480 (Roche). A comparative CT method was used for analysis using Gapdh or Beta-actin for mouse mRNAs.40 ChIP assays on embryonic stem cells were previously described.41 Chromatin was immunoprecipitated with anti-H3K9/14ac (Millipore), H3K18ac (Abcam) and Dynabeads (Invitrogen) overnight at 4°C, washed with RIPA buffer, eluted and uncrosslinked. The remaining DNA was treated with RNase and proteinase K, followed by purification on aminElute PCR purification kit (Qiagen). Primer sequences are for transcript and promoter analysis detailed in Supplemental Table S2 using Primer 3.42 For statistical analysis, a student t-test was performed for qPCR data in ChIP and RNA expression studies using paired biological triplicates and P-values <0.05 were noted.
To introduce E1A into embryonic stem cells, feeder-free E14 (129/Ola) mouse ES cells were transduced with the non-replicating adenoviral small E1A 12S (Ad-E1A) and control (Ad-control) for 24hours (Figure 1). Nuclear E1A protein was readily detected in Ad-E1A but not in mouse ES cells transduced with Ad-control within 24hours (Figure 1A, left panel). Flow cytometry consistently revealed more than 90% E1A-positive cells (Figure 1A, right panel). Culture of Ad-E1A transduced ES cells revealed rapid changes in typical ES colony morphology, including progressive transformation of E1A positive-cells into monolayers (Figure 1B). The change in ES colony morphology in response to E1A suggested a loss of the embryonic stem cell state. Alkaline phosphatase (AP) activity, which is highly expressed in undifferentiated mESCs,43 was lost in Ad-E1A transduced mouse ES cells compared to controls (Figure 1B). To determine if this response was exclusive to the feeder-free E14 ES line, E1A was also introduced into R1 mouse ES cells grown on fibroblast feeders (Supplemental Figure S1). Like the E1A-transduced E14 ES lines, R1 ES cells rapidly lost their ovoid colony morphology and became flat. We also noted that Ad-E1A and lentiviral E1A transduced human ES cells rapidly underwent cytolysis consistent with the oncolytic properties of E1A in human cells (not shown). The above observations suggested that E1A interferes with the maintenance of the embryonic stem cell state in mouse.
To characterize the effects of E1A on ES cell identity, we first examined changes in levels of transcription factors required for the maintenance of the pluripotent ES cells.3,5,7 Oct3/4, Nanog, Sox2 and Klf4 were also down regulated by at least 50% within 24hours of E1A transduction (Figure 1C). By 72hours, all four ES-associated transcription factors were suppressed by approximately 2-7 fold compared to Ad-control transduced ES cells. Similar responses were observed with introduction of E1A by lentiviral vectors (Supplemental Figure S2) and indicate that adenoviral sequences do not contribute the ES response to E1A. The reduction of ES-associated Oct3/4 and Sox2 suggested that E1A interferes with the transcriptional activity of loci associated with the maintenance of the ES cell state. The reduced expression of ES-associated transcription factors might also be reflective of altered cell identity of E1A-transduced cells. The GFP reporter, which is driven in part by Oct3/4 and Sox2 enhancer elements (EOS), was introduced into E14 ES cells and was confirmed to lose enhancer activity after differentiation of ES cells in response to LIF withdrawal (Supplemental Figure S3). In response to Ad-E1A and Ad-control vectors, EOS-GFP activity (Supplemental Figure S4) was lost in 72hours in 39.7% of E1A-transduced cells compared to 82.3% in control adenoviral transduced cells (Figure 2A) (Figure 2B). These findings support the conclusion that E1A suppresses enhancers associated with ESC cell identity.
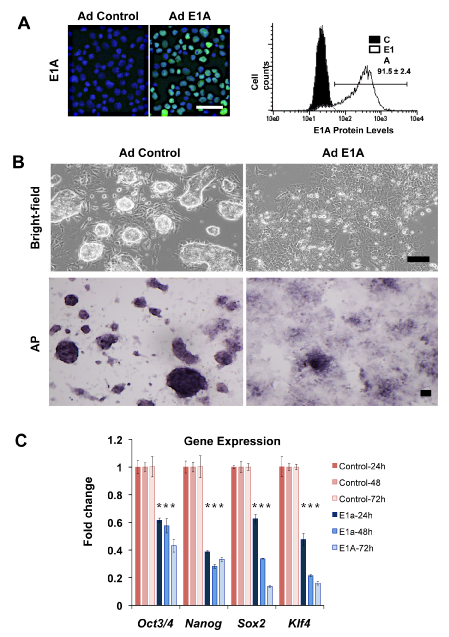
Figure 1 Loss of pluripotency in mESCs expressing E1A.
A. E1A immunostaining in mES cells transduced with control Ad and Ad E1A (left panel) and flow cytometry indicating >90% E1A-positive mESC post-transduction.
B. Phase-contrast and alkaline phosphatase (AP) staining of mESCs 72 hrs after control and Ad E1A.
C. RNA levels of pluripotency markers in mESCs expressing E1A relative to control from RT-qPCR. Data represented as mean±SD. For each time point, an asterisk denotes, which results demonstrate P<0.05 level of statistical significance.
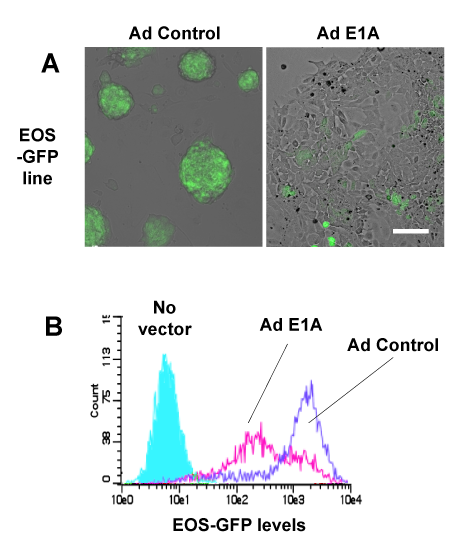
Figure 2 Loss of enhancer reporter activity in mESCs expressing E1A.
A. EOS-GFP reporter expression in response to Ad control vs. Ad E1A 72 hrs after transduction.
B. Flow cytometric analysis of GFP expression in mESCs-EOS reporter cell line 72 hrs after transduction with Ad control (blue) or Ad E1A (red).
Introduction of E1A in mouse ESC with a replication-defective vector results in transient expression of E1A protein. We examined the persistence of this mutant product over several days and found its peak expression at day 2 and nearly undetectable levels at day 9 (Figure 3). To determine if the loss of ES identity affect differentiation markers, gene expression analysis of several lineage markers was performed (Figure 3B). In vitro, ES cells are capable of undergoing differentiation, resembling three primary germ lineages and can be identified by the expression of neuroectodermal genes (Pax6, Notch), mesoderm (Brachyury), endothelial (Pecam1), endoderm (Gata4, Foxa2, Gata6).44 Unexpectedly, we found that E1A also repressed formation of neuroectodermal and endoderm, whereas Brachyury was induced. We found that Brachyury gene expression, an early marker for primitive streak, was higher at all the three time points tested. High Brachyury expression prompted us to test for additional primitive streak markers such as Goosecoid (Gsc), Evx1 and others (Figure 3C). After 48hours, 6 of 6 mesoderm markers were elevated in response to E1A. These results and the loss of ESC identity suggest that introduction of E1A promotes a mesoderm-like pattern of differentiation.
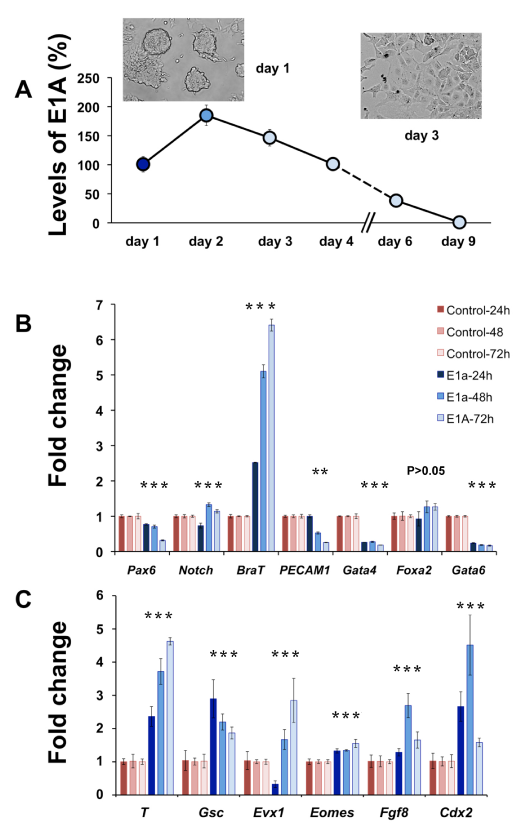
Figure 3 E1A inhibits expression of neuro-ectoderm, endoderm lineage genes of mESC.
A. Kinetics of E1A RNA levels normalized to day 1 after Ad-E1A transduction over 9 days in LIF.
B. RT-qPCR of neuroectoderm, mesoderm and definitive endoderm-specific gene expression in control (blue) - and E1A (red)-transduced mESCs. Asterisks indicate values which demonstrate P<0.05.
C. RT-qPCR of mesoderm gene expression markers in control (blue) - and E1A (red)-transduced mESCs. Values (mean±SD) are shown relative to undifferentiated mESC controls (white).
To better understand the mechanism of ES identity defects in E1A-transduced cells, we examined potential E1A protein partners (Figure 4). Through discrete domains, E1A is capable of interacting with multiple transcriptional regulators including lysine acetyl transferases, e.g. E1A-binding protein P300/CREB-binding protein (CBP), P400, and retinoblastoma family members (pRB family) and others30‒33 (Figure 4A). Sequestration of one or more of these factors may contribute to the altered identity of E1A-transduced mouse ES cells. Mutant forms of E1A incapable of binding P300/CBP family, P400, or pRB family were introduced into ES cells and expressed at similar levels (Figure 3B). Each E1A mutant except for E1A (R2G) triggered the loss of ES colony morphology similar to wild type E1A (Figure 4C). Consistent with the loss of ESC morphology, expression of stem cell determining transcription factors was also lost in wild type, mutant P400 and mutant pRB-binding E1A virus (Figure 5A). The morphology and expression of stem cell-associated genes were not significantly affected by mutant P300 E1A (R2G). To confirm that the loss of P300 binding in E1A transduced ESC cells, we verified the expression of the E1A (R2G) protein and loss of P300 binding, E1A (wt) and E1A (R2G)-transduced ES cells were examined by immunoprecipitation analysis, respectively (Figure 5B). These findings suggested that E1A-mediated loss of ES identity may occur through proteins P300, CBP.
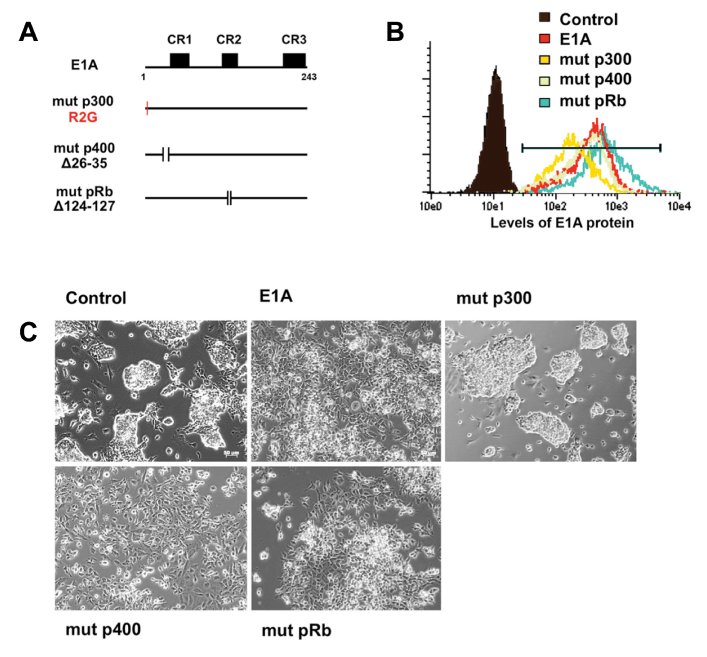
Figure 4 Response of mESC to wildtype and mutant E1A isoforms.
A. Schematics of E1A and E1A mutants. E1A (R2G) is unable to bind P300-family proteins (mut p300); E1A (∆26-35) is unable to bind p400 (mut p400); E1A (∆124-127) is unable to bind pRB (mut pRb).
B. Flow cytometric analysis of E1A protein level in wildtype and mutant E1A-transduced mESCs.
C. Phase-contrast image of mESC morphology in response to wildtype E1A and mutant E1A isoforms, 72h post transduction. mESC morphology is lost in response to all isoforms of E1A except for mut p300.
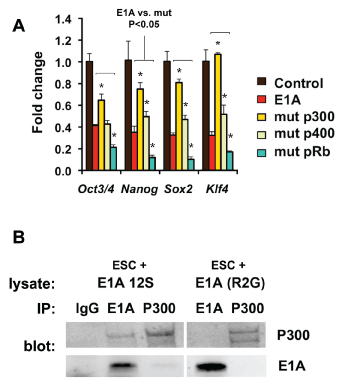
Figure 5 Loss of pluripotency requires E1A to bind p300/CBP.
A. RT-qPCR of pluripotency markers after transduction with wildtype vs. E1A mutant isoforms. Values are shown relative to undifferentiated mESC control. Statistical significance of gene expression differences between E1A and mutant isoforms was evaluated and denoted with an asterisk for values with P<0.05 (t-test).
B. Western blot and immunoprecipitation of mESC after transduction with wild type E1A vs. mut P300 (R2G). Lysates were immunoprecipitated with IgG, E1A or P300 and immunoblotted with P300 or E1A. In the upper panel, immunoprecipitation of P300 is detected with E1A but not in E1A (R2G) transduced mESC.
P300 and CBP are histone acetyl transferases capable of modifying chromatin leading to the acetylation of specific residues on histone H3 lysine 18 and lysine 27 (H3K18ac, H3K27ac). To determine the effect of E1A on P300 targets, we analyzed global levels of histone acetylation (Figure 6). Total histone nuclear extracts were analyzed by quantitative Western analysis for global levels of H3K9/14ac, H3K18ac, H3K23ac, and H3K27ac. Levels were examined 24hours after transduction with E1A vs. control adenovirus. Relative to total H3 protein, both H3K18ac and H3K27ac were suppressed in response to E1A, whereas levels of H3K9/14ac and H3K23ac wereminimally affected. These findings are consistent with the suppression of P300/CBP activity in mESC in response to E1A. H3K27ac is a well-characterized histone modification at active enhancers, and the loss of stem cell-specific enhancer activity (Figure 2A) (Figure 2B) is consistent with inhibition of H3K27ac. However, the significance of reduced H3K18ac in E1A-transduced ESC was less clear. Using available chromatin immunoprecipitation sequencing (ChIP-seq) data from the NIH Road map Epigenome Mapping Consortium,45 we investigated the localization of H3K18Ac in ESC of human. We initially focused on the occupancy of H3K18ac at the promoters of stem cell determining transcription factors, OCT3/4 (POU5F1), SOX2, NANOG and KLF4 (Figure 7A). ChIP-seq revealed extensive association of H3K18ac to proximal promoter regions of these four genes. H3K18ac occupancy has also been recently examined in human lung fibroblasts (IMR90). In comparison to H1 ESC, differentiated IMR90 fibroblasts failed to demonstrate significant occupancy of H3K18ac at 3 of the 4 loci. Enrichment of H3K18ac at the KLF4 locus was prominent in both H1 ESC and IMR90. To determine if enrichment of H3K18ac was a feature of other stem-cell associated loci, a global analysis of ESC-specific vs. differentiation-specific loci. Loci which are expressed in the top 2% (n=386) of H1 ESC genes showed significant enrichment of H3K18ac over all loci and over genes expressed in the bottom 2% of H1 ESC (n=364) relative to differentiated H1 ESC (Figure 7B). We examined the same set of loci in H1-derived mesendoderm (ME), neural ectoderm (NE) and mesenchymal cells and found decreasing enrichment at these loci in progressively more differentiated cell types (Figure 7B) (Figure 7C). Thus, enrichment of H3K18ac at stem-cell specific promoters occurs in ESC and mesendoderm but appears to change in response to neural and mesenchymal differentiation.

Figure 6 Global levels of histone H3 acetylation 24 hours after E1A transduction.
A. Western analysis of site-specific H3 acetylation 24 hrs after transduction with control Ad or E1A Ad. Infrared fluorescent images demonstrate H3K9/14ac, H3K18ac, H3K23ac, and H3K27ac (green) and total H3 (red).
B. Differences in levels of site-specific H3 acetylation E1A-transduced mESC were compared to control transduced mESC and plotted as a percentage of control levels. Shown values represent the mean±SD of 3 samples. Student t-tests were applied to test statistical significance of H3K18ac and H3K27ac vs. H3K9/14ac changes..
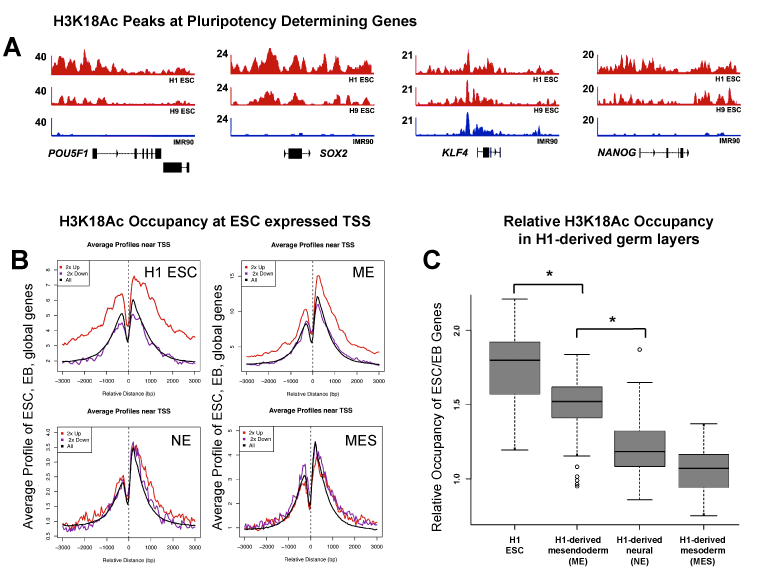
Figure 7 H3K18ac occupancy in human ESCs and derived germ layers.
A. ChIP-seq occupancy for H3K18ac over POU5F1, SOX2, KLF4 and NANOG.
B. Distribution of ChIP-seq signal near TSS comparing global analysis of ESC-specific (top 2% H1 ESC vs. H1 EB) and differentiation specific genes (bottom 2%).
C. Box-plot for differences in H3K18ac ChIP-seq density in hESCs and derived germ layers comparing ESC genes. We found decreasing enrichment of the ESC related genes in progressively more differentiated cell types. P-values (<2.2e-16), calculated using two-tailed t-test. ChIP-seq data based on Xie et al. (2013).
To determine the effect of E1A on promoter associated H3K18ac, we performed ChIP-qPCR on mESC 24hours after E1A transduction (Figure 8). We found that following transduction, association of H3K18ac with promoters of Pou5f1, Sox2, Nanog and Klf4, were rapidly loss (1.5-3.0x fold loss). We also examined the effect of E1A on H3K9/14ac which is known to occupy promoters of active genes. ChIP-qPCR of H3K9/14ac also revealed loss at 24hrs at the above promoters. The loss of H3K18ac from the promoters of repressed stem cell genes may or may not be a direct response to P300 inhibition. Similarly, H3K9/14ac is not considered to be a direct target of P300/CBP, but its dissociation from stem cell promoters in response to E1A is consistent with the loss of activity of these affected genes. H3K18ac plays a prominent role in cell proliferation. In particular, hypoacetylation of H3K18 is associated with re-entry into the cell cycle in growth arrested cells. We therefore examined the effects of E1A on mESC proliferation (Figure 9). Cell cycle analysis of mESC 72hours after transduction with control or E1A adenovirus revealed similar patterns of proliferation (Figure 9A) (Figure 9B) and similar doubling times of 19.82 and 20.97 hrs, respectively (Figure 9C). Consistent with the lack of significant cell growth changes, apoptotic changes, i.e. sub-G1 DNA content, showed small but insignificant increases in response to E1A (Figure 9B). The majority of transcriptional changes in cell cycle regulators also showed no significant response to E1A in mESC, with the exception of increased Cdkn2a (P16INK4A) and Ccne2 (CycE2) expression. Overall, these findings indicate that E1A has no significant acute effects on cell proliferation and that cell identity defects caused by E1A are independent of major changes in cell proliferation and survival.
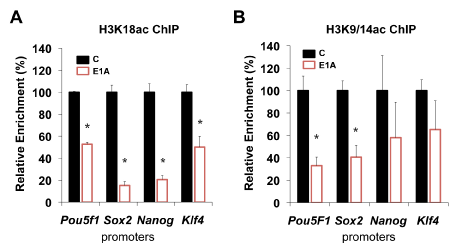
Figure 8 Loss of H3K18 and H3K9/14 acetylation at stem-cell specific promoters 24 hrs after E1A.
A. ChIP-qPCR H3K18ac of stem cell-specific promoters (Pou5f1, Sox2, Klf4 and Nanog) after E1A.
B. ChIP-qPCR H3K9/14ac of stem cell-specific promoters 24 hrs after E1A. Shown are the means±SD of technical replicates. Data is representative of three experiments. Asterisks denote P-values <0.05.
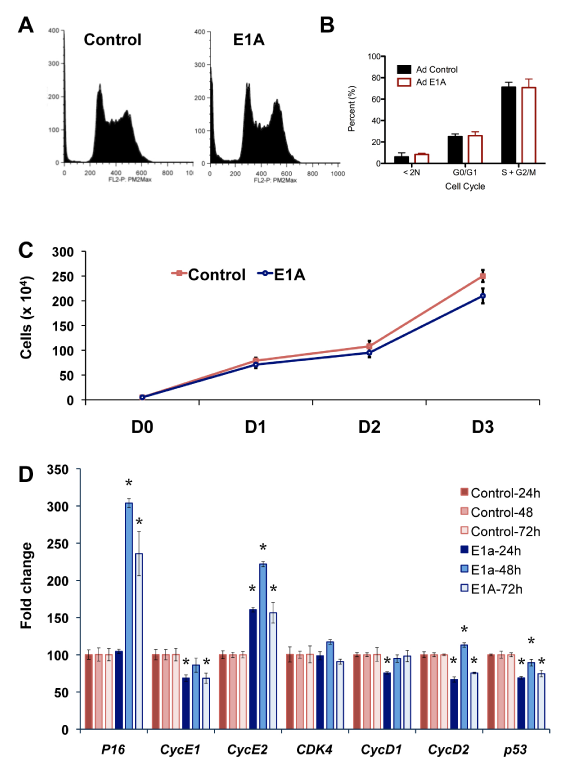
Figure 9 Cell cycle and proliferation of mESCs in response to E1A.
A. Cell cycle profile of mESC 72hrs after control and E1A adenoviral transduction.
B. Quantification of cell cycle profiles of Ad Control vs. Ad E1A show similar cell cycle patterns.
C. Growth curves of mESCs from 0 to 3 days after treatment with Ad control and Ad E1A.
D. RT-qPCR of cell cycle-related genes in mESCs expressing E1A relative to control. Data are represented as mean±SD. P-values (<0.05) are denoted over each time point and gene by asterisk.
The complex epigenetic landscape of the embryonic stem cell is an ideal model to study mechanisms of cell identity. E1A has been used to study transcriptional regulation of cell differentiation in several systems, but not to study the mechanisms of pluripotency.46‒48 Our studies examine the effects of E1A on the pluripotency program using embryonic stem cells. We find that E1A oncoprotein rapidly suppresses ESC-specific gene expression and pluripotency. The effects of E1A on ESC identity are dependent on a single N-terminal domain, which is involved in inhibition of P300 and related proteins. Furthermore, in response to E1A, P300 targets, H3K27 and H3K18, show global reduction in acetylation. We identified localization of H3K18ac to stem cell-specific promoters in ESC and found that H3K18 acetylation was lost at these promoters in response to E1A. These findings suggest that E1A suppresses ESC identity by inhibiting P300/CBP and their targets to suppress stem cell identity.
E1A is capable of interacting with multiple epigenetic regulators including P300/CBP,49 GCN5,50 pRB and P400 complexes. We found that E1A effects on ESC identity were dependent on one site, its N-terminal domain while mutations at other sites, involved in sequestration of pRB and P400, were not required. The N-terminal domain of E1A inhibits P300 and CBP activity but also potentially affects TATA-binding protein (TBP) and proteasome S8.51 While we cannot rule out the possibility that interference with TBP or S8 affect ESC identity, we found no evidence that transcription was globally suppressed. The lack of apparent involvement of pRB in the E1A-induced effects is consistent with previous work on pRB where absence of three RB members (RB, p107, p130) did not affect mESC growth and self-renewal.52 P400 has been implicated in ESC maintenance53 and in E1A-induced transformation.54 In our studies, E1A-induced effects on ESC identity did not appear to require its interaction with P400. The outcomes of our studies may reflect differences in methodology of RNA i-mediated knockdown (where global loss of P400 may occur) vs. E1A-mediated sequestration of P400, where the latter may reflect a more limited subset of P400 protein. Nevertheless, we conclude that the E1A-induced effects on ESC identity are not related to its ability to interact with P400.
Histone acetylation of H3 lysine 18 (H3K18Ac) has been recognized for its role in the regulation of cell proliferation. Regulators of H3K18Ac including P300/CBP, and deacetylase, SIRT7, play a major role in cell cycle regulation and cancer. Consistent with this role, growth-arrested cells are characterized by high levels of H3K18Ac and, upon global depletion by the E1A oncogene, growth-arrested cells are capable of re-entering the cell cycle. Ferrari found that the binding of E1A to p300/CBP leads to new H3K18ac marks at the promoters of cell cycle genes and accompanied by transcriptional activation. These results are consistent with our findings of H3K18ac occupancy on active promoters of stem cell-specific genes. In the mESC, we did not see a major effect of E1A on cell proliferation. The lack of an effect of E1A on mESC proliferation may reflect the already highly proliferative state of the embryonic stem cell. This unique property of the mESC and the lack of an effect of E1A on ESC proliferation allow us to study the direct role of E1A on interference with the transcriptional machinery during pluripotency independent of cell cycle alterations.
We found that E1A repressed expression of lineage-specific genes even in its undifferentiated state. A number of developmentally regulated genes are open or poised for activation in the ESC state. The consequence of reduced transcription of these genes prior to differentiation is not yet known. Interestingly, while lineage markers of neuroectoderm and endoderm were suppressed, we found evidence for increased expression of primitive streak-specific genes. These findings demonstrate that transcription is not globally suppressed by E1A and that epigenetic differences in lineage determination may be present. These differences may reflect differences in how histone modifications are used in lineage specification. Interestingly, mesoderm-like induction observed in E1A-transduced mESC has also been observed in at least one other study, where down regulation of ASH2L, a histone H3K4 methyl transferase, also results in increased mesoderm lineage expression.56 However, because our study does not specifically address whether E1A affects mono-, di-, tri and tetra-acetylation of histone H3 and other target proteins, including transcription factors,56 further investigations using mass spectrometry are needed to shed light on how E1A affects other modifications of histone H3 and global acetylation of target proteins in ESC.
ChIP-qPCR
The embryonic stem cells were crosslinked for 15min at room temperature in cross-linking buffer (0. 1M NaCl; 1mM EDTA; 0.5mM EGTA; 50mM HEPES pH 8.0 in distilled water with fresh 11% Formaldehyde), neutralized with glycine, washed and then homogenized. Cells were lysed in lysis buffer (50mM HEPES pH 7. 5, 140mM NaCl, 1mM EDTA, 10% Glycerol, 0. 5% NP40, 0. 25 % Triton X-100, protease inhibitors) on ice for 10min, then centrifuged at 3500 rpm for 10min at 4°C. The pellet was resuspened in protein extraction buffer (200mM NaCl; 1mM EDTA; 0. 5mM EGTA; 10mM Tris, pH 8.0 with protease inhibitor in distilled water) and rocked at room temperature for 10min, then centrifuged at 3500 rpm for 10min at 4°C. The pellet was resuspended 1ml of chromatin extraction buffer (10mM Tris-HCl, pH 8.0 100mM NaCl; 1mM EDTA; 0.5 mM EGTA 0.1% sodium deoxycholate; 0.5% N-lauroylsarcosine with protease inhibitor in distilled water) and sonicated in a Bioruptor (Diagenode). Modified histones were immunoprecipitated with anti-H3K9/14ac (CellSignal, 9677) and H3K18ac (Abcam, ab1191) antibodies. Dynabead (Invitrogen) was washed with 5mg/ml BSA in PBS and incubated with antibodies overnight at 4°C. 50μg of chromatin was incubated with antibody-bound Dynabead overnight at 4°C. The immunoprecipitated material was washed five times with RIPA buffer (50mM HEPES, pH 8.0; 1mM EDTA; 1% NP-40; 0.7 % Na-Deoxycholate; 0.5M LiCl with protease inhibitor in water), then eluted using 10mM Tris, pH 8.0; 1mM EDTA; 1% SDS in distilled water and decrosslinked at 65°C overnight. The DNA was treated with 10mg/ml RNase and 20mg/ml proteinase K at 55°C for 2h then, eluted usingminElute PCR purification kit (Qiagen) and quantitated by real-time PCR.
We thank E Moran, JS Mymryk for generously contributing reagents. This work was made possible by the California Institute for Regenerative Medicine (CIRM) RN2-00908 and Skin Cancer Foundation Joseph A. Stirrup Memorial Award to B.D.Y. The content is solely the responsibility of the authors and does not represent the official views of the California Institute for Regenerative Medicine or other supporters.
Author declares that there is no conflict of interest.

©2014 Kumar, et al. This is an open access article distributed under the terms of the, which permits unrestricted use, distribution, and build upon your work non-commercially.