Journal of
eISSN: 2378-3184


Research Article Volume 7 Issue 2
1Department of Aquatic Resources Management Faculty of Fisheries and Marine Science Pattimura University Ambon Indonesia
2Maritime and Marine Science Center for Excellence of Pattimura University Ambon Indonesia
Correspondence: Bruri Melky Laimeheriwa Department of Aquatic Resources Management Faculty of Fisheries and Marine Science Pattimura University Ambon Indonesia
Received: January 18, 2018 | Published: March 14, 2018
Citation: Laimeheriwa BM, Khouw AS, Natan YL, et al. Phenotypic classification of mallucasring cowrie, Cypraea annulus linn., 1758 (gastropod: cypraeidae), based on shell meristical. J Aquac Mar Biol. 2018;7(2):80 – 90 DOI: 10.15406/jamb.2018.07.00189
The taxonomy of marine biota is the process of analyzing the characters that exist in the individual, connecting the available characters and creating similarities and inequalities between a large number of individuals. It is not easy to find and measure similarities or resemblance in great diversity. This study aims to construct the taxonomic character of Cypraeaannulusbased on shell meristic; analyzed the developmental stages of the ring snail shell and investigated the phenotypic classification of ring snails with numerical taxonomic approaches. This research lasted four years on the island of Larat and Ambon. The sample used was 2926 shells. Construction of morphological taxonomic characters using binary data types and ordinal types each with 84 test characters and 32 specimens of operational taxonomic units. The data is processed and analyzed by Laboratory of Maritime and Marine Science Centre for Excellence, University of Pattimura. The results of this study indicate that the development stage of C. annulus shell are: Juvenile stage (11-14.99 mm), subadult (15.00- 18.99 mm), adult (19.00-22.99 mm) and post adult (> 23.00 mm). The distribution of similarity coefficient and phenotypicdistance values between 32 OTU C. annulus has a meristic phenotypic similarity in the range of values 95% - 100% and the phenotypic distance in the range of less than 1.0. Phenotypic classification of C. annulus based on the meristic taxonomic character with characters 84 of the test at binary data type obtained one taxon phenotypic at a phenon similarity level of 90%; where as 84 of character test with theordinal data type, obtained two taxa phenotypic at taxonomic correlation level 0.880.
Keywords: numerical taxonomy, cypraea annulus, meristic characters, phenotypic, phenogram
The diversity of marine life is very high and is estimated to amount to 2.2 million species and only about 0.8 million species have been identified.1 A very large and varied number is certainly very interesting, but also difficult to learn. World marine biodiversity recorder sites or WoRMS reported that only 240,016 species are registered, 224,719 species have been verified and 441,796 are named synonyms.2 The limited number of taxonomists is a major obstacle to identifying the large number of marine biota.3‒5
The taxonomic and classification of organisms is fundamental and important in human life and science.6,7 Biologists have studied anatomical features and forms and used it for the analysis of organism forms for centuries,8‒10 and classified the organism primarily by its forms. Davis & Heywood, Losee & Dayrat11‒13 state that the goal of taxonomy is to provide an easy method for identification and communication, to detect the evolutionary process and interpret the results and to provide a classification system for expressing kinship relationships among organisms. Without knowledge of taxonomy and classification, scientists and practitioners will find it difficult to identify and compare one organism with another in marriage or hybridization.
Essentially, the taxonomy of marine biota is the process of analyzing the characters that exist in the individual, connecting the available characters14‒16 and creating similarities and inequalities between a large number of individuals. Agombar & Hawkswell17 state that it is not easy to find and measure similarities or resemblance in great diversity. However, in any biota with such great diversity, there must be some similarity in character and propertyalbeitsmall and little. This similarity used by taxonomists as the basis for classification. The creation of clear taxon boundaries becomes especially important when faced with a high diversity of marine biota, not only in quantity and species but also in theecosystem and climatic conditions, as in the tropics.
The factor of the lack of taxonomic character material being examined and the extent of the distribution of biota, also resultin not all variations of taxonomic characters can be recorded from existing samples so that many species produced will be reduced again in the future.18,19 Without a background knowledge of the characteristics of marine biota, it is difficult to obtain critical and sufficient knowledge in limitation of thetaxon, its distribution area, its variability and consequence of its name and its synonym.Another factor that is also involved in the factor of the subjectivity of researchers in the selection of characters that are considered important and the element of appreciation of a person towards characters also influences the work of taxonomy.20,21 If the restriction of the species is submitted to the researchers, the results will vary greatly according to the researcher's taste. Therefore, Avise22 proposes that in suppressing researchers subjectivity should be anticipated by the use of all sources of taxonomic characters information that exists either morphology, anatomy, physiology, behavior, ecology, geographical distribute, biochemical, microscopic, and even molecular10,23 through quantitative or numerical measures such as meristics, morphometrics,and geometric morphometrics.
The snail ring, C. annulus, known as the gold ring cowrie, is a small Cypraea type and belongs to the Cypraeidae family.24,25 C. annulus belongs to a true cowrie. According to Lorenz & Irie,26,27 there are two types of cowries, the true cowries of the Cypraeidae family and the allied cowries of the ovulidae family. C. annulus shells are in great demand and much hunted by coastal communities for use as a medium of exchange or currency, forecasts and ornaments in Africa and Asia region since about the 14th century BC. That's why C. annulus is very popular also called money cowrie and named Monetaria annulus.26,28
Research on C. annulus has been done a lot: the physical description of size, shape, color24,25,29 morphology of the shell and body,27,29,30,31 aspects of anatomy,24,25,31 aspects of physiology,24,25,31,32 aspects of ecology,24,25,31,33 aspects of behavior,24,25,34,35 growth and development,25,36 reproductive aspects,25,27,31,35,36,37,39 aspects of population dynamics,25,26,37,40 aspects of conservation.25,26,28,41 However, from all such information or publications, there are still limitations and disadvantages of non-metric or qualitative approaches.The specimen's taxonomy still comes from mature, intact individuals and very little information, especially information from Indonesian waters. On the other hand, there has been no information or publication about the taxonomic character of shell meristic in detail and thorough way.Therefore, the construction of the taxonomic character of gastropod especially C. annulus based on meristic characters will give animportant and great contribution to the development of ataxonomy of C. annulus, in particular, and gastropod in general.
Meristic characters are individual features that relate to countable morphological characters or counting methods. Meristic characters in gastropods, especially cowries, are not as numerous as found in fish, and even studies of meristic characters are very rare for mollusks. Some meristic characters that count such as the number of teeth on the lips of the shell, the teeth on the radula, and the number of a twist on the shell. Although the number of the characteristic indicators meristic shell is limited but considered very stable so that can use as a guide in the biota taxonomy.24,42
Conventional taxonomies that are descriptive or qualitative are very limited43,44 because using few characters, high skills are required and very subjective so that bias occurs if repetition by other taxonomists. Sokal & Sneath45 view the qualitative approach very subjective because different taxonomists can make different classifications for the same living creature. Dunn & Everitt46 Briggs et al. & Desalle44,47 conclude that to avoid or at least reduce the nature of this subjectivity, particularly in organism organisms, can be performed using as many taxonomic traits. As possible, description and measurements of the characters should be as clear and precise as possible; comparing the taxonomic character as precisely as possible, as well as quantitative or numerical. This approach has led to a phenotypic or numerical approach based on the concept that the kinship relationship between living things is based on the number of degrees of equations that exist.
The problem of conventional taxonomy is that taxonomists use very little taxonomic or material character of taxonomy, are subjective and require high skills and when repeated others are sometimes biased. With the numerical taxonomic model system constructed in this research can solve these problems because using many taxonomic character and objective and can be repeated by other researchers the result is not biased.Phenotypes and classifier modeling derived from numerical taxonomy have been applied to perennial fruit species to define appropriate morpho-taxonomic relationships with principal component analysis (PCA) and cluster analysis. This approach provides information on phenotypic diversity and serves to accelerate the utilization in breeding programs Osuji et al. This technique has been used in the gastropods but has focused on C. annulus and also on the meristic traits. However, a lack of unbiased and powerful standards and quantitative tools without relying on quantitative traits for classification has produced confusion and impeded progress in the taxonomy of C. annulus.
This research aims to construct the taxonomic character of ringcowrie C. annulus based on theshellmeristic, analyzed the size and stages of the development of snail ring and investigated the phenotypic classification of ring snails on the island of Ambon and Larat islands with numerical taxonomic approaches. This research is useful in separating and comparing populations and subpopulations, as well as monitoring and evaluating in detail and thoroughly Snail C. annulus so as to establish taxon that is used as a key identification in the classification according to taxon correctly, and can explain the actual C. annulus taxonomic position.
Specimen collection
The research was conducted for four years or sampling period which was 2013, 2014, 2015 and 2016. C. annulus shell specimens were collected from waters of Larat Island, and Ambon Island waters. The C. annulus specimen used as many as 2926 shells consistedof 2160 from Larat island and 766 from Ambon island. Observations and measurements of morphological characters were performed at the Bio-Image Studio, Maritime and Marine Science Center for Excellence of Pattimura University.
This research used a total of 32 OTUs (Appendix 1) derived from intra-species or population or type of C. annulus strain based on: geographical location (Larat and Ambon Island), harvest periods or seasons for four seasons (2013, 2014, 2015 and 2016) and shell development stages such as: Juvenile stage, sub-adult, adult and post adult. The geographical location of the specimens is determined with the consideration that the number of samples is available in large quantities, available throughout the year, easy to obtain samples as well as long distances so it is assumedthat there are distinct population characteristics or C. annulus strains and not directly related to the environment and lineage. Determination of juvenile, adult, subadult, and post adult shell development stagesare based on two approaches:development stage of shell callus48 and morphological stage of theshell24 (Figure 1) (Figure 2).
Data Collection
Measurement of the size dimensions of the shell is done manually or directly using digital scales to measure shellweight (SM), whereas digital calipers are used to measure shell length (SL), shell width (SW), and shell height (SH) with reference to schematics as shown in Figure 3. The shell length is measured from the anterior end to the posterior end of the shell,the width of the shell is measured from side to side on the widest whorl body, and the height of the shell is measured from the basal or ventral to the widest dorsal end.
The observed meristic taxonomic character refers to the overall structure and shape of a character that can calculate and is a property or feature found in the C annulus of C. annulus and/or compared to the structure and shape of characters in the class of gastropods and shells of the Cypraeidae family. The taxonomic characters of the shellfish constructed are derived from the taxonomic books which have been used as areference for the key to the identification of gastropods namely: Abbot et al.49,50‒56 The characteristic taxonomic of the meristic shell found and calculated in this study comprises the number of features, types, and parts of characters possessed both by the C. annulus shell and compared with the meristem character of the gastropod shell as a whole. Observations made directly with the naked eye or eye touch and or using image processing software or ACDSee. Pro3 and ImageJ ver. 1.51i. The type, number of shell meristic test characters and their mentions or character states constructed as taxonomic characters refer to Laimeheriwa57,58 presented in Appendices 2 & 3.
The coding of meristic taxonomic characters was done by a binary or two-state system for characters consisting of only two statements that were coded 1 or positive (+) and none was coded 0 or negative (-). Meristic taxonomic characters with more than two statements were coded or labeled 1, 2, 3, and so on. Each label containing a character was coded 1 while the other was coded 0.The use of “1” and “0” notations in n x t as an indication of the presence and absence of a property in a strain are used for the purposes of analysis using software since the computer program cannot recognize “+” and “-“ notations. The construction of taxonomic morphological characters uses two approaches of the construction method based on the type of data they have: binary data type (two state characters) and ordinal or discrete data types (multi-states characters).
Data analysis
Standardization or weighting of characters with ordinal data types (multi-state) using equationsproposed by Sokal & Sneath45 and Dunn & Everett.46
where SD is the standard deviation; Xij is characteredI for OTU j; is the mean character to i.
All character data and taxonomic units or OTUs are distanced in a hypothetical table of data sets in the form of nxt matrices, where n is the character and t are OTU to be calculated coefficients of similarity and dissimilarity between OTU pairs involving all test character data.Calculating coefficients of similarity of binary data types using Jaccard or SJ coefficients.45,46
where SJ is the Jaccard similarity coefficient,ais the number of positive, positive characters or “+ +”,b is the number of positive, negative characters or “+ -“; and c is the number of negative-positive characters or “- +”. Counting the coefficients of similarity for multistate and ordinal data or discrete data using Spearman correlation coefficients.45
where ρxy is the Spearman rank correlation coefficient,d is the difference between the shells of two variablesand N is the number of pair of observations. The calculation of taxonomic character distance between specimens used Euclidean distance59 with the equation:
The coefficients of similarity and dissimilaritywhichresult in next then created a similaritymatrix to show the similarity values of each OTU to one another. Furthermore, based on the similarity matrix, OTU grouping is done by the method of agglomerative hierarchical clustering (bottom-up). The clustering algorithm used in this research is UPGMA method and Ward method,60 where the union between OTU is based on the average value so that OTU fusion will occur. The identified OTU fusion results in a simple hierarchy in the form of phenon groups were displayed in phenogram form.
The OTU fusion results become phenon or taxa data in the form of phenogram, then the line at the level of the similarity coefficient and phenotypic distance is drawn to obtain the number of taxon or taxa groups represented by OTU or specimens selected based on the similarity and taxonomic distance of all the characters tested. The taxa may be defined as form or substrain, strain or subspecies, species or genus and so on, depending on the criterion of the selected and pre-determined specimen.
The similarity-level data on the phenogram is distanced in the phenogram evaluation matrix to perform the cophenetic correlation analysis with the initial similarity matrix. The result of matrix evaluation of phenogram and initial similarity matrix is used to determine Pearson correlation coefficient61 with theequation:
where R is the value of the correlation coefficient,X is the initial similarity coefficient, and Y is the phenogram evaluation coefficient. The correlation coefficient value of R count is considered acceptable and accountable as the classification of taxa if R count≥0.60 or 60%.45 The data obtained in the research were processed and analyzed using multi-character or multivariate analysis based on the procedures proposed by Sokal & Sneath,45 Dunn & Everitt46 such as factor analysis, PCA, clustering analysis and MDS. The assumption test is performed to determine whether all data have been met and feasible for multivariate analysis done with normality test, atest of data homogeneity, atest of sufficiency factor of Kaiser Meyer Oikin or KMO, freedom test between variables, and multicollinearity test. Meanwhile, to eliminate the influence of unit measurement of characters data transformation was performed in accordance with the needs of analysis and software used. Multi-character data analysis applied Microsoft Excell ver. 2013, Xlstat release 2014, MVSP ver. 3.1 and Minitab ver.17.
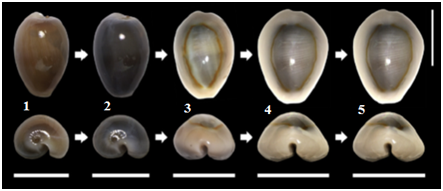
Figure 1 Types of developmental stages of the shell of Monetaria annulus based on callus development.47 Top: dorsal views; down: anterior view. Horizontal bar line: shell width (W). 1, Metamorphosis of the shell;2,juvenile; 3,subadult; 4, adult (callus growth ends); 5,post-adult (cell growth stalled). Vertical bar line: 10 mm.
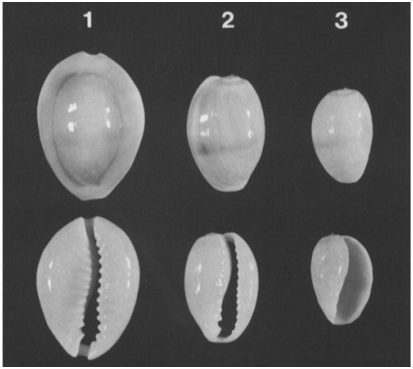
Figure 2 2 Stages of morphological development of the C. annulus shell.24 Top: dorsal view; bottom,ventral view. 1. An adult with a ring on dorsal surface; 2. sub adult with primordial teeth; 3. juvenile with a large aperture.
The size and stages of annulus shell development
The results of the research for four season periods found that C. annulus specimens in Ambon and Larat island can be categorized into shell lengths: very small size (11.67-12.64 mm), small (12.65-15.57 mm), medium size (15.58-18.50 mm), large size (18.51-21.43 mm) and largest size (21.44-25.84 mm). Category of shell weight size of C. annulus specimens in Ambon and Larat island is: very small size (0.14-0.16 g), small size (0.17-0.63 g), medium size (0.64-1.10 g), large size (1.11-1.57 g) and very large size (1.58-2.66 g). Shell width categories in Ambon and Larat island consist of: very small size (4.22-7.97 mm), small size (7,98-10,04 mm), medium size (10.05-12.11 mm), large size (12.12-14.18 mm) and very large size (14.19-16.74 mm). The shell height size categories of the C. annulus specimen found in Ambon and Larat island are composed of: very small size (2.21- 6.02 mm), small size (6.03-7.52 mm), medium size (7.53-9.02 mm), large size (9.03-10.52 mm) and very large size (10.53-12.64 mm).
Shell development stages, based on criteria proposed by Katoh,24 Irie & Morimoto,48 obtained four stages of development namely juvenile, subadult, adult and post adult. The length of the shell of C. annulus in Mollucas island, based on developmental stages, is categorized into four stages: juvenile stage (11.00 - 14.99 mm), subadult (15.00-17.99 mm), adult (18.00-22, 99 mm) and post adult (> 23.00 mm). In Figure 3, the results of the shell size of thedifferent developmental stage in Ambon and Larat islandare shown. From the Figure, it is evident that on the island of Larahave a shell size for each stage of development is greater than on the island of Ambon.
Distribution of coefficient similarity value and phenotypic distance between OTU pairs
Figure 4 shows the distribution of similarity coefficient value and phenotypic distances from the counting results of 32 C. annulus OTU pairs based on shell meristic characters with thebinary data type and 84 character test.The distribution of similarity or similarity coefficient using Jaccard coefficient and phenotypic distance obtained only one distribution of values that is in the range of 0.95-1.00 Sj coefficient and the spread value range 0.00 - 1.00 Euclidian distance. These results indicate that overall the similarity level of 32 OTU pairs for 84 characteristic meristic tests is very high for all OTU pairs although not 100% means there are still a number of differences between OTU pairs based on the 84 character of the test.
The distribution of coefficient similarity value and phenotypic distance from counting result to 32 OTU pair based on themeristic character of theshell with theordinal data type and 84 characters of thetesthasbeenshown in Figure 5. Figure 5 shows that the distribution of coefficient similarity or similarity using Spearmen correlation coefficient ρ and distance of Ed still show the same pattern that both obtained two distribution coefficient values. The distribution of correlation coefficient ρ values in the range 0.85-0.89 and 0.95-1.00 is dominated by the distribution value of 0.95-1.00. While the distribution of phenotypic distance values between 32 OTU pairs based on Ed shows the distribution of values in the range 0.00-1.00 and 1.00-1.99 (Figure 5).
In general, it can be said that the distribution of coefficient similarities and phenotypic distances between 32 OTU C. annulus based on Meristic test character indicate a consistent pattern for both binary and ordinal data types. This indicates that the C. annulus strain of the islands of Ambon and Larat has a very high phenotypic similarity.The range of values above 95% and some even reach 100% and a very small phenotypic distance that is less than 1.0 range means that there is still a small difference to the shell meristic because it is related to the different stages of development and growth of the shell, especially the Juvenile and subadult stages. However, the construction of a considerable taxonomic character and combining the higher character levels of the Cypraea genus to the gastropod class results in consistent taxonomic results, preferably using the stage of development of the Juvenile shell until post adult.
Phenogram similarity and taxonomic distance between OTU pairs
Ordinal data type (multi-state characters)
Figure 6 shows the correlation phenogram and taxonomic distance between taxonomies of 32 OTU based on 84 meristic character test of the ordinal data type shell. The results show that the phenon level of the taxonomic correlation of 0.850 forms a phenotypic or taxa group, whereas the phenon level in the taxonomic correlation value of 0.880 is formed by two taxa or phenotypic group C. annulus, i.e the first taxa consists of 26 OTU and the second taxa consists of six OTUs (Table 1). These results indicate that geographically, the period of time and stage of development, the meristic character of C. annulus in Ambon and Larat Island has a very high degree of phenotypic correlation on the coefficient of 0.850. At a correlation level of 0.880, the Juvenile specimens of the island of Ambon 2014 and Juvenile specimens from the island of Ambon 2015 are quite different from the 14 other specimens of the island of Ambon but are similar to the Juvenile specimens of Larat Island in 2013- 2016. In contrast, the correlation at 0.880 Juvenile specimens of Larat Island in 2013-2016 is merely different from the 12 other specimens from Larat Island.
The phenon level at the taxonomic distance of 7.0 formed two clusters or the C. annulus phenotype group i.e the first cluster consisting of 26 OTUs and the second cluster consisting of six OTUs. The phenon level at the taxonomic distance of 1.0 forms three phenotypic clusters of C. annulus, i.e the first cluster consisting of 18 OTUs, the second cluster of six OTU and the third cluster of eight OTUs. In detail, the number and type of OTU at each phenon distance waspresented in Table 2. Based on Table 2, the second cluster was dominated juvenile stage specimens from Larat Island from 2013 to 2016, as well as juvenile specimens from the island of Ambon in 2014 and 2015.
The result of analysis of 84 characters of shell test of C. annulus ordinal data type, obtained by three character class which is formed that is first character class consist of 81 characters, second character class consist of two characters and third character class consists of one character. In detail, the number and types of character classes were presented in Table 3.
Table 3 shows that all OTU specimens are included in the second character class, and none of the OTU specimens have the first character class, while the third character class only has two OTUs excluding the juvenile specimens from the island of Ambon 2014 and the juvenile specimens from the island of Ambon in 2015.
The OTU specimen configuration map based on the meristic character class of the ordinal data type indicates that 32 OTUs are in a single point or position (Figure 7). These results show that the characteristic meristic of ordinal data types indicate that 32 specimens studied are the same among the specimens with each other even if these specimens come from different locations, times and stages of life. This result is no different from the OTU specimen configuration map based on meristic character class using binary data type.
Based on 84 meristic taxonomic characters constructed with ordinal or multi-state data, types observed by the naked eye or by using software obtained two groups or taxa of the C. annulus phenotype on the island of Ambon and Laratisland. The results of this study indicate that the meristem C. annulus of the island of Ambon is very similar to C. annulus of the island both in the development stage and time period, although the similarity level is still below 100%. The similarities are smaller than 100%, more at different stages of development especially in the juvenile stage. This is understandable because at the juvenile stage the snails are still immature and still experience the healing and development of the shell. This is in accordance with the statement put forward by Katoh,24 Irie and Morimoto.47
Binary data types (two state characters)
Phenogram similarity and thetaxonomic distance between OTUs, binary data type, are presented in Figure 8. Figure 8 A shows that phenon level in 90% similarity was formed on one taxon or cluster only and all OTU specimens are incorporated in one phenotype. This means that the geographical C. annulus population, life stages and over a four-year period on the Island with Larat Island have a very high degree of similarity of over 90% and some even reach 100%. The 99% cophenetic correlation shows r-value over 60%, this means that the results of the calculations show valid or reliable results. The same is seen in the phenogram of taxonomic distances (Figure 8) in the same phenogram similarity. The phenon level at the lowest taxonomic distance of 0.2 formed one cluster or group of C. annulus phenotype both in the geographic location of Ambon and Larat islands, the four-year period and the shell developmental stage.
The result of analysis for 84 character test of shell meristicwiththebinary data type, obtained two character classes owned by C. annulus either from Ambon and Laratisland that is first character class consists of 80 characters and second class consists of three characters. The existence of these two classes of meristic shell characters in each OTU waspresented in Table 4. This Table shows that the second character class is all owned by 32 OTU specimens, while the first character class is not owned by C. annulus.
The OTU specimen configuration map based on the binary character's binary character class indicates that 32 OTU specimens are in a single point or position (Figure 9). In other words, the expression occurrence of shell meristic on C. annulus characters on the island of Ambon and Larat in a stable and consistent state by stages of development and time period.The characters constructed with binary or two-state data types observed by the naked eye or by using thesoftware. It is found that the numerical taxonomy of C. annulus based on the meristic test character with thebinary data type or two states derived a phenotype taxa at the taxonomic level of similarity in over 90% and ordinal obtained two taxa phenotypes at a taxonomic correlation level above 0.880. Numerical taxonomy with themeristic approach of binary data type shows all strains or OTUs joined into one cluster by using phenogram similarity and phenogram taxonomy distance. The merger seen at the phenon similarity level reaches 100% and the taxonomic distance of 0,0 means 32 OTU in the same meristic. This means that the 32 OTUs belong to one C. annulus species despite the geographic location difference and the time period of up to four years of research.The expression of the meristic character remains stable and consistent and can serve as a reliable taxonomic character in the identification of C. annulus species due to the weight High taxonomy. This is supported by Felsenstein & Meyer62,63 that there are two main functions of the taxonomic character: taxonomic characters have a function as a diagnostic aspect of the meaning, the character will be characteristic of the taxon. Thus it will not be wrong with the other taxon, and the second function as an indicator of kinship means, with the characters owned, could be used to look closely at the kinship relationship between a taxon with another taxon. The function of taxonomic character is indispensable in classification activities as well as species identification because of the main activity of classification and identification, is the observation of taxonomic characters of a taxon group.
The use of taxonomic characters should be very careful in taxonomy, which means to be chosen which really has taxonomic significance.64 Added that in the taxonomy based on morphological or qualitative characters, the characters that have no taxonomic meaning, namely the character caused by differences in age, sex, habitat, season, and diet. The age difference can affect morphological appearance, such as between cowrie larvae, Juvenile cowrie, and adult cowrie adult appearance is very different.24,27,42 The careful use of taxonomic characters is necessary because among the taxonomic characters themselves have a high taxonomic weight and low. The higher the taxonomic weight, the higher the trust level of the character. High-weighted characters are usually wide-ranging and very stable. High-taxonomic characters are widely used to distinguish taxons in the categories of orders to the top. Meanwhile, the lower taxonomic character is used more in the lower category under the order. The use of taxonomic characters should also be noted as well as adaptation issues, so as to minimize possible errors. Adaptation can cause character changes. This is consistent with anopinion5 that character change may occur due to adjustments to the overall environment such as body shape, special adaptation, isolation mechanisms, and adaptation due to competition.65‒69
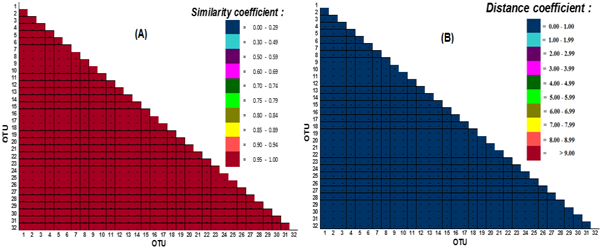
Figure 4 Distribution of coefficient similarity value and phenotypic distance between 32 OTU C. annulus pairs with binary data type; (A) phenotypic similarity coefficients based on the Jaccard coefficient, and (B) the phenotypic distance coefficient based on the Euclidian distance.
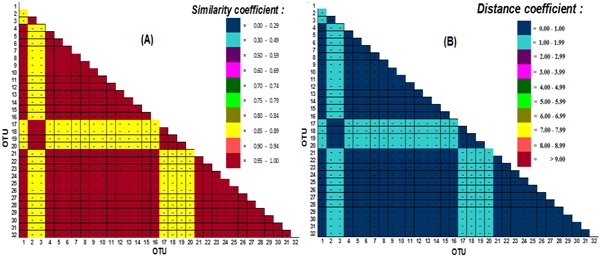
Figure 5 The distribution of coefficient similarity value and thephenotypic distance between 32 OTU C. annulus pairs with ordinal data type; (A) phenotypic similarity coefficient based on Spearman's correlation coefficient, and (B) the phenotypic distance coefficient based on Euclidian distance.
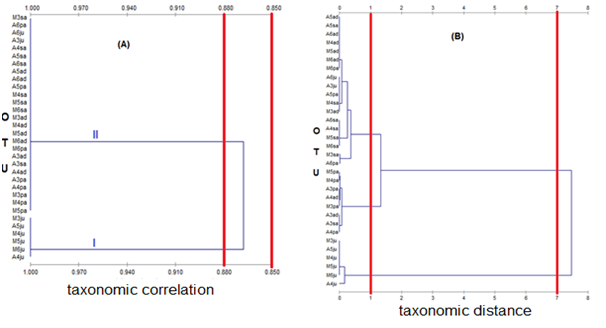
Figure 6 Phenogram of taxonomic similarity between 32 OTU C. annulus with ordinary data; (A) clustering withUPGMA method using Jaccard coefficient (Sj); (B) clustering with UPGMA method using Euclidian distance (Ed).
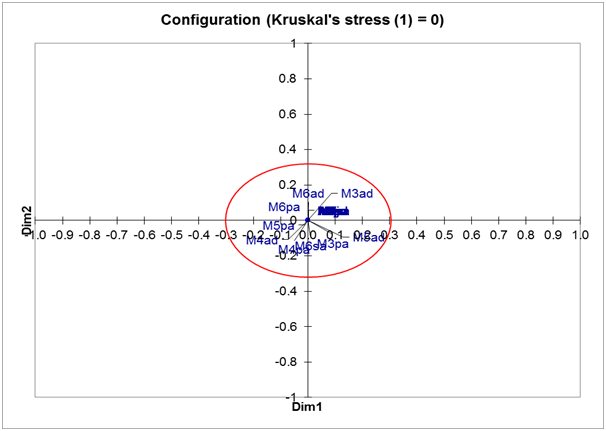
Figure 7 OTU specimen configuration based on meristic character class of ordinary data type using multidimensional scaling (MDS).
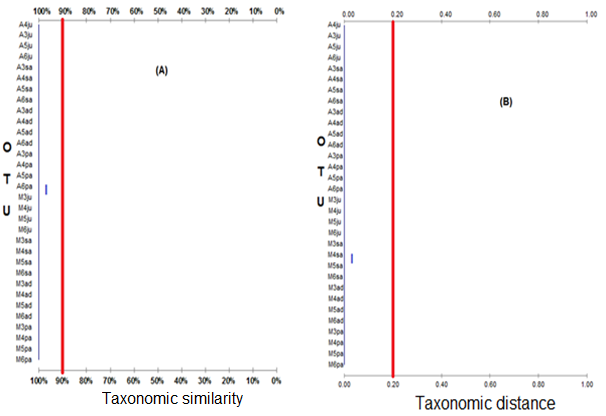
Figure 8 Phenogram correlation and the taxonomic distance between 32 OTU C. annulus with binary data type; (A) clustering with UPGMA method using Spearman correlation (ρ); (B) cluster with Ward method using Euclidian distance (Ed).

Figure 9 9 OTU specimen configuration based on meristic character class of binary data type using multidimensional scaling (MDS.
Phenon Level |
|
Correlation at 0,850 |
Correlationat 0,880 |
A3ju |
A3ju |
A4ju |
A6ju |
A5ju |
A3sa |
A6ju |
A4sa |
A3sa |
A5sa |
A4sa |
A6sa |
A5sa |
A3ad |
A6sa |
A4ad |
A3ad |
A5ad |
A4ad |
A6ad |
A5ad |
A3pa |
A6ad |
A4pa |
A3pa |
A5pa |
A4pa |
A6pa |
A5pa |
M3sa |
A6pa |
M4sa |
M3ju |
M5sa |
M4ju |
M6sa |
M5ju |
M3ad |
M6ju |
M4ad |
M3sa |
M5ad |
M4sa |
M6ad |
M5sa |
M3pa |
M6sa |
M4pa |
M3ad |
M5pa |
M4ad |
M6pa |
M5ad |
A4ju |
M6ad |
A5ju |
M3pa |
M3ju |
M4pa |
M4ju |
M5pa |
M5ju |
M6pa |
M6ju |
Table 1 The taxa cluster formed at the phenon level in the similarity phenogram from Figure 1A
The phenon level |
|
Distance at 7,0 |
Distance at 1,0 |
A3ju |
A3ju |
A6ju |
A6ju |
A3sa |
A4sa |
A4sa |
A5sa |
A5sa |
A6sa |
A6sa |
A5ad |
A3ad |
A6ad |
A4ad |
A5pa |
A5ad |
A6pa |
A6ad |
M3sa |
A3pa |
M4sa |
A4pa |
M5sa |
A5pa |
M6sa |
A6pa |
M3ad |
M3sa |
M4ad |
M4sa |
M5ad |
M5sa |
M6ad |
M6sa |
M6pa |
M3ad |
A4ju |
M4ad |
A5ju |
M5ad |
M3ju |
M6ad |
M4ju |
M3pa |
M5ju |
M4pa |
M6ju |
M5pa |
A3sa |
M6pa |
A3ad |
A4ju |
A4ad |
A5ju |
A3pa |
M3ju |
A4pa |
M4ju |
M3pa |
M5ju |
M4pa |
M6ju |
M5pa |
Table 2 The taxa cluster formed at the phenon level in the distance phenogram from Figure 1B
The results of this study indicate that the development stage of C. annulus shell are: Juvenile stage (11-14.99 mm), subadult (15.00-18.99 mm), adult (19.00-22.99 mm) and post adult (>23.00 mm). The distribution of similarity coefficient and phenotypicdistance values between 32 OTU C. annulus has a meristic phenotypic similarity in the range of values 95% - 100% and the phenotypic distance in the range of less than 1.0. Phenotypic classification of C. Annulus based on athemeristic taxonomic character with characters 84 of the test at binary data type obtained onetaxon phenotypic at a phenon similarity level of 90%; whereas 84 of character test with theordinal data type, obtained two taxa phenotypic at taxonomic correlation level 0.880.
None.
The author declares no conflict of interests.

©2018 Laimeheriwa, et al. This is an open access article distributed under the terms of the, which permits unrestricted use, distribution, and build upon your work non-commercially.