Journal of
eISSN: 2378-3184


Research Article Volume 5 Issue 6
Instituto de Biolog
Correspondence: Guadalupe de laLanza Espino, Instituto de Biolog, Tel 01 55 56229132
Received: June 20, 2017 | Published: June 27, 2017
Citation: Espino GL, Pulido SH (2017) Natural and Induced Space/Time Environmental Changes in the Teacapán-Agua Brava Lagoon System, NW Mexico. J Aquac Mar Biol 5(6): 00140 DOI: 10.15406/jamb.2017.05.00140
The Teacapán-Agua Brava lagoon system, in northwestern Mexico, is considered one of the most diverse and productive systems in the coastal zone of Nayarit (Mexican Pacific), classified as a RAMSAR Site and Natural Protected Area. It is, nevertheless, an example of bad planning of anthropogenic activities that have led to changes of diverse nature and intensity. Some of the natural changes: silting resulting from geological drift; marine transgression; 5.7% runoff decline during the last 40 years; 3%decrease in rainfall during the last 30 years. Man-made changes: correction and modification of canals for fishing purposes causing increased silting; hydraulic infrastructure and dam building causing more sea water intrusion which increases saline levels and, consequently, mangrove mortality (24,000 ha in 30 years); changes in land use, and poorly planned aquaculture, and among others. The hydrological basins of the four main tributaries of the lagoon system, as well as their surrounding areas, are regions with high agricultural activity that has had great impact and whose effects are worsened by the decrease in water contribution from the tributaries as well as by an increase in population.
All these reasons have made the Agua Brava Marismas Nacionales lagoon system environmentally vulnerable. This research analyzed the hydro-climatic factors that affect this lagoon system and the mangrove associate.
Keywords: Environmental, Cyclical-hydrology, Tropical, Coastal-lagoon
Mexican coastal lagoon systems, or wetlands, have a complex interaction with various environmental factors which makes them more vulnerable because, when the balance of the environmental framework is disturbed, the impact on the ecosystem is immediately felt. According to Moreno-Casasola,1 if sediments are deposited in wetlands and salt marshes, subsidence (submersion) occurs. If mangroves are cut down, the lagoons´ productivity is impoverished; changes the rivers mouths modify the hydrology and alter the exchange and amount of water and their quality, sediments and organisms entering and leaving the lacustrine environment. When anthropogenic economic activities increase in a disorganized way, as is the case with any hydraulic infrastructure, not only the functioning of the ecosystem must be considered, but also their medium term repercussions.
De la Lanza Espino & García Calderón2 mention the importance of water inputs for the survival of mangroves, as well as that of the fisheries associated with coastal lagoon systems. Hydrological alteration has generally been regarded as a key aspect when considering the conservation or recovery, as well as the high biodiversity, of these wetlands. Rivers (tributaries of the lagoons) are responsible for the input of important nutrient loads and sediments rich in organic matter, which even sustain fisheries and promote the development of high biologically productive ecosystems.
To understand the complexity as well as the instability of coastal systems, it is necessary to integrate the elements that can make them more or less vulnerable. Interconnections between ecosystems can occur as pulses or cycles, like the tides, involved in sediment transportation, supplying and distribution, as well as in the hydro-periodicity pattern.1 Some cycles occur daily, separated by a few hours (tides), while others are seasonal, such as water flows and sediments in rivers after a storm. There are some others like seasonal rainfall, with a monthly pattern, and, still others, with an annual pattern. There are occasional phenomena of variable cycles such as El Niño1 and La Niña, as well as tropical cyclones (hurricanes, depressions and tropical storms), which modify rainfall and runoff patterns, and may affect the biotic and abiotic characteristics of ecosystems, destabilizing the aquatic environment Yáñez-Arancibia et al.3
Mangroves grow mainly in tropical areas, between the marine and terrestrial environment, daily receiving varying amounts of fresh and sea water. To lose them would significantly affect all the species that depend on them for their biological development. It is thought that mangroves determine the growth of different species captured for commercial purposes4 This type of wetland is also affected by decreases or changes in rainfall and runoff patterns which modify salinity and soil quality.5
Mexico has just over 11,000 km of coastline,4 with more than 125 coastal lagoons in 12,600 km2, covering 33% of its coastlines.6 The coastal zone accounts for approximately 8% of the country's overall surface and contributes with nearly 25% of the primary productivity. These coastal ecosystems have been severely damaged, undergoing cumulative impacts. Between 1970 and 1995, Mexico lost 5% of its wetlands every year and between 1993 and 2002 the wetland surface decreased by 95 thousand hectares, at a rate of 0.42% per year. In the state of Nayarit, this loss has been estimated at around 7%.7
The CONANP8 mentions that the Marismas Nacionales Lagoon System in Nayarit is one of the world´s most productive environments but, at the same time, the fishing sector faces serious problems, such as the increasing competition between artisanal capture and the industrial aquaculture production which has led to the depletion of fish stock and the capitalization of productive infrastructure, generating illegal practices and breach of fishing bans.
From an anthropogenic point of view, in the Marismas Nacionales system, the activities related to the mangrove ecosystem contribute a direct income of almost 31.43%, 18.91% of which is shrimp capture, 11.7% is fish, and 0.82% are forestry activities.9 According to CONANP,8 these activities, which are limited by environmental problems like water pollution and changes in land use, deforestation, dredging, filling up and opening of river mouths, have altogether caused environmental and social deterioration, together with poorly designed coastal infrastructure, all of which diminish the productive potential of the ecosystem and intensify the risks associated with coastal hazards, mainly, meteorological phenomena. As an example of this we have the opening of the Cuautla canal in the state of Nayarit, responsible for the loss of 18% (86 km) of mangrove forest over a period of 13 years.10
Berlanga Robles & Ruiz Luna11 consider that if the degradation of the region's wetlands continues, we will reach a point where the coastal ecosystems will lose their resilience.
It should be emphasized that a unique feature of the coastal zone of Nayarit is that problems usually add to each other, the most serious problems of resource degradation have been gradually intensifying due to the combined effect of numerous small-scale actions and alterations which, on their own, would have had a relatively minor impact.12 These threats include a long list of activities that directly or indirectly affect the physical, chemical and biological components of wetlands and seriously threaten their conservation.12
All of the natural and anthropogenic factors mentioned above have negatively affected the Marismas National Lagoon System. Dipotet Barcasa & de la Lanza Espino13 have said that wetlands are ecosystems where with an intense competition between the ecological and socioeconomic values, these being the winning party and, which together with their geographical location, high biological productivity and dependency on fresh water, have made them very vulnerable. Today, tourism and the construction of hydroelectric dams have increased this vulnerability even more.
The Teacapán-Agua Brava lagoon system belonging to Marismas Nacionales, must be studied and understood in an integrative time/space context which includes all the elements mentioned above, that influence their productivity since, when they interact, they determine their functioning, maintenance, natural changes and/or alterations in different periods of time.
To analyze the space/time changes of environmental factors such as hydrology, hydro-climatology (rainfall-runoff) and mangrove of the Agua Brava lagoon system belonging to Marismas Nacionales, and to estimate conditions and trends.
The Agua Brava lagoon is located between parallels 22°04'and 22°13'N, and 105° 28' and 105° 36'W, on the coastal plain of NW Nayarit State,14 and belongs to the Teacapán-Agua Brava-Marismas Nacionales lagoon complex, between the north/south limits of the states of Nayarit and Sinaloa,15 on the Mexican Pacific.
The Tecapán-Agua Brava lagoon system consists of a network of tidal canals, flood zones, and lagoons, which together form a complex lagoon system. Its operation is mainly determined by the water influx from the rivers that flow into this lagoon system.
The lagoons in the system have different sizes and 44,836 ha of estuaries, covering an area of 448,640 ha Berlanga Robles,11 with a variable width of 0.8 to 1.5 km and an average depth of 2.5 m. This area is separated from the coastal zone by a strip of lowlands diagonally oriented with regards to the coastline.14,15 It joins the Pacific Ocean through the estuary and mouth of the Teacapán River as well as through an artificial opening called Palmar de Cuautla.14,15,17 The region´s climate corresponds to the Aw type, subtropical warm sub-humid, according to the Köopen system modified by García.18
The Cañas, Acaponeta, San Francisco, Rosa Morada and Bejuco rivers drain into the lagoon system; their deltas have produced a complex morphology that, during its geological evolution, isolated small bodies of water. This evolution has been favored by the coastal marine dynamics, forming strings or barriers that have increased the complexity of the lagoon system19 (Figure 1), with an area of influence of 821,686 ha, within which 136,651 ha correspond to the study area. The Acaponeta river basin covers an area of 5,092 km2 and its sub-basin covers an area of approximately 1,786 km2.20 The Cañas and Acaponeta rivers are located to the north of the lagoon system, and flow into the Agua Brava lagoon while the San Francisco, Rosa Morada and Bejuco rivers contribute water to the southern area of this lagoon complex, where several lagoons are found. A dense mangrove community is found here, consisting mainly of three species: white mangrove (Laguncularia racemosa), red mangrove (Rhizophora mangle), black mangrove (Avicennia germinans) and “botoncillo” (Conocarpus erectus), Lanza-Espino et al.19 Blanco and Correa et al.21 The hydrometric stations are located approximately 29 and 40 km away.
In order to do the time/space analysis of the environmental factors, we collected information on monthly rainfall variations from 1978 to 2001, based on records from the climatological stations: Acaponeta, Pajaritos-Acaponeta, Huajicori, Estancia-Huajicori, Palmar de Cuautla, Rosa Morada, Mesa Pedro Pablo and Mezcaltitán. Information on monthly runoff was obtained from the hydrological stations of the Cañas, Acaponeta, Bejuco, and Rosa Morada rivers, provided by the National Meteorological Service (SMN for its initials in Spanish) and the National Water Commission (CNA for its initials in Spanish).
The intensity and frequency of the El Niño and La Niña phenomena were obtained based on information from the ENSO Multivariate Index (MEI) from NOAA an, index representing the weight average of the combination of six ocean-atmospheric variables (atmospheric pressure, east-west and north-south wind surface components, sea surface temperature, air temperature and total cloud cover). From the page http://weather.unisys.com/hurricane/ we obtained cyclone frequency and intensity on the Pacific East that indirectly affect the Teacapán-Agua Brava lagoon system.
The change tendency of the mangrove cover was obtained from Berlanga16 and CONABIO (2009, 2017) who did a historical, multi-temporal analysis using Landsat MSS satellite images from 1973 and 1986, TM from 1990 and 1995, ETM + from 2000, SPOT that comprised from the basin of the San Pedro river to the south, to the basin of the Acaponeta river to the north; the most updated CONABIO4 information, which uses SPOT images, was also used. We also considered land use and vegetation, calculated in the Ecological Ordainment of the Coastal Plain of the State of Nayarit 2006 (Ordenamiento Ecológico de la Llanura Costera del Estado de Nayarit 2006) which used SPOT images from 2006 (Ministry of the Environment, Environmental Planning Office), and Ruíz-Luna, Berlanga-Robles and Acosta Velázquez , page consulted in.22
Rainfall
In some tropical lagoons, seasonal rainfall variations can be severe, leading to drastic changes in salinity, temperature, nutrients and circulation patterns,23 among others. In order to analyze this variation, we used a database from nine climatological stations located in the basin and sub-basins of the Acaponeta River, where mean rainfall was 1600 mm/year (Figure 2). According to Méndez et al.,24 some municipalities around this lagoon system registered an average rainfall of 1000 and 1500 mm/year.
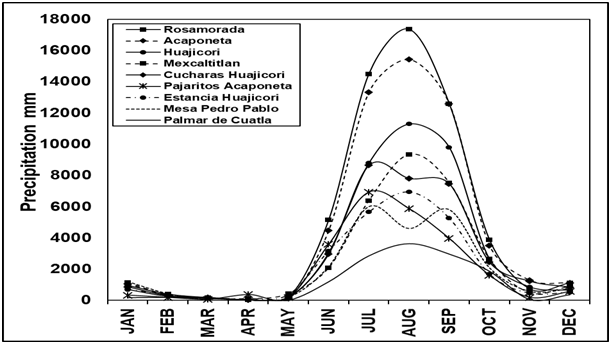
Figure 2 Monthly rainfall/climatic station in the Teacapán-Agua Brava Lagoon system, based on records provided by the Meteorological National Service.
A dry season was defined (November to May), which represents only 8% of the total annual rainfall. The rainy season occurs from June to October, with more intense rainfall in July, August and September (Figure 2). This is typical of Mexico where most rainfall occurs during the summer (Mosiño & García25 which often has cyclonic disturbances from the Pacific Ocean. Monsoons (seasonal wind loaded with rain produced by displacement of the equatorial belt) are also frequently present during this period.
The Mesa Pedro-Pablo, Huajicori, Estancia Huajicori and Acaponeta stations are located north of the lagoon system, along the shores of the Acaponeta River. Together they account for 47% of all the rainfall. We found a tendency rainfall decrease in the Acaponeta station. The Mesa Pedro-Pablo and Estancia Huajicori stations showed a tendency to rainfall increase from 1989 to 1995, and in 1981, 1983, 1985, 1993 and 1999 (Figure 3).
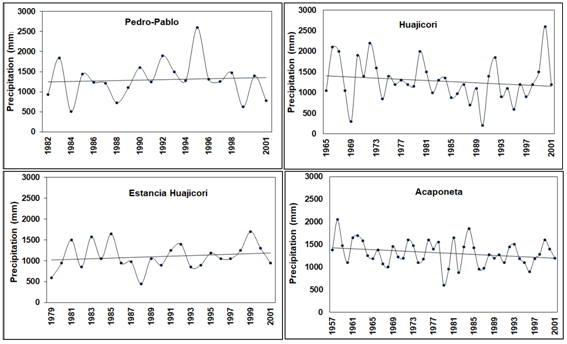
Figure 3 Annual rainfall data from the climatological stations found along the Acaponeta River (based on data provided by the National Meteorological Service).
Such increases could be explained by the influence of seasonal or eventual heterogeneous meteorological phenomena such as El Niño or La Niña (ENSO), and even to Neutral Phases Southeast of the Teacapán-Agua Brava lagoon system, we find the sub-basin of the Bejuco River which, like the Acaponeta River, showed a tendency to rainfall decrease. Méndez et al.24 analyzed rainfall trends in Mexico from 1920 to 2004, and determined that 11.8% of the climatic stations in the central coasts of the Mexican Pacific showed a decrease in rainfall, but our analysis at the Palmar de Cuautla station showed a tendency to an increase from 1990 (Figure 4) resulting from the humidity from the Pacific Ocean, as a result of tropical cyclones.26 Pavia27 suggests that rainfall may not be directly associated with the intensity of cyclones, nor to the location of its eye, or its duration, but rather with the cloud field it generates as it may rain before or after the cyclone. The FAO17 mentions that there are southeast to northwest monsoon-type winds along the coast of Nayarit which carry wet air currents blowing towards land during the first half of the year. According to Méndez et al.,24 this can be seen in those Inter-annual increases and/or decreases have been seen during 30 years of record taking. There records tic show one or more years with scarce rainfall, followed by a rainy year. This behavior is still seen; there is still a tendency to a decreased rainfall in the study area (Figures 3 & 4). De Lanza-Espino28 pointed to a similar behavior during El Niño phenomena of a high MEI that lasted more than two years (1982-84) which showed a strong decrease in rainfall during the first year and a significant increase in the second. Mosiño & Morales29 found that below-normal rainfall regimes in Central Mexico were related to the intensity of El Niño events. Morales et al.30 recorded a decrease in rainfall during the El Niño phenomenon in the coastal region of Jalisco, Nayarit, Sinaloa, Oaxaca and Chiapas. However, these inter-annual rainfall changes– increase and decrease - can be associated to climatic factors that show an annual pattern. García & Trejo31 mention that space/time heterogeneity in rainfall regimes are mainly determined by monsoons which carry moisture from the tropical cyclones and which, depending on their presence, number or intensity, will make some years rainier than others.
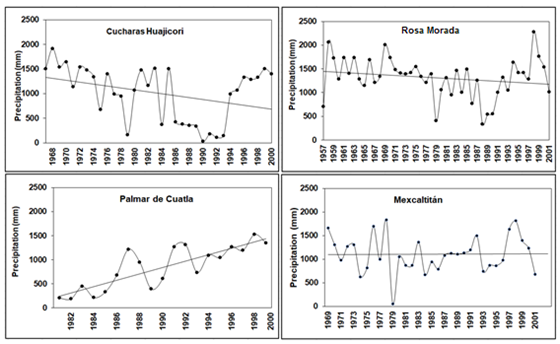
Figure 4 Average annual rainfall per climatological station (data provided by the National Meteorological Service).
In general, this study provides evidence of significant variations in the rainfall conditions of the Teacapán-Agua Brava lagoon system, as shown in its tendencies. These gradual changes of rainfall increase or decrease can be related to regional and global climatic factors that influence and/or modify rainfall. This variation puts at risk the environmental framework of the lagoon system, because it directly affects the rivers´ drainage volumes and, together, these variables determine changes in salinity intervals which allow the adequate development of the mangroves and these in turn, promote the development of fishery resources. According to De La Lanza & Gámez,32 salinity in coastal systems is fundamentally controlled by river runoff seasonality, marine influence and evaporation, all of which constitute the pluviometric regime as rainfall plays an important role in the management and permanence of tropical lagoon systems.
In the middle and lower parts of the main rivers, there is an agricultural cover approximately 671 km2 large that surrounds the Agua Brava lagoon system and which modifies the hydrological conditions and has an impact on its bordering wetlands. Dipotet Barcada and de la Lanza Espino13 mention that, in order to understand the role of wetlands, it is necessary to consider the interactions between these and their surroundings, which in this case is predominantly agricultural.
The hydrometric stations that register the average annual volumes are: La Ballona, on the Cañas River, with an average annual runoff of 117 mm3; Acaponeta, with a volume of 1,339 mm3; Rosa Morada, with a volume of 78 mm3, and Bejuco, with 139 mm3. Runoff in the Acaponeta River increases from June to September due to rainfall caused by the monsoon, with moisture from the ocean into the mainland (Figure 5). According to Méndez et al.,24 this is seen in stations that register rainfall increase in July, a reflection of the monsoon´s influence.
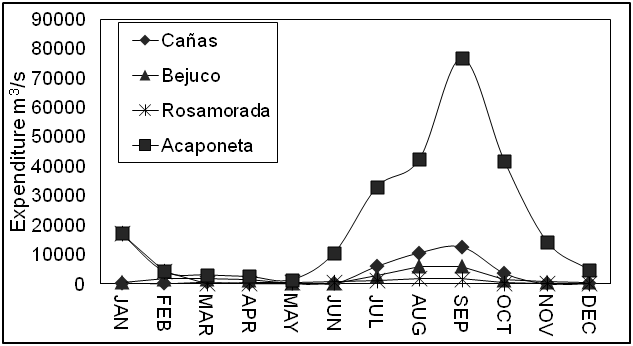
Figure 5 Monthly flow of the Cañas, Bejuco, Rosa Morada, San Pedro and Acaponeta rivers (data provided by CNA).
The hydrometric stations of the Cañas, Acaponeta, Rosa Morada and Bejuco rivers runoff an annual average of 1,675 Mm3 of water that goes into the lagoon system. The Acaponeta River is the main tributary, providing 80% of water (Figure 6), therefore it must be maintained an optimum volume that will allow the adequate hydrodynamic functioning of the lagoon system in order to preserve its biological, ecological and productive properties.
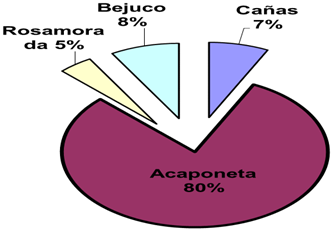
Figure 6 Runoff of the rivers that discharge their water into the Teacapán-Agua Brava lagoon system.
Runoff of the Acaponeta river decreased during a 61-year period and lost approximately 6.9 mm3 (Figure 7). Runoffs with the most water occurred in 1958 (with El Niño), 1968 (with La Niña-El Niño) and 1990 (El Niño-Neutral Phase). Time series variations show differences in between years, with higher than average runoffs, followed by one or more years with similar or smaller runoffs, with the exception of the period 1961 to 1975 in which higher than average levels prevailed. A later period showed an interval of constant decrease, from 1976 to 2006, explained by scarce rainfall as recorded during the last decade to recent times when El Niño, La Niña and the Neutral Phase occurred indistinctly. This trend is also caused because more water is being extracted (upstream) for agricultural uses. According to the council of the Presidio River basin in San Pedro (2006),there were376 users (general public, agricultural, industry, services, livestock and aquaculture) of the Acaponeta River which altogether, extracted 19,060.5 mm3of water, approximately 85% of which was used in aquaculture and the remaining 15% in other activities. During a 35 years period in which records were taken, the runoff tendency from the Cañas river decreased by 2 mm3 (Figure 8). The highest runoff s occurred indistinctly during 60´s (Neutral Phase), 1970, 1973 and 1975 (La Niña), and the lowest in 1966 (El Niño-Neutral Phase) and 1982 (El Niño).
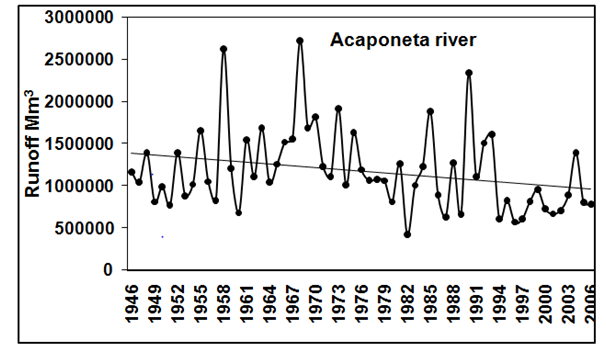
Figure 7 Annual runoff from the Acaponeta River during a 24year period (data provided by the National Water Commission, CNA).
The Rosa Morada and Bejuco rivers discharge south of the Teacapán-Agua Brava lagoon system. These rivers, together with the Cañas and Acaponeta have shown decreased discharges of 1 mm3 and 3 mm3, respectively (Figures 9 & 10). The highest runoffs occurred in 1971, 1973 and 1998 (El Niño and La Niña). The rivers Rosa Morada and Bejuco have frequently had high runoffs, 85% of which has been used for irrigation purposes (National Institute of Fisheries, 1994).
The rivers' contributions showed inter- and intra-annual variations which had an effect on the water requirements of the Teacapan-Agua Brava lagoon system, causing strong variations in the salinity range. De la Lanza33 reports that the global salinity depends on contributions from rainfall and rivers, and these are different on the Pacific slope (larger rivers but with less water and strong seasonal rainfall) than those in the Gulf of Mexico.
Runoff from the Rosamorada and Bejuco rivers is smaller than that from the Acaponeta, but the ecological importance of the runoff from the former ones is equal, to or greater than, that of the Acaponeta because the decrease in their seasonal run off is directly reflected on a local level. As an example we have areas of dead mangroves reported by Kovacs et al.10 and Berlanga,16 located within the area of influence of these rivers. Areas of high environmental degradation have been identified on the Ecological Ordainment of the Coastal Plain of Nayarit with the help of SPOT satellite images from 2006 (Ministry of the Environment): dead mangroves, loss of plant cover due to aquaculture activities, among others, areas located within the fluvial influence of the Rosa Morada and Bejuco rivers.
Runoff from the four rivers has shown an inter-annual behavior similar to that of rainfall, as both have been influenced by meteorological processes like cyclones and the El Niño phenomenon. Magaña et al.32 mention that rainfall deficits can occur during El Niño summers in the rainy season, when the decrease in rainfall has been remarkable. According to these authors, the most affected region in terms of water availability is the North Pacific, where El Niño and monsoon years that weaken runoff rendering it below normal. This condition is not normal, only in certain years.
Population increases near the four rivers directly or indirectly disrupt water volumes and quality in these ecosystems. Google Earth (2009) images of the Acaponeta River´s coastal plain show 18 settlements which altogether occupy area of21 km2, with a population of>50,245 inhabitants. In the southern region, 36 villages were identified within the plains of the San Francisco, Rosa Morada, Bejuco and San Pedro rivers which, according to the 2005 Population Census, had 135,813 inhabitants using hydrological resources, a fact reflected in the high contents of coliform bacteria present in these four rivers.
Mangrove area
According to the Ministry of Water Resources (1978), the mangrove area in the state of Nayarit covered more than 153,409 ha, 74% (113,522 ha) of which was the Teacapán Agua Brava lagoon system. Flores-Verdugo et al.35 wrote that mangroves covered an area of 111,387 ha, the largest mangrove area on the Pacific coast. De la Lanza et al.19 studied this area by means of LANDSAT satellite images in 1993 and described a mangrove area of 155, 690 ha; however, Kovacs et al.10 reported 474,000 ha in 1986 and 468,000 ha in 1999 although these authors only referred to some areas of the lagoon system. CONABIO in 2005, reported a mangrove area of 77,448.71 ha (Table 1) for the Teacapán-Agua Brava-Marismas Nacionales lagoon system. Berlanga-Robles16 estimated that the cover of this mangrove area was about 65,000 ha, with a deforestation rate of 0.8% per year, which meant that in 33 years some 24,000 ha, or about 30% of the existing cover in 1973 would be lost, while Kovacs et al.10 reports an area of dead mangrove of 18%. Differences in mangrove cover had explained by the variety of methods and scales used in each study: some studies include or exclude areas such as San Blas, the Mezcaltitán lagoon and parts of the Majahual system; other studies have included types of halophytic vegetation as well. Another element that causes variation has been that classifications were not 100% accurate.
|
Year |
Mangrove (ha) |
Reference |
|
1973 |
89183 |
Berlanga, 2006 16 |
|
1986 |
87155 |
Berlanga, 2006 16 |
|
1990 |
82364 |
Berlanga, 2006 16 |
|
1995 |
79972 |
Berlanga, 2006 16 |
|
2000 |
75042 |
Berlanga, 2006 16 |
|
2005 |
77449 |
CONABIO 2008 4 |
Table 1 Mangrove area in the Teacapan-Agua Brava lagoon system from 1973 to 2005
Irrespective of the differences between authors regarding the mangrove cover of the lagoon system, the fact remains that there has been a significant loss of it. Some of the causes are of anthropogenic origin, such as the opening of the artificial Cuautla canal in 1972, which modified the hydrodynamic conditions as well as the saline characteristics of the of water, causing large mortality in the area Gregorio et al.36
The opening of the canal in the Teacapán-Agua Brava lagoon system has caused the loss of mangrove area, regardless of annual rainfall and runoff, and even of extraordinary hydro-meteorological phenomena. Berlanga-Robles16 has calculated a decreasing tendency of the mangrove cover over a 27 year period (Table 1). In 2005, CONABIO and the Ministry of the Navy calculated an increase in the mangrove cover of 2,406 ha, but this is insignificant since it represents only 3% of the estimated total area (Berlanga Robles, 2008, personal communication). Figure 11 shows the changing trend in mangrove cover, the slope indicating a loss of 2,782 ha over a period of 32 years.
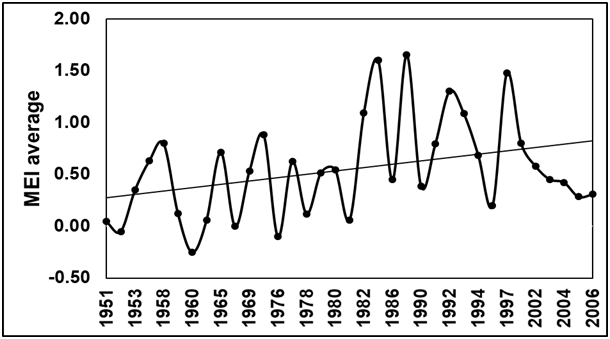
Figure 11 El Niño years with higher frequency and intensity (based on the Multivariate ENSO Index (MEI) and perceptible on coasts of Nayarit .
Berlanga Robles16 mentions that the greatest losses in mangrove area took place from 1973 to 1986, and from 1995 to 2000, with a tendency to runoff decrease from the Cañas, Acaponeta, Bejuco and Rosa Morada rivers (Figure 7-10), which modified the conditions of the mangrove area. According to Kovacs et al.,10 by 1986 there were other areas of dead mangrove due to hydrological changes and the resulting changes in salinity. Alvares et al.15 describe seasonal changes in salinity in 1970 and 1971, with an interval of 21 to 34 ups in the dry season and 0 to 13 ups during the rainy season. Recently, Islas García,37 recorded salinity measurements of 34 to 38 ups during the dry and the rainy season which shows the impact generated by the opening of the Cuautla canal in 1972, an effect that has worsened by the decrease in hydrological regimes plus the presence of anthropogenic activities. Flores-Verdugo et al.35 write that water salinity is a tensor in the development of mangroves, which reach their highest development point in brackish conditions of approximately 15 ups. Changes in hydrodynamics due to the opening of the Cuautla canal, as well as the obstruction of water flow dueto road construction, and the decrease in rainfall and runoff, have had a negative impact on the lagoon system causing salinization. Also, the continuous growth of shrimp farming has caused the loss of 3,200 ha.16
SAGARPA and the National Institute of Fisheries38 have said that variations in shrimp catches could be determined by factors such as rainfall and runoff river which can jointly modify the species´ biological cycle as well as their migratory patterns, affecting catch volumes of this resource. The largest catches take place in March, September and October. These last two months correspond to the end of the rainy season, and shrimp capture in these months is due to a decrease in salinity. De la Lanza and García-Calderón39 say that this factor is determinant in growth: lower salinity increases growth. Based on this, it would be expected that the tendency to increased loads would correspond to years with intense rainfall, but this has not been the case as loads have remained constant or slightly smaller. Another factor regulating salinity is runoff from the four rivers that contribute fresh water to the lagoon system; today, runoff from these rivers has decreased, so larger shrimp catches are not justified. During the rainy season of 1971, the highest salinity measurement was 0 to 13 ups15 in 2006 it was 21 to 38 ups37 The increase in salinity by 25 units in a 35 year period has changed the environment from oligahaline to polyhaline, with negative consequences to the shrimp industry; Gracia and Le Reste.40
These authors suggest that shrimp distribution is affected by rainfall and river discharges, factors that are directly linked to the salinity of the estuarine systems. Natural factors like tropical cyclones also influence salinity. According to the National Meteorological Service,41 three tropical storms and seven different category hurricanes, plus the recent marine intrusion, have increased salinity, reducing the size of shrimp catch, all in a 36 year period (1970-2006).
Up to 2017 there were 457 shrimp farms in five municipalities covering 4,099 ha. San Francisco and Bejuco rivers. 80% of the water from the Bejuco River was used for irrigation purposes (National Institute of Fisheries, 1994). The ponds have been abandoned and some are badly working, increasing the risk of water erosion and vulnerability when facing global and regional hydro-climatic changes that affect the mangrove community and the habitats of commercially and ecologically important organisms. All of this is the result of an inadequate management of the coastal zone, its rivers and tributaries.
El Niño and La Niña
In order to calculate the intensity trend between the El Niño and La Niña years, we plotted the mean intensity of MEI (Multivariate ENSO Index) of those years with periods longer than six months (Figure 11 & 13). El Niño conditions prevailed during a 34 year period (1951-2006), with a tendency to increased intensity (Figure 11). The strongest El Niño events happened in 1980 (1983, 1987, 1992, 1993 and 1997) which explains the tendencies to decreased rainfall measured by the Huajicori, Acaponeta, Huajicori, Rosa Morada and Mezcaltitán stations, since certain El Niño summers may correspond to below-normal rainfall.34 This would also be reflected in the tendencies to runoff decrease. Magaña et al.34 mention that precipitation deficits occur during El Niño summers, decrease in rainfall is noticeable and, therefore, water runoff from rivers also decrease.
Figure 11 El Niño years with higher frequency and intensity (based on the Multivariate ENSO Index (MEI) and perceptible on coasts of Nayarit with regards to the La Niña phenomenon (Figure 12), there was no clear trend of its intensity and frequency however, MEI years with high negative values were recorded, and considered La Niña high intensity years (1955, 1956, 1971, 1974 and 1975) with annual duration. These years did not show changes in rainfall intensity.
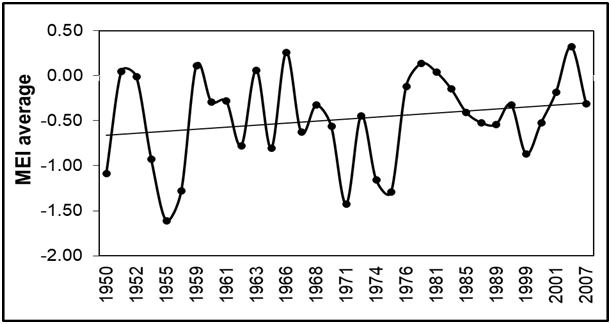
Figure 12 La Niña years with more perceptible frequency and intensity in Nayarit coasts based on MEI.
Figure 12 La Niña years with more perceptible frequency and intensity in Nayarit coasts (based on MEI). In order to estimate the monthly variation in intensity of the El Niño and La Niña phenomena, we plotted the monthly averages of those years with six or more months of El Niño or La Niña conditions during a period of 34 and 29 years of recorded MEI, respectively (Figure 13). Both phenomena had a tendency to an intensity increase. In the El Niño years (more positive MEI), the highest peak occurred from May to August (summer), which could explain the decrease or increase in rainfall during the wet months. According to Xu et al.,42 variations in rainfall correspond to the periods of El Niño and La Niña events. Similarly, Badan43 reports that El Niño, while increasing rainfall in northern states, reduces it in the rest of the country. During the years with more than six months, and even up to near 4 years, of La Niña conditions (more negative index), the increase in intensity was constant, with a highest in July (Figure 13). While the El Niño has increased for several consecutive years (1992-1995), La Niña has decreased, reducing rainfall (for example 1974-1975, highest number of years) and, as a consequence, a decrease in runoff. All of this points to a warming trend. De La Lanza-Espino28 mentions a similar behavior during intense El Niño episodes that lasted more than two years in which there was a marked decrease in precipitation during the first year but a strong increase during the second.
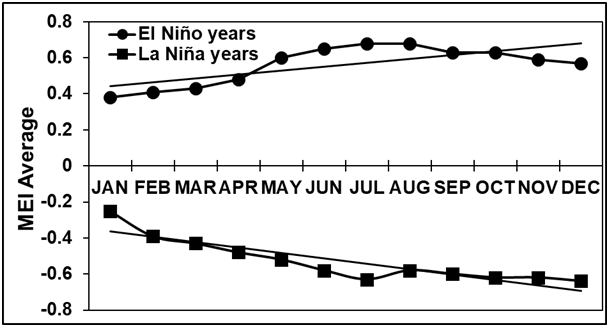
Figure 13 Average monthly El Niño (A) and La Niña (B) over a 57-year period (based on http://www.cdc.noaa.gov/people/klaus.wolter/MEI/mei.html).
Both the El Niño and La Niña phenomena can directly or indirectly influence the frequency and intensity of meteors such as tropical storms and hurricanes. The Teacapán Agua Brava lagoon system is part of the Central Pacific region (Nayarit and Jalisco), an area affected by tropical storms and hurricanes mainly from May to October with a higher incidence in September. Some of these disturbances run parallel to the coasts of the Mexican Tropical Pacific, while others go further in and modify rainfall and river conditions.17 During El Niño and La Niña years considered to be strong (Figure 15 & 16) there were a total of 83 and 74 hurricanes respectively at ocean level. From 1982 to 1983, and 1992 to 1993, El Niño increased the number of category four hurricanes; during the last period, we had one of the longest El Niño events, which allowed the warm water to remain like that for a longer period of time thus increasing the frequency and intensity of hurricanes Gallegos-García et al.44 and Magaña et al.34 suggest that this warm water anomaly during El Niño years reaches the Mexican coasts, which might be the reason why hurricanes intensity in this region increases, although on average, they remain further away from the Mexican coasts. The impact of hurricanes on the Pacific have become more frequent on coastal areas northeast of the country in places like southern Sinaloa (near to Nayarit), and their effects can be felt in the area of Tecapán-Agua Brava and Marismas Nacionales. Jáuregui45 mentions that during a 50 year period, the hurricanes that hit the Pacific coasts increased in number during the last decade; although the author does not state the causes for this increase, it might be possible it is explained by the eight years of El Niño conditions that prevailed during the 90's. In the years considered as intense LA Niña (Figure 14 & 15), category one hurricanes predominated, possibly because the ocean temperatures tended to be low, which did not allow an increase in the intensity of the hurricanes as seen during the El Niño years. It would be expected that an increase in hurricanes would be reflected in increased rainfall, but this has not been the case, as hurricanes have developed further away from Mexican coasts, and the cloud fields generated by the cyclone do not reach the mountain slopes, only the areas near the coast, as seen in the Palmar de Cuautla station, with a tendency to increased precipitation. Pavia27 mentions that rainfall may not be directly associated with cyclone intensity or with the location of its eye or its duration, but rather with the cloud field it creates, as it may rain before or after the cyclone. Rainfall, on the other hand, is associated with the monsoon effect.
Mexico´s geographical location makes it one of the countries exposed to the effects of the El Niño phenomenon, seen on coasts of the Pacific.43 In general, these effects can directly or indirectly influence the amount of rain that falls on the study area and, therefore, affect the biological and ecological processes of this area, including the mangrove cover and the capture of commercially important species like shrimp. These impacts may have short or long term consequences.
More than four large basins constitute the Teacapán-Agua Brava lagoon system. Runoff from these rivers has decreased as a result of hydro-climatology and changes in land use which affect the environmental framework. The decrease has been heterogeneous, mostly from the Acaponeta River which contributed80% of its water to the Agua Brava lagoon system.
Human activities such as agriculture on the margins of the central and lower sections of these rivers have caused the loss of natural vegetation, which can magnify the effects of the less runoff into the lagoon system. Meteorological events happen on a local, seasonal and eventual scale: monsoon rains, tropical cyclones and the El Niño and La Niña phenomena, are increasingly changing from year to year, affecting the patterns and amount of precipitation and runoff which are decreasing by 3 and 5.7%. Mangrove cover has also suffered major losses due to felling and changes in the lagoon´s hydrodynamics, which include the construction of canals that had favored fishing and now aquaculture activities with no consideration to changes in morphology and silting. The large canal (Cuautla) has increased salinization and destroyed large mangrove areas.
The present authors are gratefulness to Felipe Villegas for make the map.
None.

©2017 Espino, et al. This is an open access article distributed under the terms of the, which permits unrestricted use, distribution, and build upon your work non-commercially.