Journal of
eISSN: 2378-3184


Opinion Volume 7 Issue 2
Baltic Nest Institute Stockholm University Baltic Sea Centre Sweden
Correspondence: Oleg P Savchuk Baltic Nest Institute Stockholm University Baltic Sea Centre Sweden
Received: March 22, 2018 | Published: March 29, 2018
Citation: Savchuk OP. Myths of the Baltic Sea eutrophication. J Aquac Mar Biol. 2018;7(2):92–93. DOI: 10.15406/jamb.2018.07.00190
The applied science cycle, from description of the phenomenon to cause-effect explanations to scenario modelling to managerial recommendations, can be distorted at any of these stages, especially when natural scientists are wandering too far away from their “ivory towers” into socio-economic and political considerations. Although studies of the Baltic Sea eutrophication have matured on the path through the entire cycle from concerns of the early 1970s to the Baltic Sea Action Plan (BSAP) of nowadays, there are still some confusions and misinterpretations that can misdirect future studies and mitigation measures. The following gentle reminders and warnings are illustrated with and supported by results derived from both empirical data1 and mathematical models.2,3
There are several inherent properties of the Baltic Region that must always be accounted for in studies and management: natural and anthropogenic North-South and East-West gradients in the drainage basin and marine ecosystems, including limiting nutrients and productivity; compensatory potential of the interconnectivity between the Baltic Sea sub-basins; coastal-offshore interactions with its filtering and transforming capacity, depending on local morphometry; long nutrient residence times and high buffer capacity, determining slow response to the best efforts (Figure 1). Ignorant neglects or intentional disregards of these properties make management inefficient or even harmful.
Inorganic nitrogen removal due to denitrification and release of accumulated phosphate from the anoxic bottoms result in the Redfield excess of inorganic phosphorus that forces dinitrogen into biotic cycling via nitrogen-fixing cyanobacteria, thus increasing primary production, sedimentation and decomposition of organic matter, which, in turn, leads to further expansion of hypoxic zone with increased denitrification and DIP release (Figure 2). Shrinking of hypoxic zone after sporadic Major Baltic Inflows of saline oxygen-replete waters causes opposite changes in the N and P pools, but nowadays the improved oxygen conditions do not last long. Besides of such harmful cyanobacteria bloom effects as recreational deterioration and toxicity, this vicious circle4 counteracts nitrogen load reductions by nitrogen fixation and damages cod reproduction by expanding hypoxia.
Objective societal demands and subjective fashion trends result in a blooming development of indicators of variable composition, combining together data and perceptions from variety of disciplines. The evident traps waylaying implementation of this approach include a) uncertainty and subjectivity in prescription of both reference conditions and acceptable deviations, b) inclusion of regionally and locally unimportant indicators for the sake of unification, and c) spatial and temporal inhomogeneity ignored by integrated assessments (Figure 3).
While developing the Baltic Health Index, it is important to avoid some pitfalls of the Ocean Health Index, from a replacement of the “healthy ecosystem” concept as capability to maintain ecosystem’s natural structure and function against pressures5 with anthropocentric concept of sustaining benefits from ecosystem goods, services, and stewardships; to mixing together both interrelated (non-independent) and sometimes geographically irrelevant indicators.

Figure 3 Integrated assessment of the Baltic Sea eutrophication, combining 621 individual classifications.8 Proper.
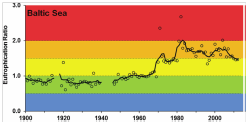
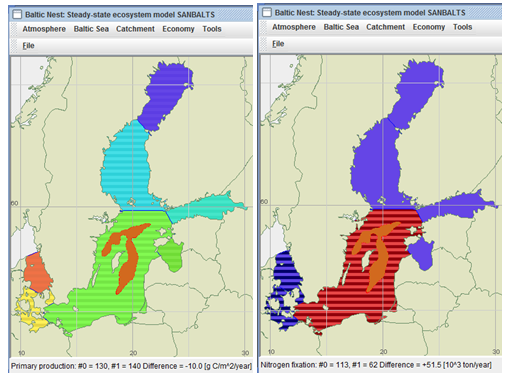
Then politics beats science. A few recent Baltic examples include: demand for simultaneous reduction of both N and P land loads in BSAP (Figure 4); HELCOM’s intention to achieve a Good Environmental Status for the Baltic Sea by 2020/216 but see Figure 5 for time scales, disregard of nutrient exchange with the Baltic Sea and Skagerrak in the Danish Action Plans for the Aquatic Environment that delayed improvement in open waters of the Danish Straits and Kattegat, comparing to expectations.

Figure 4Differences in primary production (A, g C m-2 yr-1) and nitrogen fixation (B, 103 t N yr-1) in the Baltic Sea sub-basins between scenarios with both N and P reductions (#0) and only P reductions (#1), amount of reduction corresponds to BSAP. Comparing to case #0, in case #1 primary production is slightly higher (140 instead of 130 g C m-2 yr-1) but nitrogen fixation is substantially less (62 instead of 113 103 t N yr-1).
The authors declare no conflict of interests.
A few questions could be arisen from above considerations as a contribution to ongoing studies and discussions:
The Baltic Nest Institute is supported by the Swedish Agency for Marine and Water Management through their grant 1:11 - Measures for marine and water environment".
Author declares that there is no conflict of interest
None.

©2018 Savchuk. This is an open access article distributed under the terms of the, which permits unrestricted use, distribution, and build upon your work non-commercially.