Journal of
eISSN: 2378-3184


Research Article Volume 10 Issue 5
Durrell Institute for Conservation and Ecology, University of Kent, United Kingdom
Correspondence: Simon A Black, Durrell Institute for Conservation and Ecology, University of Kent, Canterbury, United Kingdom
Received: November 29, 2021 | Published: December 24, 2021
Citation: Scott LA, Leslie SC, Black SA. Differing impact effects of extreme red tide algal blooms on mortality of Florida manatees. J Aquac Mar Biol. 2021;10(5):237-242. DOI: 10.15406/jamb.2021.10.00327
A significant cause of mortality in the endangered Florida Manatee (Trichechus manatus latirostris) is toxicity from the proliferation of aquatic algae Karenia brevis, known as Red Tide. Whilst several factors drive these so-called ‘Red Tide blooms’, the reasons for subsequent mass mortalities in manatees are not fully understood. We conducted a longitudinal analysis of existing case-by-case records of Red Tide effects on manatee mortality in coastal waters, estuaries and inland waterways of Florida, USA. We identify types of mortality events, some of which show predictability in location, seasonality, duration and impact on manatee mortality. Suggestions for monitoring and mitigation to reduce Red Tide impacts on manatees, from understanding predictable and exceptional instances of Red Tide algal blooms are provided.
Keywords: systems behaviour chart, variation, sirenian, algae, toxin
The Florida manatee (Trichechus manatus latirostris) is a sirenian that inhabits coastal waters, estuaries, and waterways of the southwestern United States and the Caribbean.1 In Florida it faces threat from human disturbance in the form of watercraft collisions, entrapment in floodgates and canal locks.2 In recent decades, ecological disturbance from Red Tide algae blooms of Karenia brevis (a microscopic alga that produces harmful brevetoxins) have become a threat, coating the seagrasses which manatees ingest.3
Manatee mortality data in Florida has been routinely collated and made publicly available since 1974.3 The Red Tide phenomenon was first noted in 1996, when an initially unexplained mass manatee mortality event ceased after an algal bloom dissipated.4 Algal brevetoxins disturb a manatee’s central nervous system, causing the animal to spasm, paralyse and drown.5 The general health of an individual manatee (immune function, fitness, and nutritional condition) affects vulnerability to these toxins.6-8
The fatality risk from Red Tide upon manatees depends on the spatial and temporal extent of the bloom.5 Previous studies identified Red Tide blooms as geographically more common, prominent and severe in southwest Florida.7 Specific hotspots for manatee exposure in southwest Florida are at the mouth of the Caloosahatchee River, Sarasota and Lemon Bays, and the Sanibel and Marco Island areas. This study analyses records of manatee mortality attributed to Red Tide algal blooms to identify whether:
Whilst methods are available to predict occurrence of algal blooms9 these approaches are either relatively operationally intense (e.g. observational surveys), technologically demanding, or analytically complex. Instead, we use existing data and accessible analytical methods to seek conservation management insights to the problem.
Manatee mortality records relating to Red Tide are publicly available from the Fish and Wildlife Research Institute (FWRI) for the years 1996-2019 (note: no data published for 1998 and 2010). The dataset differentiates these counts into three categories: Red Tide Positive, Red Tide Suspect and Red Tide Total (note: in 2019 both “Suspect” and “Possible” are grouped together). From 1996 to 2000 qualitative assessments of red tide death were conducted, after which definitive diagnosis was possible. Therefore, this study focuses on data from 2001, including only Red Tide Positive in the analysis.
The dataset was examined using System Behaviour Chart methodology.10-12 This method calculates the natural limits, which are derived from the moving range (XmR) in the data set. Limits in these charts are considered more sensitive to signals in heterogeneous data sets, as encountered in open environmental systems.2,13
In XmR charts, the data is organized longitudinally (e.g. daily, weekly, monthly or by incident in order) with data points plotted alongside the mean (represented as a Centre Line = x̄). The charts display the data set relative to empirically derived statistical limits which express the outer boundary of variation in the data. Any data showing specific patterns relative to the limits and/or mean, suggests a signal worthy of further investigation.13 The FWRI dataset for 1996-2019 was used to calculate the mean (x̄), moving ranges (R) and the natural limits for the data.
The XmR method involves plotting two charts, the X chart of data points and the mR chart of moving range for those data points. Limits are derived using a two-point moving range between adjacent data points and calculated from the mean of those moving ranges (mR).
The X chart Upper Natural Limit is plotted at = x̄+2.66(mR) and Lower Natural Limit = x̄ - 2.66(mR), where it is greater than 0.
A moving range (mR) chart is often presented alongside the X chart to show moving ranges between data points with a single limit calculated as Upper Range Limit = 3.27(mR).
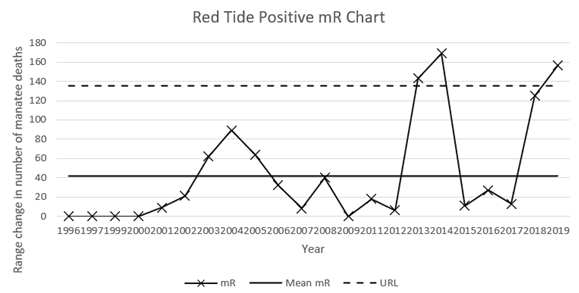
Eleven signals were identified in the Red Tide Positive X charts (derived from the manatee mortality dataset spanning 1974 to 2019). Most signals were months that exceeded the Upper Natural Limit of the data, namely March-April 2002, March-April 2003, March 2005, March-April 2007, December 2011, February 2012, March 2017 (See Figure 1). Two different systems occurred on other occasions, namely in Feb-March 2013 when two data points lifted above the natural limit, and from August 2018 through to February 2019, when data rose to a level remaining within the limit, then dropped over a sequence of seven counts to a new level. In 2013, Red Tide accounted for 33.3% of total manatee deaths. In 2018, Red Tide accounted for 35% of total manatee deaths, so a similar proportion of deaths, although very different systems of effect. The mR chart also identifies an anomalous event in 2014 (Figure 2).


Figure 2 Moving range (mR) chart of annual Red Tide Positive mortalities in Florida manatees (1996-2019) including Mean mR and Upper Range Limit (URL) calculated: as x̄+2.66(mR).
Single data points lying outside the upper natural limit (UNL)
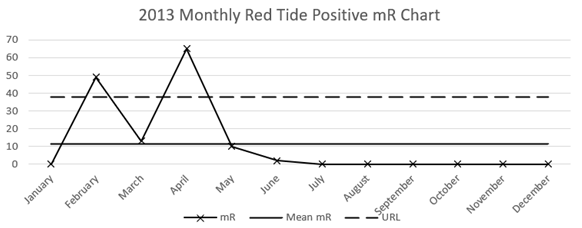
Monthly data reveals specific events, namely in February to March 2013, when the mortality rose dramatically above the natural limit and then fell to a steady state (on or near zero monthly Red Tide deaths) in May 2013 (Figure 1). This change in the system from ‘steady-state’ to ‘Red Tide’, back to ‘steady-state’ by May also appears in the mR chart (see Figure 3), thereby confirming the changes in the system.

Figure 3 Moving range (mR) chart of monthly Red Tide Positive mortalities in Florida manatees in 2013 including Mean mR, and Upper Range Limit calculated as: x̄+2.66(mR).
Data points within limits but displaying assignable signals
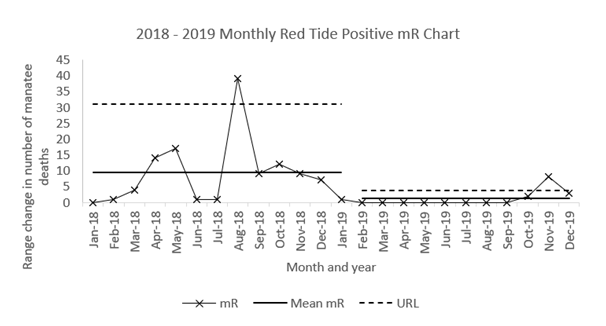
In 2018, a more complex situation arises in the data. In the X chart for 2018, there are no data points outside the natural limits (Figure 1). Thus, the system appears to be steady. However, the monthly decline in mortality from August through to December 2018 and into January and February 2019 shows seven points in a row (Figure 1). This decline is a clear indication of the system changing to reach a steady state of near zero deaths per month (i.e. a new system with consistently reduced mortality). The mR chart detects an additional peak in November 2018 (Figure 4). A new event only next occurs in November - December 2019 (Figure 4).

Figure 4 Moving range (mR) chart of monthly Red Tide Positive mortalities in Florida manatees (2018 -2019) including Mean mR and Upper Range Limit calculated using the formula: x̄+2.66(mR).
Location of hotspots of red tide mortality
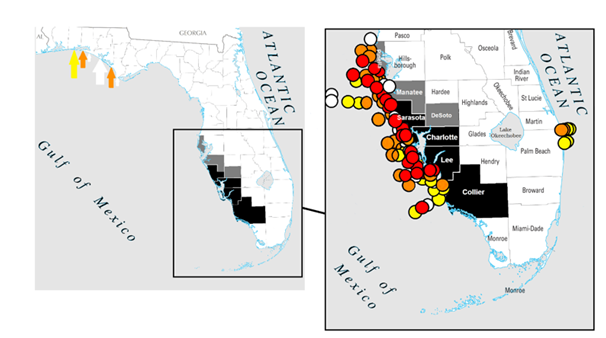
Eleven Red Tide hotspots were identified upon analysis of the data. Lee County is the dominant hotspot, with the bordering counties of Charlotte, Sarasota and Collier following (Table 1). Only three other occasional sites appear in a given Red Tide event; namely the adjacent counties of Pinellas, Manatee, and DeSoto (see also Figure 5).
|
|
Mar-Apr 2002 |
Mar-Apr 2003 |
Mar 2005 |
Mar-Apr 2007 |
Dec 2011 |
Feb 2012 |
Feb-Mar 2013 |
Dec 2016 |
Mar 2017 |
Aug 2018 |
Sept 2018 |
|
Lee |
9 |
31 |
15 |
30 |
16 |
10 |
116 |
4 |
5 |
25 |
13 |
|
Charlotte |
9 |
13 |
8 |
|
|
|
10 |
7 |
10 |
6 |
6 |
|
Sarasota |
7 |
12 |
10 |
|
|
|
8 |
1 |
9 |
22 |
15 |
|
Collier |
1 |
9 |
|
|
|
1 |
6 |
1 |
|
8 |
7 |
|
Pinellas |
1 |
|
|
|
|
|
|
|
1 |
|
3 |
|
Manatee |
|
|
1 |
|
|
|
|
|
3 |
7 |
5 |
|
DeSoto |
|
|
|
|
|
|
1 |
|
|
|
|
Table 1 Location (by county) of confirmed red tide manatee deaths in exceptional events as identified by Systems Behaviour Chart analysis of mortality data across the years 1996-2019

Figure 5 Florida, USA and (inset) the southwestern counties showing, in black, regular locations of Red Tide mortalities of manatees, and in dark grey occasional locations. Data points (right) indicate, the coastal locations in September 2019 identified with greater than normal background cell count (<1000 cells/litre) for K. brevis from Weisburg et al., (2019), where white=very low (>103 - 104 cells/litre), yellow= low (>104 - 105 cells/litre), orange=medium (>105 - 106 cells/litre). and red=high (>106 cells/litre). A small number of counts at these levels were on the northern gulf coast as indicated on the full state map (left) shown by arrows in the same colour scheme.
Understanding the impact of Red Tides on manatees, a particularly vulnerable species, is of growing importance since the frequency and intensity of algal blooms appear to be increasing.14 Agricultural runoff into water systems, particularly nitrogen accumulation in estuaries and coastal waters15 and phosphorus in freshwater lakes, reservoirs, and slow-flowing rivers16 stimulate algal blooms and subsequent toxic effects.9 Coastal waters are increasingly polluted by shipping, industrial discharges, and urban sewage effluents which alter the nutrient composition to favour algal blooms,16 whilst manmade infrastructure now dominates Florida’s wetlands and estuaries, eliminating natural filtration, so polluted water freely flows into rivers and lakes.17 Warm water discharges from powerplants also create conditions for algal blooms, and in colder months, manatees preferentially seek the same locations as thermal refuges18,19 which increases these mammals’ susceptibility to algal bloom toxicity.
Climatic shifts are predicted to affect increases in coastal upwelling in Florida’s west coast (where currents replace nutrient-depleted surface water with colder nutrient-rich water from below) to drive higher nutrient levels which benefit algae.20 Blue-green algae also favour higher water surface temperatures, while warm conditions also mix waters, accelerating Red Tide blooms.9 Hurricanes and tropical storms, which are predicted to increase in intensity and frequency under climate change,21 have an indirect effect by reducing the availability of seagrasses to manatees, compromising their health and increasing susceptibility to brevetoxins. Climate change models also predict variation in rainfall patterns22 offering a double-effect where wetter conditions increase agricultural run-off and aquatic nutrient loads on one hand,23 and at the other extreme under drier conditions decrease freshwater runoff, causing increases in salinity under which algae also thrive.
The study differentiates exceptional occurrences in levels of Red Tide mortality in manatees. These insights offer options for prioritising conservation action in order to conserve manatees, including at the very least as contingent action to reduce mortalities during Red Tide episodes.
Locations identified with signal peaks
In 2013, the largest proportion of manatee mortalities was recorded in Lee County, with 237 deaths from a 277 Red Tide Total. Furthermore, the Fort Myers area in Lee County accounted for 123 of the 237 mortalities in the County. In 2018, Lee County was again a key Red Tide location (130 out of the 288 Red Tide Total), though no specific areas were hotspots that year.
Population and population density: Lee County is a recognised manatee population hotspot with one of the largest manatee congregations in Florida.16 The greater population size will inevitably lead to a greater absolute number of deaths.
Patterns of Red Tide effects on other species: A study investigating the effect of Red Tide on sea turtles in Florida identified the south area of Sarasota, Charlotte, Lee, and the north half of Collier County as being the most frequently impacted by Red Tide blooms. Foley and colleagues’ (2019) findings are consistent with the Red Tide hotspots identified within this study, particularly the counties of Lee and Sarasota.
Periods in the year identified with signal peaks
March was the peak month of mortalities in 2013 (Figure 3), with 138 deaths out of 277 deaths recorded (66% of the 2013 Red Tide Total). The month of February followed, with 80 deaths recorded (28.8% of the 2013 Red Tide Total). In 2018, there is a different system with no standout month, but in August 68 mortalities were recorded (23.6%), and 60 in May (20.8%), out of the 288 Red Tide mortalities that year. The extended tail-off in mortalities in 2018 is important, as it shows a significant change in the system from August 2018 to February 2019.
The underlying causes of the 2018 event need to be understood. Whilst the total mortality of events in 2013 and 2018 are similar, the effect over time in each case is different. Each situation may offer insights into future management of Red Tide blooms. An arbitrary one-off event (as seen in 2013) that occurs within a short time span is difficult to mitigate, whereas a drawn-out impact (as seen from 2018 through to early 2019) could be managed to benefit manatees. If the mortality level in the chart does not fall below the UNL after one month, then an extended Red Tide effect (of the type observed in 2018-2019) can be considered likely.
There is evidence that seagrasses which decline and die off when overwhelmed by some algal bloom events are nevertheless able to recover fairly rapidly 24 and therefore be a replenished food source for manatees. However, there is evidence that Red Tide algal toxins persist on seagrass after a Red Tide event25 which may lead to a lag effect in manatee mortality (i.e. manatees ingest retained toxins when grazing seagrass). Future research into toxin retention on seagrass is recommended to better understand the toxic load and duration of retention on seagrass and the subsequent vulnerability of manatees to that threat.
Whilst many anthropogenic factors relating to the Red Tide phenomenon are beyond the control of wildlife managers, the impact on manatees remain significant and of conservation concern. Those anthropogenic factors which drive the occurrence of algal blooms, such as warm water discharge from power plants and industrial sites and agricultural run-off could be addressed through policy and regulation relating to power plant management and agriculture. However it is noted that policy and regulatory interventions are likely to require significant effort and time, aside from political influence, to be resolved. Furthermore, the wider climate change effects seen as likely to exacerbate the Red Tide phenomenon, and the required effort to reverse the situation, will require even longer-term and larger-scale efforts. That said the effect of any given Red Tide is real and present for manatees in the wild, so necessitates immediate action. Alternative conservation strategies which can be more speedily implemented would seem attractive
Conservation responses can be divided into two broad strategies: mitigation action (to eliminate threat or achieve long term beneficial outcome, by addressing root causes) and contingent action (to address threats at point of occurrence when they arise) the latter usually applied in the short term, and in some instances as a temporary fix.2 In light of the long term demands of addressing root causes of Red Tide, contingent actions for particular algal bloom occurrences could benefit manatees. For example when an early signal of mortality can be identified (such as a signal detected in a real-time XmR chart of manatee mortality), conservation managers can use such signals in the data to anticipate subsequent mortality impacts and make decisions on whether short-term interventions to protect manatees in a locality is beneficial, such as temporarily moving the animals (or selected individuals) out of contaminated waterways or even providing supplementary feeding.
More ambitious long-term contingency efforts (i.e. recognising that Red Tide will occur) could involve the translocation of non-natural congregations of manatees aggregating around particular ‘at risk’ sites to suitable, safer locations (i.e. areas with predictably less Red Tide effects). These more suitable areas should be selected where they have a lower current density of manatees, either within or outside of Florida. There are many coastal counties in Florida that are less affected by Red Tide (Figure 5), and climate change driven water-temperature rises may potentially enable manatees to inhabit these Red Tide free waters comfortably in the future.27
The manatee mortality data analysed within this study can also be used to investigate specific sources of agricultural runoff and municipal waste, which are driving increased Red Tide blooms and subsequent manatee mortalities in specific localities. Future assessments of these contaminant source areas, based on their obvious and exceptional negative impact through Red Tide effects (compared to other localities) could inform the necessary mitigation actions. At a very practical and feasible level, this could include targeted runoff reduction actions negotiated with farming communities and legislators, and containment measures and alternative treatment or disposal processes for waste management in specific localities.
We encourage conservation managers to consider how local manatee populations within specific, vulnerable regions could be actively managed at reasonable cost to reduce Red Tide deaths of this important species and for similar consideration to be given to other marine species threatened by Red Tide occurrences.
The author declares that there are no conflicts of interest.
None.
Acknowledgement is given to the Florida Fish and Wildlife Conservation Commission for the public provision of data.

©2021 Scott, et al. This is an open access article distributed under the terms of the, which permits unrestricted use, distribution, and build upon your work non-commercially.