Journal of
eISSN: 2378-3184


Research Article Volume 4 Issue 1
Jalan University, Malaysia
Correspondence: Sylvia Jagerroos, Jalan University, 50603 Kuala Lumpur, Wilayah Persekutuan Kuala Lumpur, Malaysia, Tel +60 176219671
Received: November 04, 2015 | Published: February 16, 2016
Citation: Jagerroos S (2016) Assessment of Living Resources in the Straits of Malacca, Malaysia: Case Study. J Aquac Mar Biol 4(1): 00070. DOI: 10.15406/jamb.2016.04.00070
The Straits of Malacca (henceforth referred to as the Strait) is the world's second busiest commercial shipping route. Malaysia shares 11,320 km2 of EEZ waters with Indonesia in the Strait. In terms of fishery productivity, this region (also known as the west coast of Peninsular Malaysia) yields one of the highest marine landings in Malaysia. The Strait contribution to the total marine landing of Malaysia in 2013 was 48%. Fisheries statistics for the year 2013 in the Strait showed that 82% of the landing comprised of finfish while the remaining 18% comprised primarily squid and prawns. The total value of marine resources in the Strait is estimated to be US $7,124 million, which consists of both market and non-market resources. The Malaysian commercial fisheries involved three main types of gear the trawl fish, the purse seine and the anchovy purse-seine. The traditional fisheries included shellfish collection and fishing with the use of other seines, drift gill nets, traps, hooks and lines, bag nets, barrier nets and push nets. Introduction of trawling in the 1960s increased fishery productivity tremendously. The Straits of Malacca was historically and still is a productive region for Malaysian marine capture fishery, with valuable demersal and pelagic resources of finfish and shellfish. In addition to contribution towards the national gross domestic product (GDP), the fishery sector also provides crucial employment and livelihood to a substantial number of coastal fishermen. However, a closer inspection of the fishery statistics coupled with data obtained from field survey indicated that the health of the fish stocks is declining considerably, particularly the demersal fishery resources.
Keywords:Finfish, Shellfish, Bait fishing, Catch, Fish Landing, Trawling, Statistics, Import, Export
The straits of Malacca (henceforth referred to as the strait) is the world's second busiest commercial shipping lane (after the dover straits in Britain) with an average of 200 ships passing through daily. At about 805km in length, the strait is the longest strait globally which is being used for international navigation. It varies in width from 17 to 322 km with irregular depths from less than 10m to over 70m. Tidal range varies with locality from 1.6 to 3.7m, with much higher ranges inshore. Port Klang, for example, experiences high water at spring tide up to 5m with the tidal stream attaining rates of over 4 knots. Prevalent surface currents in the Strait show flow north westward through the canter of the Strait. Data from trawl surveys show a gradual transition in bottom sediment type along the Strait from mud in the north to rocky and uneven ground in the south.1 Before discussing the coastal and marine fishery resources in the Strait, it would be helpful to understand some legal aspects governing the policies and management of fishery in Malaysia, as a whole. The federal government is accorded the jurisdictional powers over maritime and estuarine fisheries activities under the main legislation of the Fisheries Act 1985 (amended 1993). Regulation of the marine capture fishery activities are under the review of the Department of Fisheries (DOF) via a vessel licensing system.2 Licenses issued includes licenses for vessels and equipment for various zonation’s of the water bodies; i.e. Zones A (0 to 5 nautical miles), B and C (5 to 12 nautical miles), and C2 (30 nautical miles up to the exclusive economic zone (EEZ) boundary). There are also divisions of category of vessels that can operate within each zone (based on the gross registered tonnage (GRT) of the vessels). Vessels are allowed to fish in zones further than their assigned zones, but not in zones landward of their assigned zones. Hence forth in this document, boats assigned to zone A will simply be terms as boat type A, and so forth. Malaysia shares 11,320 km2 of EEZ waters with Indonesia in the Strait. In terms of fishery productivity, this region (also known as the west coast of Peninsular Malaysia) yields one of the highest marine landings in Malaysia. Nearly 70% of fishermen in Peninsular Malaysia are located in the Strait, with twice the number of fishing crafts in operation here relative to the east coast.3 Prior to 1990, over half of Malaysia’s total marine fish resources were landed from the Strait, with approximately 52 to 61% in contribution.4 In 1997, landings from the Strait made up about 44% of total marine catch in Malaysia, which is a decrease from more than 50% in contribution prior to 1990. The Strait contribution to the total marine landing of Malaysia in 2013 was 48% .5 During the 1990s, the landings from the Strait were identified to have exceeded the estimated maximum sustainable yield (MSY) which severely reduced the biomass of demersal species in the region.1 Landings in inshore areas (within 30 nm from the shoreline) in the Strait, and generally in Peninsular Malaysia, appeared to have stabilized since late 1990s and early 2000s; the resources likely have been exploited to or even exceeded to fullest potential .1 Nevertheless landings by weight in the Strait alone have continued to increase from 525,906t in 2005 to 729,558 t in 2009; total landing from the Strait in the year 2013 was 715,684t .5 Linkage between mangrove and fisheries production, particularly shrimp catches, are fairly well-known. This productive coupling could play a big role in accounting for the higher fishery production in the Strait, relative to the east coast of Peninsular Malaysia. Mangrove forests in Peninsular Malaysia have been estimated at around 90,041 ha located primarily off the sheltered west coast .6 The major areas include the Larut Matang mangroves in the state of Perak, the mangroves in Johor, and Klang in Selangor. These forests are believed to sustain more than 50% of its annual fishery landings. The main threat to mangroves in Malaysia stem from land conversion for agriculture, industry and aquaculture.
Data sources
For the purpose of this study, the bulk of the data originated from the Department of Fisheries Malaysia which is available from their public website (www.dof.gov.my) from 1959 to 2013. The relevant data are national fisheries landings that are available by species or species complex, states, months, and gear types. With the exception of some species, most data are not species-specific and are presented using local Malay names. Scientific names or classification of the species or species complex are available in a separate document. These data are captured in pdf documents by year and some amount of manipulation is required to extract them prior to analysis. Other pertinent information includes the number of registered vessels, number of fishermen, and prices of fish (ex-vessel, wholesale, retail) by year. Data with finer resolution such as the landings by sub-districts within each state may or may not be available on the public website. Written special requests to the relevant state Department of Fisheries would need to be made to obtain them.
Fin fish
In the Strait, the commercial or large-scale fisheries contributed 71% of landings (1997;1). In 1997, the major components of the landings were demersal fish (53%), followed by pelagic fish (29%). The fisheries statistics for 2013 in the Strait showed that 81.8% of the landings comprised of finfish, with 36% pelagic species and only 18.3% demersal species.5 The commercial fisheries involved three main types of gear: the trawl, the fish purse seine and the anchovy purse-seine. The traditional fisheries included shellfish collection and fishing with the use of other seines, drift gill nets, traps, hooks and lines, bag nets, barrier nets and push nets. Demersal fish resources were caught mainly by otter board trawlers, drift gillnets and push nets. Six main groups comprised the landings of small pelagic fishes in the Strait area namely:
These groups were fished mainly by purse seines. Other groups of small pelagic fish were pomfrets (Pampus spp. and Formio spp.), spanish mackerels (Scomberomorus spp.), threadfins (Eleutheronema spp., Polydactylus spp.), wolf herrings (Chirocentrus spp.) and queen fishes (Scomberoides spp.). Pelagic fishery in the Strait is the most developed fishery in the country.1 and were landed mainly by trawls and drift nets. Some of these pelagic fish resources are considered as transboundary fishery resources that migrate among adjacent water bodies of Indonesia and Thailand that border the Strait, along with Malaysia. Key migratory species in the Strait area are the mackerels (Rastrelliger spp.) and scads (Decapterus spp.).
Shellfish & other
The Strait and Sarawak are the main fishing grounds for prawn. In 1997, the non-fish marine landings comprised of 5% squid and 13% prawn. Analysis of catch and effort data in the Strait estimated a potential yield of about 70,400t at standard effort of about 64,600 units, although explanation on the standardization of effort was not provided by the authors.1 Landings in 1996 were about 65,000t using 102 600 standard units of effort, indicating that the resource had already been over-exploited. Recent statistics for the Strait showed that non-fish resources comprised 18% of total landings.5 The main species of prawns in this area are from the genera Penaeus, Metapenaeus, Metapenaeopsis, Parapenaeopsis, Trachypenaeus and Solenocera. Changes in species composition were observed from both on board and fish landing surveys since 1990s.1 Squid has emerged as the most dominant species. As traditional fisheries resources are being fully exploited, ‘new’ fisheries targeting squid, cuttlefish and jellyfish have emerged. Landings of squid and cuttlefish in Peninsular Malaysia contributed 5% to 7% of marine landings in 1997; this contribution remained fairly constant based on recent statistics in 2013. Sea cucumber catches have ceased to be recorded in the annual Malaysian fishery statistics since 1993. Historically, sea cucumber fishery in the Strait was artisanal and confined to a few localities such as Pulau Pangkor .7
Economic value
Fisheries products derived from mangrove areas in the Strait are valued at US $358 from Malaysia (and US $168 million from Indonesia). The total value of marine resources in the Strait is estimated to be US$7,124 million, which consists of both market and non-market resources 8
Issues relevant to fisheries
Assessment of the current fisheries state suggests serious stock degradation and overfishing.9 Notably, retail fish prices have risen dramatically over the last 30 years. Without serious intervention, economic imperative and pressing food and job security issues will solely drive the fishery agenda with little regard for long term conservation of the already depleted fishery resources. Malacca Strait is an important shipping lane, and therefore it is of no surprise that the concentration of heavy metals and hydrocarbon were reportedly higher in the Strait relative to other areas. This is also due to extensive land use and industrialization in the Strait area, especially in Port Klang 1 Studies examining fish tissue samples collected from the coastal waters showed high levels of heavy metals in 1 and dioxins and furans .10 However, the resulting analyses indicated that current levels of heavy metals and hydrocarbons found in the fish and shellfish do not pose a major threat to public health. Siltation is another ongoing major problem in Malaysian coastal waters.1 particularly in the relatively more developed west coast of Malaysia. Intensive land clearing, uncontrolled development, mining and logging in the catchments are likely culprits for increased siltation. In addition, effluents from palm oil and rubber processing, which contain very high concentrations of organic material, suspended solids and nutrients (like nitrogen and phosphorus), also end up in coastal waters. Siltation is linked to decreased water quality that can affect the health of fish and shellfish, particularly those that undergo their early life history developments in the shallow coastal areas. Although not directly problematic to fish stocks, two other challenges in the Strait should be highlighted due to their impacts on the livelihood and safety of fishermen. Piracy has been a problem in the Strait since the 1990s, with recorded 25 attacks on vessels in 1994, 220 in 2000, and just over 150 in 2003. Subsequent reduction of pirate attacks after 2004 was attributable to increased patrolling of regional navies in the Strait. Certain areas that are narrow and shallow in the Strait also have led to shipwreck events, although their occurrences are infrequent.
Government policies in fisheries management
Historically, the fishing industry in Malaysia has been subsistence-based, with use of traditional gears such as traps and fishing stakes. Landings in the Strait alone were recorded to be a mere 50,000 t back in 1949. Given the low fishing effort and efficiency, the method of management using input (effort) control via licensing of gears was deemed to be sufficient.11 The enactment of the Fishery Act of 1963 further strengthened the control of fishing effort. Introduction of trawling in the 1960s quickly changed the dynamics of the local fishing industry as well as the fishery management approach. In addition to high efficiency and productivity in commercial catch, other issues such as encroachment of trawlers into shallow, coastal areas, where passive gears are in operation, became focal points for fishery management.11 One solution was to equip traditional fishermen with mechanized boats and via zoning which limited fishing areas for trawl operators. By 1997, 97% of the total number fishing vessels in the Strait constituted powered vessels. However, the effects of intensive trawling in the Straits were felt by the mid-80s. Catches were dwindling and fish stocks were believed to have been over-exploited for some years by that time. While the neighboring Indonesia took to banning of trawling, Malaysia utilized other means to manage the problems such as construction of artificial reefs, establishment of marine parks, increased research and development and offerings of off-shore fishing licenses.11 Attempts on joint assessment of these sources in the Strait by both countries were conducted back in 1976 and in 1985; however these did not result in any form of co-management of the shared resources.12 The Department of Fisheries also introduced a comprehensive licensing policy with a moratorium of licenses. One of the important tools to assist in fishery management is the Monitoring, Control and Surveillance (MCS) system, which is considered to be one of the sophisticated of its kind in the Asian region. The system includes collection of data, licensing, enforcement, and training .11 Other indirect initiatives to reduce excess fishing capacity include support for new industries such as coastal aquaculture and fish processing. A subsidy programme was initiated in June 1008 to boost the Malaysian fishing industry. The local fishermen association manages catch and fuel subsidy while the Fisheries Development Authority of Malaysia.13 administers the livelihood subsidy. Based on data from the start of the programme up till 2011, the largest proportion of the subsidy amount spent went to fuel (diesel) subsidies (79%), followed by livelihood (13%) and catch subsidies (8%). Impact analysis of the programme suggested that despite cheaper fuel and catch incentives, fisheries productivity did not appear to increase accordingly.9
The state of Selangor is reported to have total marine landings of 171,136,797 kg, forming 10% of total national landings.13 This makes Selangor one of the top marine fishery producers in Malaysia. Based on the 2013 fisheries statistics, Selangor ranked 4th by weight (kg) and 6th by market value (RM 258,679,785) in Malaysia (Figure 1). Administratively, the state of Selangor is organized into 4 districts for managing landing statistics. Sabak Bernamis the top district with landings of 1,60,002 kg (47% of total landings), followed by Kuala Selangor (84228.25 kg; 25%), Klang (76368.64 kg, 23%) and Kuala Langat/Sepang (13708.65 kg; 4%) (Figure 2)
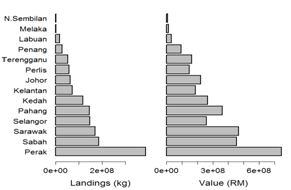
Figure 1 Total Marine Landings for Each State in the Year 2013 by Weight (kg) and Value (RM). Source: LKIM (2013).
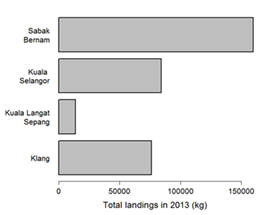
Figure 2 Total Marine Landings for Fishing Districts in Selangor in the Year 2013 by Source: DOF (2013).
Finfish
Fisheries statistics for the year 2013 reported landings of finfish from 41 families, which comprised 72 major groups of species or species complexes (similar species for management reasons), which included the category of ‘mixed’ fishes .5 These also included landings of sharks and rays, which are not finfish technically. In total, landings of the fish category totalled 72660 tonnes (69% of total marine landing by weight) in the year 2013. In terms of landings by weight, the highest contributor was the Sumatra barb, which is loosely categorized as trash fish (46%). This was followed by two different species of Indian mackerel (Rastrelliger spp.), which contributed 11% and 7% respectively to the marine landings. The other important species by weight were the jewfish (4%), ‘mixed’ fish (3%), Spanish mackerel (3%), shad (2.9%), hardtail scad (2.6%), marine catfish (2.5%) and rays (1.4%) (Figure 3). Based on the classification of fish provided by Department of Fisheries.5 approximately 21% of fish landed in Selangor are pelagic fish and 12.5% are demersal fish. Specific pricing information for Selangor alone was not available at the time of writing this report. However, data from the national fisheries statistics for average ex-vessel prices of fish (RM/kg) for the year 2013 were higher for Peninsula Malaysia than when considering the nationwide prices (Figure 4). This indicated fishermen of Sabah and Sarawak get lower prices for the same species of fish than those in the Peninsula. The most valuable species by far was the Chinese pomfret, fetching an average price of RM50 per kg. Two fish species commanding prices exceeding RM30/kg were the threadfin and the silver pomfret. Other valuable species that were similar in prices per kg (approximately RM20/kg or more) were the mangrove snapper, grouper, pompano, mangrove red snapper, black pomfret, Spanish mackerel and longtail shad.
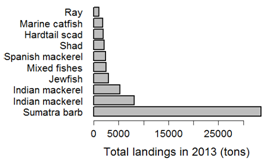
Figure 3 Total Marine Landings for Fishing Districts in Selangor in the Year 2013 by Source: DOF (2013).
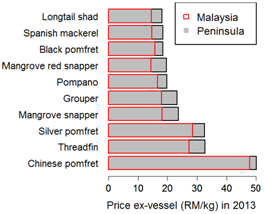
Figure 4 Average Price ex-Vessels for the Top 10 Fish Species in the Year 2013. (RM/kg) for Both Peninsula Malaysia and for the Country Malaysia. Source: DOF (2013).
When compared to the top species by landings (Figures 3 & 4), the only common valuable species was the Spanish mackerel. Landings for the other valuable species comprised less than 0.5% by weight for individual species. This suggested that a large bulk of the Selangor landings by weight was not of high market value, based on the ex-vessel prices.
Shell fish & others
Fisheries statistics for the year 2013 reported landings of non-fish (invertebrates) or shellfish (prawns, crabs, octopus, squids, gastropods, lobsters, mantis shrimps) from 14 families, which comprised 32 major groups of species or species complexes (similar species for management reasons).5 It should be mentioned that jellyfish was included in this category. In total, landings of this category totalled 32,900 tonnes (31% of total marine landing by weight) in the year 2013. In terms of landings by weight, the highest contributor was the small, sergestid shrimp, which is the main ingredient for making the local delicacy of “belacan” (53%). This was followed by mantis shrimp (11.7%), squids (6%), cuttlefish (5%), white or Indian prawns of three size categories (large, medium, small) (4.4%, 2.9% and 2.7% respectively), king prawn (2.4%), mud crab (2.4%) and edible clams, also known locally as lala (1.3%) (Figure 5). As mentioned earlier, specific pricing information for Selangor alone was not available. With the exception of a few species, average ex-vessel prices of non-fish resources (RM/kg) for the year 2013 were similar between Peninsula Malaysia and the whole of Malaysia (Figure 6). The most valuable shellfish species was the spiny lobster, fetching an average price of RM45 per kg. This was followed by five groups of prawns of the family Penaeidae, commanding prices between RM18 to 36/kg; these were the giant or green tiger prawn, white or Indian prawn (L and M sizes), and king prawn. Other valuable species fetching prices per kg between RM 15.5 to RM17.9 were the mangrove or mud crab, slipper lobster, sand prawn and mud crab (different species). When compared to the top species by landings (Figures 5 & 6), many of the valuable species were also generally high in landings. This seemed to suggest that the state of Selangor fisheries for non-fish resources may be in better shape relative to fish resources.
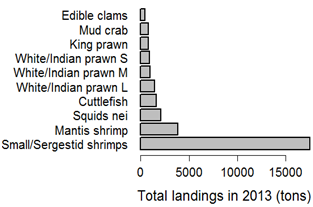
Figure 5 Total Marine Landings of the Top 10 Shellfish Species in Selangor in the Year 2013 Weight (tons). L – Large, M – medium, S – Small. Source: DOF (2013).
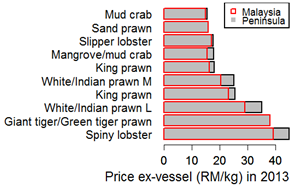
Figure 6 Average Price Ex-Vessel for the Top 10 Shellfish Species in, 2013 (RM/kg) for Both Peninsula Malaysia and for the Country Malaysia. L – Large, M-Medium. Source: DOF (2013).
Average Price Ex-Vessel for the Top 10 Shellfish Species in the Year 2013 (RM/kg) for Both Peninsula Malaysia and for the Whole Malaysia. L - Large, M – Medium.5
Fishing gears
Based on the Selangor statistics of fishermen working on licensed fishing vessels by fishing gears, the most popular gear would be the drift or gill nets (66%), followed by trawl nets (23%) and fish purse seines (6%).5 Landings by weight in Selangor in 2013 were the highest by using trawl nets (71,502 t, 67.7%), followed by drift or gill nets (20,122 t, 19%) and fish purse seines (8,775 t, 8%). Other less commonly used gears include bag nets, hook and lines and portable traps “(bubu)”.
Methodology
A short term study was conducted for this study to obtain a baseline understanding of the fishery resources and fishermen livelihood in the Selangor area, with a focus on the Klang fishery district. An initial site survey was carried out to assess the number of landing sites in the study area, which is in Port Klang and the neighbouring vicinities. Field surveys were conducted on three separate occasions during the months of November and December in the year 2014. Specifically, the field surveys were carried out on November 29, December 4, and 11, including two overnight trips. Locations of the sites were Kampung Kelanang, Pulau Indah, Pulau Ketam and neighbouring vicinities. The timing of the surveys coincided with the rainy Northeast Monsoon season (typically occurring from November to March). The field surveys comprised two components, which were interviews with fishermen and onsite measurement of landed fish resources. Both components were conducted opportunistically whenever possible – measurement of fish resources was not possible on one occasion due to lack of coincidence with landing events.
Fishermen were interviewed on a few key areas:
The overnight trips allowed more contact opportunities with fishermen who went out in the early hours before dawn as well as with landing events. Identification and measurement of fishery resources was made while the fishermen were processing and sorting their landings. Specifically, length and weight measurements were taken for all individual fish where possible, or sub-sampled otherwise. Specific details of each fishing trip were also noted, including fishing duration, gear used, and total landings (by weight). A written request was made to the Selangor Department of Fisheries for specific data necessary for this study. Due to delay in processing and obtaining data from the sub-districts, fishery data for the year 2014 was not fully available during the time of writing this report. Hence the data analysis presented will be based primarily on fishery data obtained during the year 2013.
Results -Summary of landing events
A total of 21 different landing events in 8 landing sites were encountered during the field surveys. Out of these landings, 5 were fished by boat type A, and 14 by boat type B. Boat type C was uncommon in the survey area; we were informed that most of the boats type C in Selangor were mainly in the Kuala Selangor district. Number of crew members fishing in boat type A ranged from 1 to 3, with a median of 2 people (Figure 7a, left). For boat type B, the number of people fishing ranged from 1 to 4, with a median of 4 people (Figure 7a, right). Total landings by weight for boats type A ranged from 20 to 1200 kg (median = 22 kg), while that for boats type B ranged from 50 to 500 kg (median = 240 kg) (Figure 7b). Notably the boat A with a total landing of 1200 kg specifically collected trash fish. Gears used while fishing with boat type A included the gill net, and long line, while the primary gears for boat type B were the fish and prawn trawl nets (Figure 7c). Duration of fishing trip by boats type A ranged from 4 to 12 hours (median = 11 hours), while boats type B fished slightly longer from 8 to 12 hours (median = 12 hours) (Figure 7d). Most of the boats fished in close proximity to the shore, less than 2 km away from shore or about 2 hours of boat ride away. For most of the boats sampled, their catches were sold to middlemen; one sold his catch to a fish factory while two others fished for personal consumption.

Figure 7 Summary Profile for Fishing Using Boats type A (sample size, n = 5) shown in Left Column (red) and Boats type B (n = 15) shown in Right Column (blue).
(a) Histogram of Number of People Involved in Fishing,
(b) Histogram of Total Weight if Landings (kg),
(c) Frequency of Gears Used for Obtaining the Landings, and
(d) Histogram of the Duration of Fishing Trip (hr).
Information Obtained Based on Survey of Landing Sites.
Summary of fishermen interviews
A total of 47 fishermen were interviewed, they were mainly located in Pulau Indah, Pulau Klang, Pulau Ketam and adjacent vicinities. Some of the information provided on the interview forms was not necessarily accurate or consistent with what the general ‘population’ of fishermen had reported; hence some omissions and editing were necessary to provide the most accurate picture possible in this report. Changes that were made or filtering conditions applied were noted where applicable.
Fishermen background profiles
91% of interviewees were boat owners. Fishing experience varies considerably, from 2 years to 50 years, with a mean of 24.7 years (Figure 8). 26% did not specify their boat types (‘Unknown’), 53% had the smaller type A boats (23 used fibre boats while only 2 used wooden boats), and 21% fished using boat type B (all 10 used wooden boats) (Figure 9). Mean number of fishing crew was 2 for boat type A and 3 for boat type B. It is likely that the ‘Unknown’ boat type was boat type A. Fishermen with boat B were dedicated full-time to fishing, while there were part-timers in fishing with boat type A (Figure 10). 31% of the fishermen (both part-timers and full-time fishermen) relied on additional sources of income, which included fish farming, contractor, and working on plantations. There did not appear to be a clear impetus for additional income based on size of household. Those relying on additional sources for income tended to fish less often per month (mean=13 days) than those who rely solely on fishing (mean = 15 days) (see Figure 11). Almost all reported good relationships with other fishermen; only one expressed strong dissatisfaction.
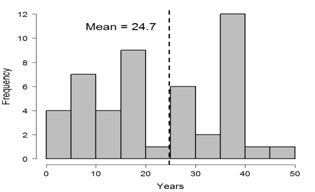
Figure 8 Fishing Experience of Fishermen (number of years). Information Obtained Based on Fishermen Interview (n = 47).
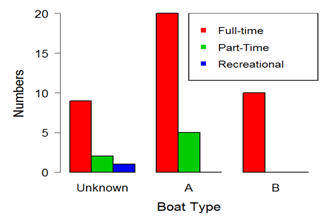
Figure 10 Fishing Status (Full time (F), Part time (P), Recreational (R)), Based on Fishermen Interview (n = 47).
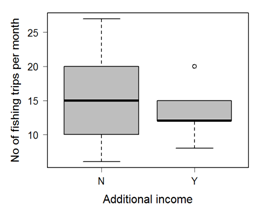
Figure 11 Mean Number of Fishing Trips per Month Based on whether Fishermen Rely on Non-Fishing Source for Additional Income or otherwise. Information Obtained Based on Fishermen Interview (n = 47).
Fishing gear and duration
Fishing gears varied considerably and depended on the type of boat used. The most common gear used in boat type A is the gill net (50%), followed by long line (16%) and drift net (12%). Mesh sizes for gill nets varied from 1 inch to 7 inches. Species targeted by gill nets were mainly pelagic and valued species, such as mackerel, pomfret, threadfin, seabass, wolf herring, and snapper. Other less valuable species caught with the gill nets were mullet, croakers, sting rays, and catfish. Duration of individual gill net fishing trip ranged widely from 2 to 12 hours (mean = 9 hours). A number of fishermen fishing with gill nets also used additional gears such as the long line and rod. Long line fishing displayed the highest variability in fishing duration, from 5 to 72 hours (mean = 20.5 hours). Target species with long line were similar to that caught with gill net. Drift net fishing can last from 10 to 24 hours (mean = 15 hours). Other gears used on boat type A included the 3-layer net and traps (locally known as ‘bumbu’). Boat type B utilised fish (20%) and prawn trawls (80%), with mesh sizes of about 1.5 and 1.75 inch. Fishing using these gears were typically about 12 hours. Boat type B tended to have shorter duration of fishing trips (mean = 11.6 hours per trip) than boat type B (mean = 17 hours per trip).
Boat characteristics
Most of the fishermen interviewed were not clear about the tonnage of their boats. Of those that do, the tonnage for unknown boat type was 3 GRT, while the tonnage for boats type B ranged considerably from 15 to 150 GRT (mean = 61.3 GRT, n = 6). However, information on the engine horsepower (hp) was more readily available. The unknown boat type has an average of 42.1 hp (n = 11), boat type B with an average of 32.2 hp (n = 23) and boat type A with an average of 193.8 (n = 8). Figure 12 shows the distribution of the engine horesepower by boat types.
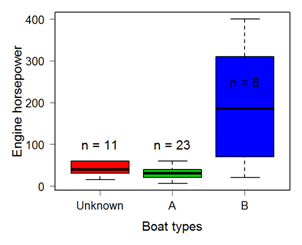
Figure 12 Boxplot of Engine Horsepower by Boat Types (sample size, n, shown). Information Obtained Based on Fishermen Interview (n = 47).
Fishing trips and bait practices
Average number of fishing trips per month appeared to be fairly consistent across all boat types, with an overall mean of 14 days per month and maximum of 27 days per month. Interestingly, fishermen who labelled themselves as part-timers (mean number of days per month = 12.4) fished almost as often as full-timers (mean = 14.7) although the frequency of fishing for full-timers vary greatly, from 6 to 27 days. 57% of the fishermen practices bait fishing; however none of the fishermen with boats type B do bait fishing. For those that require bait, the locations for obtaining baits were very close to the fishing sites, based on the reported distance of bait areas and fishing sites. None of the fishermen practice discarding any portion of their catches. This is unsurprising given that trash and ‘mixed’ fish catches also fetch some amount of income.
Travel time to fishing location
Fishermen of unknown boat type travel anywhere between 45mins to 3 hours or from 2 to 30 km offshore to fish. For boat type B, fishermen travel at least 30mins to about 2 hours to their fishing sites, which was similar to the amount of time taken for boats type A. Based on communications with some fishermen in Pulau Ketam, many prefer to fish in groups (with other fishermen), for safety reasons particularly during inclement weather. Landing sites were noted to be the same site as the village which the fishermen reside in.
Landing weight
Only full-time fishermen of unknown boat type reported a range of the weight of individual landings, which ranged from 0 to 40 kg. This implied that the fishermen of boat types A and B would typically fish till they reach a certain quota of landing by weight to justify costs of fishing. Reported mean individual landings varied considerably within boat type. Interestingly, full-time fishermen of unknown boat type reported lower mean for landings (mean = 21.7 kg) than part-timers (mean = 57.6 kg) or recreational fisherman(150 kg). This suggests that part-timers focused their fishing effort during peak fishing seasons. This was in contrast with fishermen of boats type B; full-timers reported higher mean (mean = 76.8 kg) with much greater variation in individual landings by weight than part-timers (mean = 27.6 kg). Fishermen of boats type A reported the highest mean individual landing (mean = 547 kg), with weight ranging from 70 to 4000 kg. Figure 13 & 14 showed the mean individual landing (kg) by boat types.More than 60% of fishermen sold their catches to middlemen, and only 19% fishermen directly sold their own catch without the use of middlemen. A small number caught fish only for personal consumption (6%) while about 13% fished for both personal consumption, as well as sold part of their catch for income. Fishermen of boats type B exclusively sold their prawn and fish catches to middlemen.
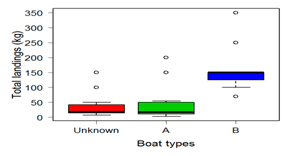
Figure 13 Boxplot of Mean Individual Landing (kg) by Boat types. Suspicious Data Points of Landings greater than 700 kg have been omitted. Information Obtained Based on Fishermen Interview (n = 47).
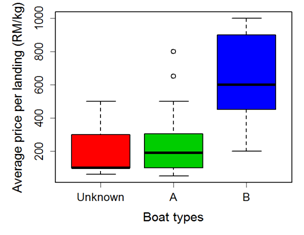
Figure 14 Boxplot of Mean Price per Landing (RM/kg) by boat types. Point of Price per Landing Greater than RM1200/kg has been omitted. Information Obtained Based on Fishermen Interview (n = 47).
High value catch
When interviewed for the proportion of high-valued species in their catches, fishermen of the unknown and A boat types generally reported estimates of less than 50%. Those who reported more than 50% may perceive ‘low-valued fish’ as being valuable since they are still saleable. With a few exceptions, fishermen of boats type B reported about 50 to 60 % high-valued species in their catches. No clear relationship could be observed between the average price of landings and the percentage of high value species in their catches (Figure 15).

Figure 15 Estimated Percentages of High-Valued Species in Catch by Boat Types. Information Obtained Based on Fishermen Interview (n = 47).
Drivers of fishing practices
There was a strong consensus among the fishermen interviewed that the catch trend over the last 5 years was decrease over time (87%). The others reported that the catch levels had maintained at a consistent level in the last 5 years; no one reported an increasing catch trend. Of the fishermen who responded (37), more than 80% said that they change their fishing habits over time. 45% reported adjusting their fishing habits according to season, 10% based their fishing habits according to tides, and 5% based on both tides and seasons. Adjustment of fishing practices was particularly obvious for fishermen with boats type A. Generally, the choice of fishing sites was primarily influenced by the following reasons:
A smaller proportion reported that their choice of areas to fish was for the purpose of reducing competition with others as well as safety reasons. Many fishermen stated that there are peak seasons to the fishing activities, based on the abundance of the target species. Generally, the months of March to April for crabs, April to July were ideal for prawn and pomfret fishing, April to October for snappers and threadfins, and August to September for mackerel. The general consensus is that the ideal time for fishing is during mid-year
In 1995, Malaysia was a net importer of fish in terms of quantity but a net exporter in value terms due to the high value of its fish and fishery product exports. However, the net foreign exchange earnings have declined due to increased importation of low-grade fish and the fast increase in import prices. Imports increased from 200,700t valued at RM363.6 million in 1990 to 260 570 t valued at RM828.4 million in 1995. During the same period exports increased from 145 400 t valued at RM606.1 million to 247 840 t valued at RM892.2 million.
Import of fish
Since 1996, however, Malaysia has become a net importer of fish in terms of both quantity and value.1 In 1997, Malaysia exported about 107,620t valued at about RM939.6 million and imported 297,780 t valued at RM 979.2 million. This imbalance continues to increase such that in 2013, Malaysia imported 508, 599t but exported only 216, 512t. Selangor is the leading fish importing state but is also one of the main exporting states. The increase in fish importing is likely driven by the increase in consumer purchasing power, changing consumer preferences for seafood as well as inadequacy of local production. During 1960 to 1989, the mean per capita consumption of fish was about 23 kg, with a steady increase over the years. It has risen to more than 50 kg per annum in early 2000s. The Malaysian fishery statistics indicate a general increase in marine landings over time; in the Strait, landings have increased by 216% compared to 1970s.9 However, there are underlying trends worth noting that point to major issues in the status of our fishery which will be discussed in subsequent paragraphs.
Catch Per Unit Effort (CPUE)
Catch per unit effort (CPUE) or catch rate is an important indicator of fishery health as this metric provides a measure of fishery productivity standardized to the effort exerted by the fishery itself. Even if landings have increased over time, we need to examine if fishermen have had to work harder in order to land the same amount of fish today that they did, say, ten years back. The World Wildlife Fund had attempted to estimate catch rates from the annual fisheries statistics but have found them to be unreliable.9 Such information is usually provided via stock assessments (if any); however the most recently available assessment by DOF was conducted back in 1997. An assessment of demersal fishery in the Strait in the years prior to 1997 was available.1 Total landing of demersal fish in the Strait was 230,000 t in 1997, 269, 606 t in 2005 and 313,496 t in 2009. For traditional fisheries, landings were in the range of 27, 000 to 45,000 t during the 1970s, 27,000 to 60 000 t during the 1980s, and 37,000 to 71,000 t during the 1990s. If we examine the landings by weight alone, there appeared to be a trend of fairly steady increase. However, the mean catch rate of demersal fish in the Strait in 1997 was about 3,036 t unit-1 (1997); this is only about 10% of what it used to be in 1971 (27,379 t unit-1). The mean catch rate for this important group of fish has been steadily decreasing since the 1970s.9
Fish landings
The increase in fishery landings over time is driven largely by increase in trash fish as well as mixed fish catches. Distinction between the two categories is sublime; however, the former tend to be referred to as undersized fish that are not suitable for human consumption while the latter is usually higher quality juvenile fish that are not saleable in the retail market.9 Trash fish currently accounts for at least 20% out of overall catch in the Strait (26% in 2009). An increase in catch rates for vessels of 25 to 40 GRT in the Strait in the year 2009 was accounted for by increase in landings of trash fish and prawns.9 This suggests serious growth overfishing where juveniles are not given the opportunity to grow, reproduce and contribute to sustaining the fish stock (Figure 16).

Figure 16 Landings of Marine Resources in the Straits of Malacca. Source: Department of Fisheries for the Years 1975 to 2013.
Marine landings in the state of Selangor had undergone some major fluctuations during 1970s and 1980s but showed a trend of increase from the early 1990s onwards (Figure 17). The Selangor landings in the last decade appeared to have stabilized at about 120,000 tonnes. However the breakdown of the landings suggest that the state fisheries resources are not doing well. As highlighted earlier, the largest components of the current state landings are trash fish and shellfish, while the share of pelagic and demersal fish catch has decreased relative to earlier years.

Figure 17 Landings of Marine Resources in the State of Selangor. Source: Department of Fisheries for the Years 1975 to 2013.
Fishery output
Another notably disturbing trend is the decrease in fishery output (total landing of fish) per fishermen. This decrease is observed across Malaysia but most pronounced in the Strait, with a decrease from 17.3 tonnes per fishermen in the year 2000 to 14.4 tonnes per fishermen in the year in 2009.9 Despite efforts to control fishing effort using license control, research studies have shown unabated decline in fisheries resources on the west coast of Peninsular Malaysia since the 1970s.9 Current management regimes for sustaining present stock levels have mainly focused on controlling fishing effort through licensing and access limitations. Unfortunately, such an approach overlooks the complexity of the marine environment.7
In 1997, trawl nets contributed 84% of demersal fish landings in the Straits.1 The remaining came from drift gillnets (9%), other seines (3%) hook and lines (2%) and bag nets (1%). Demersal fish comprised about 75% of the landings of trawlers in zones B and C, and 85% of landings by big trawlers (70 GRT and above) operating in zone C2. This highlights the important role that trawlers play in contributing to the Malaysian commercial fishery industry.
Fishing gear
Currently, the most prominent gear based on total landings by weight in the Strait is:
Fishing operations
The number of trawls in operation in the Strait decreased from over 5,000 units during the early 1980s to 3,735 units by 1997 due to government policy to reduce effort in coastal areas. Reduction of trawlers was focused on the 0.1 to 24.9 t and 25 to 39.9 GRT categories, with up to 40% reduction during 1981 to 1997. At the same time, larger trawlers of 40 to 69.9 GRT increased in line with government efforts to encourage offshore fishing. On the other hand, trawlers of 70 GRT and above declined since 1991. One reason for this decline was the operational difficulty in getting crew. This condition improved little despite government moves to allow foreign crew on local fishing vessels. Average annual CPUE of trawlers with less than 25 GRT increased from 14.20t •unit-1 in 1981 to 37.44t •unit-1 in 1997, as the number of units decreased by about 38%. The same trend was observed for trawlers with 25 to 39.9 GRT. Overall, a 30 % reduction of the number of trawlers correspondingly increased catch rate 2.5 times during the period 1981 to 1997. This however did not account for the species composition in the increased catch rates, i.e. whether the percentage of high valued species were maintained concurrently with the improved catch rates.
In examining data on the number of hauls for purse seines and trawls in the 25 to 40 GRT range, the CPUE (catch/haul) computed was less than 200kg/haul from 2000 to 2008, but was followed by a sharp rise to 1,100kg/haul in 2009 in the Strait.9 Much of this dramatic increase in 2009 was driven by the increase in trash fish and prawns. While total landings have been increasing since 2000, the output per fisherman (tonnes/fisherman) has been declining not only for the Strait but also for all regions in Malaysia, at an average rate of 3.8% per annum. Although hard data is lacking on size distribution of catch, anecdotal information from interviews with fishermen suggest that mean sizes of fish are decreasing over time. As mentioned earlier, a fishery category of mixed and trash fish exists which allow fishermen to profit from catching small-sized and juvenile (non-mature) fish of little retail value. While it is unclear if there is a ‘targeted’ fishery for mixed fish, fishermen do not practice discarding or culling out smaller fish since there is market value for them, especially for use as aquaculture feed. The trend of landings of mixed fish is on the increase which seemingly encourage (or at least do not discourage) growth overfishing.
Trawling nets
The use of trawling nets exacerbates of the problem of catching small fish, especially when coupled with small mesh sizes. Trawl nets are also seen as the culprit of destruction of productive bottom habitats and ocean floors, given that they are dragged along the bottom to target demersal and benthic species. The recent ban on trawling in Malaysian waters, effective from year 2016, is a drastic but positive means to reduce both fishing effort and habitat destruction. One must bear in mind however that some number of years must be given to allow positive effects from the ban from manifesting into tangible
The fishermen population in the country was estimated at 144,424 in 2011.7 This is approximately 0.5% of the estimated population size of Malaysia (28.3 million in 2010). The fishermen population in the country was estimated at 144,424 in 2011. Local fishermen constitute 72% of the total fishermen population while the foreigners are mainly from Thailand, Indonesia, and Vietnam. The number of foreign fishermen is increasing at a faster rate than the local fishermen. Despite various policies and programs introduced by the government, the fishing community remains one of the poorest sectors in the country. 44.7% of the 40,500 fishing households in Peninsular Malaysia lived below subsistence level in 1983 (Government of Malaysia (GOM) 1984). This could however be influenced by the fact that about 50% of the total fishermen population reside in Sabah. In the Strait, nearly 50% of the fishermen are ethnic Chinese, “Bumiputras” and Thais make up 40% and 8%, respectively.1. Since 1980, the number of fishermen in all Malaysian ethnic groups, except for the foreigner category, has been decreasing. This reduction in number is consistent with the government policy to ensure sustainable fishing particularly in inshore waters and improvement in catch for the remaining fishermen.
Education and income
Based on a survey conducted by the Fisheries Development Authority (FDA) in 1995 that covered 45% of fishermen in Peninsular Malaysia, about 63% of fishermen in both commercial and traditional fishing received only up to primary education. About 8% and 12% of fishermen in commercial and traditional fishing, respectively, did not receive any form of formal schooling. The percentage of fishers who received up to lower secondary education was about 27% in commercial fishing and 20% in traditional fishing. Barely 1% of fishers in both sectors attended higher secondary or tertiary education. Although this study is outdated (and updated study could not be located), it is unlikely that the situation has improved dramatically. Assuming a reasonable scenario of two-fold improvement, this still translates to about a maximum of 50% of fishermen with up to lower secondary education. The education level of fishermen may be better in the Strait than across Peninsular Malaysia, but possibly not by much. With minimal education, career switching will not be a possible option for many of the fishermen even when fishing is not possible. Average income for commercial and traditional fishers in Peninsular Malaysia in 1995 was RM1, 121 and RM715 respectively. In the Strait, 87% of income came from fishing activities and the balance was from additional activities such as aquaculture, fish processing, farming, animal husbandry and tourism.1 Recent statistics estimated income per vessel per month to be RM2318 for zone A, RM 17288 for zone B, and RM 39344 for zone C .13 If we assume that the median number of crew per vessel is 2 for boat A and 4 for boat B, each fishermen may earn about RM 1159 and RM4322 for zones A and B respectively, assuming equal profit sharing. However, it is unknown if the reported incomes are net or gross amounts. It is also not known if the fishermen accept government subsidies in terms of fuel, catch and livelihood. Based on the information gathered, the coastal traditional fishermen (in zone A) appeared to be facing genuine hardships due to declining fish stocks, decreased catch and lack of ability to upgrade their existing fishing technology to fish further offshore.
Statistics
Data from years 2011 to 2013 indicate fairly stable numbers in fishermen by categories in Selangor, but there was a double-fold increase in the number of “Bumiputra” fishermen as well as in the numbers of foreigners in 2013. It was unclear what drove this dramatic increase. The national statistics.13 reported a total of 5357 vessels operating in Selangor (summed up across zones A, B, C and C2). The number of fishermen working on licensed fishing vessels in Selangor in 2013 was 9,122 .5). Assuming that one fisherman owns one vessel each, less than half of the registered fishermen are boat or vessel owners. About 50% of fishermen in Selangor derive part of their income from non-fishing sources, given that income from fishing alone is insufficient to support their families.9 often fishermen do not go out fishing or fish much less frequently compared to the past due to prohibitive costs.
The field survey period is not a peak fishing season for many fishermen, in large part due to unsuitable weather conditions with a huge amount of rainfall brought by the northeast monsoon season. This also coincides with low abundance of target species (see discussion from field survey above). Consequently, the field assistants faced some difficulties in estimating time of fish landings and encountering landing events since less fishermen go out fishing. As mentioned earlier, the complete fisheries statistics for year 2014 was not available at the time of writing. Hence information from the field survey will be compared to the most recent fisheries statistics for year 2013. We observed some discrepancies between information from our field survey and the statistics given by the department of fisheries on the ex-vessel prices for fresh fish in the year 2013 (Figure 18). Specifically, the reported average ex-vessel price per kg by species for peninsula Malaysia was considerably lower than what was reported by the fishermen, especially for some highly valuable species such as the king prawn, pink prawn, Spanish mackerel, barramundi, black pomfret and silver pomfret. The exceptions were whiting, threadfin, mangrove snapper and catfish, which shared similar prices. This could be in part explained by the possibility that fish of the same species fetched lower price elsewhere in peninsula Malaysia, or that fishermen were able to get better prices by doing direct selling (this cannot however be verified from our data). The same discrepancies were observed between reports by fishermen and the statistics reported in the annual publication by the fisheries development authority of Malaysia.13 The estimated average national income per trip for zone b (rm 4,422) was considerably higher than the reported range of income per trip surveyed from the field (range from rm 200 to 1,000). Although the fishermen surveyed could have under-reported their income or reported the recent income which reflected the poorer catch conditions from the ‘non-peak season’ (see earlier discussion on seasonality of fishing), one would expect that fishermen income based on landings from the state of Selangor would be on the higher end when compared to the national average.
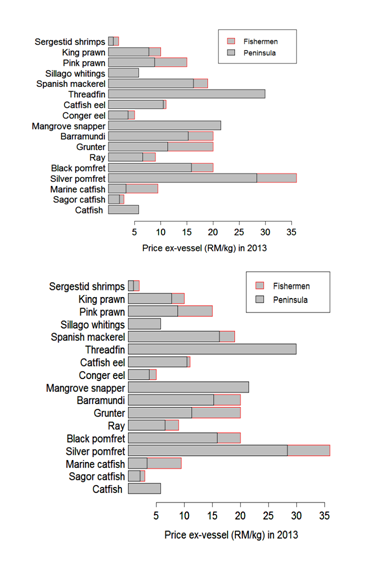
Figure 18 Comparison between the Ex-Vessel Prices (RM/kg) Reported by the Fishermen Interviewed in Port Klang and the Average Ex-vessel Prices for Peninsula Malaysia in the National Fisheries Statistics Source: DOF, (2013).
The number of fishermen working on licensed fishing vessels in Selangor in 2013 was 9,122.5 Of these, 2338 are registered in the Klang district. Our interview of 47 fishermen, which constitute a mere 2% of all the fishermen in Klang, may not necessarily be representative of the fishing parameters experienced by the general population of fishermen in Klang, much less in Selangor.
The Straits of Malacca is historically, and still is, a productive region for Malaysian marine capture fishery, with valuable demersal and pelagic resources of finfish and shellfish. In addition to contribution towards the national gross domestic product (GDP), the fishery sector also provides crucial employment and livelihood to a substantial number of coastal fishermen. A closer inspection of the fishery statistics coupled with data obtained from field survey indicated that the health of the fish stocks is declining considerably, particularly the demersal fishery resources. Many fishermen have reported reduction of fishing frequency due to decreased catch, and reliance on other sources of income, indicating strong economic impacts on their livelihood.
We wish to thank the Selangor Department of Fishery, specifically Puan Muslihah Abdul Rahman, for help in providing the necessary data for this work. Our deepest appreciation to the research assistants, namely Lee Soon Loong, Lau Chai Ming, Ooi Boon Leong, Wan Mohammad Syazwan bin Wan Solahudin, and Muhammad Jamizan Abdul Rahman, for their dedication and commitment to the field work component of this project. In addition, we are grateful to the fishermen of Permatang Pasir, Kampung Kelanang, Pulau Indah, Kampung Sungai Kembong, Sultan Sulaiman, Kunci Air Kampung Delik, Sungai Udang, and Pulau Ketam, for their willingness to be interviewed for this project.
None.

©2016 Jagerroos. This is an open access article distributed under the terms of the, which permits unrestricted use, distribution, and build upon your work non-commercially.