Journal of
eISSN: 2378-3184


Case Report Volume 2 Issue 2
University of Maine, USA
Correspondence: Sebastian Velez, School of Marine Sciences, University of Maine, Orono, USA
Received: March 20, 2015 | Published: April 10, 2015
Citation: Velez S (2015) Effects of Ultrasonic Frequencies on Schooling Behavior of American Shad (Alosa sapidissima). J Aquac Mar Biol 2(2): 00019. DOI: 10.15406/jamb.2015.02.00019
The behavioral responses of the American shad (Alosa sapidissima) to ultrasonic frequencies are of interest to the scientific community and the natural resource agencies that manage diadromous fish stocks. American shad have been reported to respond with changes in schooling behavior to different frequencies of sound. Their two regions of auditory sensitivity are from 200-800Hz and 25-150 kHz. These are relatively high frequencies for hearing in most fishes. Frequencies within this range are also used in fish population assessments. Researchers and resource managers have used 120 kHz and 200 kHz echo-sounders to visualize the number, position, and timing of fish in aquatic and marine environments. Changes in behavior, e.g. avoidance, due to these acoustic beams could bias counts used in fisheries management. In spring 2010, schooling A. sapidissima were subjected to different frequencies and power levels of acoustics while their behavior was recorded using a Dual Frequency Identification Sonar (DIDSON), operating at 1.8MHz, outside the hearing range of American shad. The number of fish within a school decreased when exposed to 120 kHz. The median number of fish per school during the control periods before and after treatment, was 23(13.5-61.5) and 36(21-64), respectively, and 9(6.25-15.25) during treatment period 5. The time schools were present in the DIDSON image was also affected by this treatment. The average time schools were present during time period 5 was 9.83s ± 1.02s, and after treatment rose to 24.6s ± 5.16s. No fish were detected while a treatment of 120 kHz was present during treatment period 8. These data are preliminary but indicate an affect of 120 kHz on American shad behavior.
Keywords: American shad, Acoustics, Fisheries, Schooling, Behavior, Ultrasonic, DIDSON, Echogram, Avoidance.
The use of ultrasonic frequencies in stock assessments has become relatively common place; however, some of these frequencies are detectable by American shad (Alosa sapidissima) which respond with an avoidance behavior.1-4 Sound is most often defined as a disturbance of density that propagates within a medium, e.g., water.5 The properties of sound include both frequency and power levels. The frequency of sound refers to the number of times the wavelength is repeated in a given period of time while a sound’s power level refers to the total number of waves present. Because the nature of sound changes dramatically according to the medium where it is propagating, each location must be considered separately for its sound characteristics. The unique bottom type morphology of a location can affect the rate of sound attenuation depending on the hardness of the substrate present.5 Different frequencies (sound quality) and power levels (sound quantity) can be heard according to the hearing sensitivity of the organism attempting to identify the sound.2
The anatomy and physiology of hearing within the Order Clupeiformes, specifically in A. sapidissima, are of an extremely specialized nature unique to this group. A. sapidissima has the ability to detect sounds from 100Hz-180 kHz with two regions of enhanced sensitivity from 200Hz-800Hz and 25 kHz-150 kHz. The method by which sound can be detected in fish is through the use of the semicircular canal system which plays an integral role in the octavolateralis system. This system uses mechanosensory hair cells for signal detection and responds to sounds and similar forms of stimuli. Clupeids can detect disturbances from considerable distances and have a unique acoustic coupling between the air-filled swim bladder and inner ear, the utricle. The utricle is theorized to increase the density discontinuities within the body and allow for enhanced detection of changes in density within water caused by ultrasonic frequencies.5
Upon reaching the ocean, these fish are often found in large schools. Schooling is defined as the polarized and synchronized swimming behavior used as a defensive mechanism during adult and juvenile stages against predation. 6 The lateral line system specializes in the response to movement and the motion of the surrounding water. These stimuli include the changes in water movement produced by other swimming fish within 1-2 body lengths within a school.5 Fish schooling results in a combined effect of reduced masking and predator confusion which has allowed it to become such an evolutionary success .7 The most conspicuous characteristics of schooling fish are the constancy in orientation and synchronization of speed and direction of movement between individuals.8
The individual behavior of American shad when subjected to ultrasonic frequencies has varying degrees of intensity and can be assumed to affect schooling behavior as well.4 In laboratory experiments conducted by Popper and Carlson.5 A. sapidissima were seen showing an intense startle response to ultrasonic frequencies. In a closely related species, Alosa pseudoharengus, individual behavior varied according to the volume, frequency, and duration of the emitted sound .4 The behavior of individual fish to a strong stimulation, in this case an ultrasonic frequency of 120 kHz, is often referred to as a startle response. The startle response is often observed as a C-start where the body fish forms a “C” shape that points away from the sound source.5
There are three types of observed behavior in A. pseudoharengus, elicited by the echo-locating clicks of hunting cetaceans.
The trend suggests that as the intensity of the sound increases, whether by frequency or volume, the subjected schools and individuals move away from the source in a behavior resembling that of avoidance.3 The unique auditory capabilities of Clupeiformes, allows for the application of high-frequency sounds as a deterrent to prevent entrainment in both dams and power plants .2 Steam or hydro-powered electricity generating stations often entrain and kill fish and can therefore have a negative impact on fish populations. High frequency sounds emitted by transducers used at dams have been shown to reduce the entrainment of A. aestivalisand A. pseudoharengus for short periods of time .9 Applying high intensity pulsed ultrasound (frequencies from 110-140kHz at power levels above 180dB) has been shown to repel several species of Clupeiformes, including A. sapidissima, A. aestivalis and A. pseudoharengus, from cold water intakes used in power plants. The use of pingers on fishing nets have also been used with the objective of repelling dolphins as by catch but have also been found to reduce the catch of targeted clupeids.10
The use of high frequency sounds as a method for stock assessment, as well as understanding and modifying the schooling and individual behavior of A. sapidissima is a relatively new concept with promising results.2 Using high frequency echo-sounders as a method of stock assessment for A. sapidissima has recently come into question due to the avoidance behavior witnessed by researchers .2-4,11 These stock assessments often use frequencies of 120 kHz and 200 kHz, which can be sensed within the upper end of the hearing spectrum of A. sapidissima and can potentially elicit an avoidance behavior .11 This reaction can thus bias the counts generated by this form of stock assessment and potentially record a smaller number of individuals than there actually are .10 A study conducted in the Wye River in Wales examined the effects of stock assessment frequencies (200 kHz) on the behavior of migrating Alosa fallax. A. fallax, a close relative of A. sapidissima, showed an avoidance behavior to stock assessment frequencies of 200 kHz. 11 This behavior decreased the number of fish migrating up river .10 In contrast, time periods where higher frequencies, outside the hearing range of these fishes, were used showed no observable reaction.11 Alosa aestivalis, another closely related species to A. sapidissima, also exhibits avoidance behavior towards ultrasonic echo-sounders, further suggesting that stock assessments which use this type of equipment could lead to potential bias .10 High frequency sounds can thus control the local distribution of A. sapidissima and other closely related species as seen in areas where hydro-power plants are found, and as a method for excluding fish from polluted or construction sites .2 However, if these acoustic methods are used for stock assessment on Clupeiformes, the ability of these animals to detect these frequencies has the potential to cause bias and affect management practices .11 The changes in the behavior of sound as a result of unique morphological differences between locations illustrate the need to consider each location independently.
The objective of this study is to find the potential effects elicited by ultrasonic frequencies at 120 kHz at -0dB on the schooling behavior of American Shad. If a change in schooling behavior is detected as a result of using these acoustic methods in stock assessment strategies, there could be an associated bias in the data generated. Changes in the way fisheries monitor and manage Clupeiformes can therefore be affected according to the type of stock assessment strategy used to identify the health of the population.
On May 15, 2010, schooling A. sapidissima were subjected to different frequencies and power levels of sound in the wild using specialized equipment designed to emit these sounds and record changes in behavior. The experiment took place just north of the Conte Anadromous Fish Lab in the Connecticut River at a natural rock dam where schooling A. sapidissima were prevented from moving upstream (Figure 1). Sound was emitted with a split beam digital transducer, and a Biosonics model DTX (often used as an echo sounder during acoustic stock assessments). The DTX was connected to three different transducers, each one producing a different frequency of sound with an adjustable power level (e.g. at -0dB there was no adjustment and -10dB adjusted the power of the signal to 10dB). The three frequencies used were: 120 kHz, 200 kHz, and 420 kHz. Although different frequencies and power levels were emitted throughout the study, this report focuses on the test periods when 120 kHz at -0dB were used because previous experiments showed that A. sapidissima demonstrated behavioral responses at this level.3-5
The relative position of the site to the Conte Anadromous Fish Laboratory is indicated.
The setup of the experimental area, especially the placement of monitoring equipment and transducers was of extreme importance and integral to the study. The behavior of A. sapidissima was recorded using a Dual Frequency Identification Sonar (DIDSON), operating at 1.8MHz. The DIDSON was used as an imaging device to classify the behavior of schools and individuals. The DIDSON ran continuously from 7:18 to 19:18 on May 15, 2010. From 7:18 until 12:25 the DIDSON remained in one location relatively near shore and close to the camp set up with the river flowing from right to left. At 12:25 the DIDSON was moved approximately 5m into the river (Figure 2). At approximately 14:30 the DTX was moved from its original position, 89m downstream of the DIDSON, to approximately 3m upstream of the DIDSON. Occasionally the DTX fell over as a result of the river’s flow; at times this would delay the start of a treatment period. From 7:18:48 to 17:37:49 the DTX was activated and deactivated only when there was schooling A. sapidissima in view of the DIDSON. We did this in order to see if adding/removing the ultrasonic sound stimulus affected either schooling or individual behavior. Previous laboratory experiments found that these fish would react strongly (i.e. startle) when frequencies below 200 kHz, eg.120kHz -0dB, were present.
The position of the DTX (sites A-C), the DIDSON (yellow), and the camp setup (square) are indicated.
Data analysis consisted primarily of reviewing recorded images collected from the DIDSON that needed changes in resolution in order to be analyzed accurately. The software used to view and record the behavior of shad was DIDSON Control and Display V5.25. Files were named according to the date and time the DIDSON was recording. The original raw data files were separated and labeled according to the time and type of treatment being used. The data was analyzed from ten minutes prior to, during, and ten minutes after, the DTX treatment (Table 1). For each ten minute period maximum contrast was used to readily identify swimming fish. Background subtraction and a correction for beam pattern loss were also implemented to increase the accuracy of the images. An LCD2 setting for the palette was the most helpful and contrasted the fish swimming across the recorded area. Files were then played at 7-10 frames per second. This speed was essential as it was very difficult to see fish at lower frame speeds, and too difficult to count fish at higher frame speeds.
|
Date |
Time |
Treatment |
Time Periods |
|
5/14/2010 |
09:59:02 |
none |
1 |
|
5/14/2010 |
11:43:30 |
none |
2 |
|
5/14/2010 |
12:05:07 |
none |
3 |
|
5/14/2010 |
13:13:42 |
none |
4 |
|
5/14/2010 |
13:24:00 |
120kHz at -0dB |
5 |
|
5/14/2010 |
13:35:29 |
none |
6 |
|
5/14/2010 |
16:43:02 |
none |
7 |
|
5/14/2010 |
16:52:20 |
120kHz at -0dB |
8 |
|
5/14/2010 |
17:02:40 |
none |
9 |
Table 1 Details on analyzed time periods: times and number designation for those periods analyzed in this report. Lines with bold lettering are treatment periods
Based on DIDSON observations, schools of fish were more prevalent than lone individuals; as a result the DIDSON observations were quantified in the following way. Schools were defined as tightly knit groups of fish with little to no separation between them. Schools ranged in size from four fish to upwards of 450 individuals and were identified based on the time periods which separated these schools of fish. As fish entered the observed area they were regarded as one school, a new school was identified if there was a time period greater than three to four seconds where no fish were present between groups. Time periods where fish weren’t present ranged from minutes to a few seconds. Schools of fish were counted from the original raw data files that were collected and recorded in the field. Echograms were used to help visualize schools of fish and identify separation between schools, if any (Figure 3). The amount of time a school was present in the DIDSON view was recorded as the time the first fish entered the observation area and the time where the last fish left the area. In the echogram, identification markers were placed at the beginning and end of each school to mark the position of the first and last fish in the school (Figure 3). The video recording was used to more accurately determine the time of the start and end of each school (Figure 4). When the echogram perceived two schools, but the video showed fish connecting them, they were referred to as one school. All schools were quantified taking into account; the total number of schools during each ten minute period/treatment period, the number of fish within a school, and the time in which each school was present.
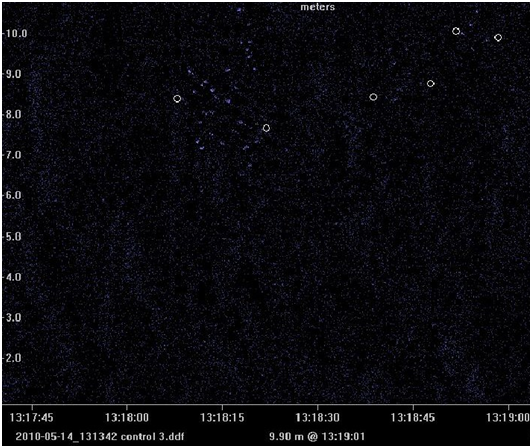
Figure 3 An example echogram generated with DIDSON proprietary software showing three schools, small circles mark the beginning and end of the schools.
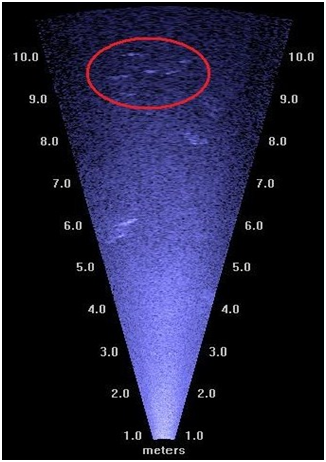
Figure 4 An image generated by the DIDSON capturing a small school (circled in red) of American shad as well as certain obstacles (circled in yellow).
Analyzing and Quantifying Schooling Behavior Three parameters were quantified to describe schooling behavior; (1) number of fish in a school, (2) swimming speed of fish in each school, (3) and the total time when schools were present during recorded time periods. For (1): the number of individuals in each of ten schools distributed throughout each time period was quantified. These schools were most often those which were easily identified and had individuals which were easy to track. For (2): the swimming speed of up to 50 individuals within a time period was calculated. For (3): the time where schools were present in the observed area covered by the DIDSON was quantified and compared between control and treatment periods. Behavior was quantified by counting the number of individuals per school within control (before and after treatment periods) and treatment periods (time periods where a frequency of 120 kHz at -0dB was played), as well as measuring the swimming speed of at least 10individuals within a school.
To determine the swimming speed of an individual fish the recording was paused and the observed individual was marked on the screen and the time was recorded. The recording then continued until just before the fish was no longer visible, the end time was recorded and the distance traveled was measured. The recorded distance was then divided by the time the observed individual was visible to determine the speed of the fish. This process was done for 10 fish per school for up to 5 schools within a time period. These schools were often chosen according to the ease of identification of swimming individuals as well as their even distribution throughout the ten minute period.
Other factors examined in quantifying the schooling behavior of A. sapidissima included identifying the proportion of fish per time period moving upstream versus downstream, identifying the proportion of fish found within the first school during a time period, and looking for individual behavioral responses, namely C-starts and startle responses.
Statistical Comparisons A One-way ANOVA was conducted for each parameter of the study (number of fish per school, time schools present, and swim speed). The data were not normally distributed and were therefore ranked for statistical analysis. A Dunn’s statistical analysis was performed to determine all pair-wise comparisons following the rank-based ANOVA. Box plots of medians and interquartile ranges were then generated from the statistically analyzed data to visually represent the data distribution and significant differences. Values were reported as medians with 25% and 75% interquartile ranges in parentheses.
The number of fish per school was counted for multiple control periods prior to any treatment and again once acoustic treatments began. Two treatment periods (5 and 8) were analyzed in this study; both at an acoustic application of 120 kHz at -0 dB (Table 1). The variability in the number of fish per school for time periods 1, 2, and 3 (before any acoustic treatment) was high in comparison to the other time periods (Figure 5). The number of fish in a school decreased when exposed to the treatment. Higher numbers of fish per school were observed during control periods, prior to and after treatments (Figure 6). There was no schooling fish observed during treatment period 8, therefore the number of fish per school could not be quantified for this period.
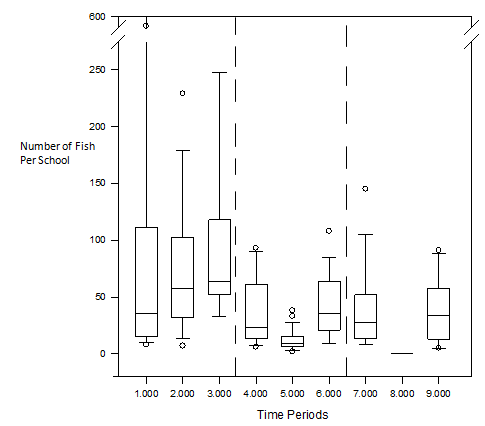
Figure 5 The median number of fish in schools during each control and treatment period as designated by the numbers assigned to each time period. The line within the box represents the median value for that specific time period, the top and bottom of the box plot represent the 75% and 25% interquartile ranges of the time period respectively, the t-shaped bars represent on the top and bottom of the box plots represent the 95% and 5% ranges of data (respectively), and circles represent outliers.
Time period 1 had the largest school with 484 individuals and a school size median of 36(15-111.5) individuals (Figure 5). Control period 1 also had the highest percentage of fish found in the first observable school of any other time period (Table 2). Time period 3 had the largest median school size, 64(52-118) individuals (Figure 5). There was a statistically significant difference between the school sizes of time periods 4 (control) and 5 (treatment) as well as between time periods 5 (treatment) and 6 (control) (Figure 6). Control period 4 had a school size median of 23(13.5-61.5) individuals while control period 6 had a school size median of 36(21-64) individuals (Figure 5). Treatment period 5 had the highest number of schools of any observed time period as well as the lowest number of observed fish (excluding treatment period 8) (Table 2). Treatment period 5 also had a school size median of 9(6.25-15.25) (Figure 5). However, this period also had the lowest number of fish per school of any period (excluding treatment period 8) (Table 2). Control periods 7 and 9 had a very similar median school size of 27(13.25-52) and 34(13-58) individuals respectively (Figure 5). No schools were observed during period 8 (Figure 5).
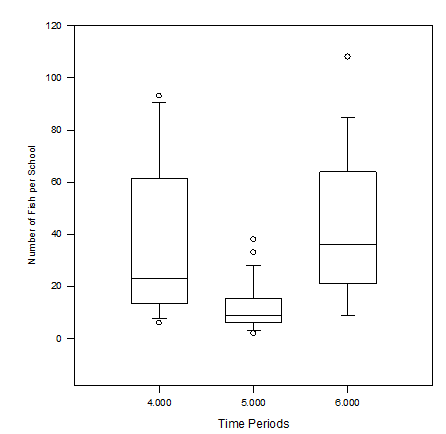
Figure 6 The medians number of fish in schools during time periods 4, 5, and 6. There was a statistically significant difference in the number of fish between time periods 5 and 6 as well as 4 and 5. The line within the box represents the median value for that specific time period, the top and bottom of the box plot represent the 75% and 25% interquartile ranges of the time period respectively, the t-shaped bars represent on the top and bottom of the box plots represent the 95% and 5% ranges of data (respectively), and circles represent outliers.
|
Treatment |
1 |
2 |
3 |
4 |
5 |
6 |
7 |
8 |
9 |
|
Number of Schools |
12 |
13 |
9 |
13 |
23 |
15 |
14 |
0 |
11 |
|
Percent of fish moving upstream |
60.41 |
77.17 |
65.2 |
35.81 |
46 |
64.1 |
46.41 |
0 |
50.5 |
|
Fish/School |
81.42 |
71.77 |
90.11 |
35.23 |
12.04 |
41.47 |
30.64 |
0 |
36.36 |
|
Total Fish |
1013 |
933 |
529 |
458 |
289 |
622 |
515 |
0 |
400 |
|
Percent of fish in First School |
47.778 |
2.47 |
7.9 |
17.69 |
11.4 |
17.4 |
28.16 |
0 |
14.5 |
|
Mean time Schools Present |
63.08 |
34.92 |
48.11 |
16.85 |
9.83 |
24.6 |
15.93 |
0 |
16.82 |
Table 2 The factors taken into account when considering the behavioral movements of A. sapidissima during control periods and treatment types of 120 kHz at -0dB
The time the schools were present in the DIDSON image was different during periods when the 120kHz-0dB was active (periods 5 and 8) and not. Treatment period 5 had the lowest median time in which schools were present of 8.5s (6.25-12.75) (excluding treatment period 8) (Figure 7). Treatment period 5 also had the lowest mean time where schools were present (Table 2). Control periods 2 and 3 had the highest median times where schools were present with 32s (16-44.5) and (11.5-51) respectively (Figure 7). There was a statistically significant difference in median school time between time periods 5 and 6 (Figure 8). The total time schools were present during control period 6 was 23s (14-28). The median time schools were present during control period 7 was 13.5s (10.75-17.75). There were no fish observed during treatment period 8 and therefore no mean time where schools were present. The total mean time schools were present during time period 9 was 13s (8-25).
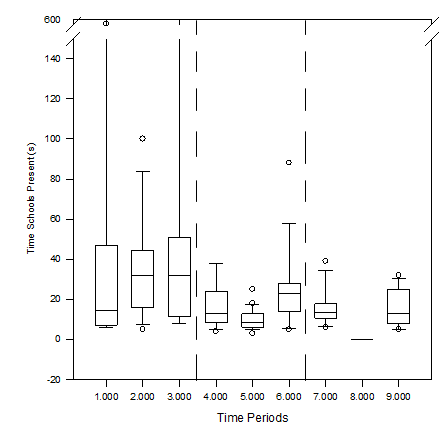
Figure 7 The mean time (s) schools were present during each control and treatment period as designated by the numbers assigned to each time period. The line within the box represents the median value for that specific time period, the top and bottom of the box plot represent the 75% and 25% interquartile ranges of the time period respectively, the t-shaped bars represent on the top and bottom of the box plots represent the 95% and 5% ranges of data (respectively), and circles represent outliers.
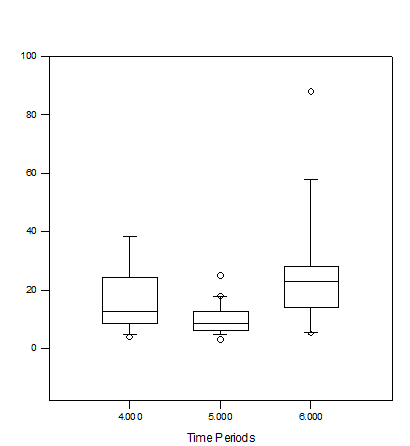
Figure 8 The mean number of fish in schools during time periods 4, 5, and 6. There was a statistically significant difference in the number of fish between time periods 5 and 6. The line within the box represents the median value for that specific time period, the top and bottom of the box plot represent the 75% and 25% interquartile ranges of the time period respectively, the t-shaped bars represent on the top and bottom of the box plots represent the 95% and 5% ranges of data (respectively), and circles represent outliers.
Swimming speed did not vary with between time periods. The median swim speed of schooling A. sapidissima during control period 4 was 1.198m/s (1.03-1.251) and was the highest of any other time period. Control period 6 had the lowest median swim speed observed at 0.972m/s (0.917-1.188). There was a statistically significant difference in the swimming speed of individual A. sapidissima between time periods 4 and 6. The median swimming speed of schooling fish within control period 6 was 0.972m/s(0.917-1.188). Control period 6 had the lowest median swimming speed of any other time period analyzed for swimming speed. The median swimming speed of schooling fish within treatment period 8 was 1.103m/s(0.843-1.38) (Figure 9). Although there were no schools recorded during treatment period 8, swimming speeds were collected from the time at which the DTX was turned on which was when there was a school present. As a result of this, the sample size for treatment period 8 was extremely small with high variability. Those fish present at the time the DTX was turned on were identified and recorded as the swimming speed for treatment period 8.
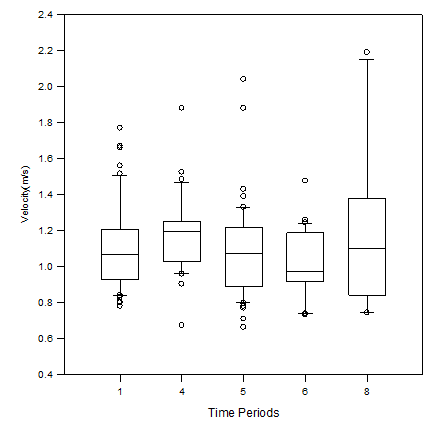
Figure 9 The mean swimming speed (m/s) of fish in schools during time periods 1, 4, 5, 6 and 8. There was a statistically significant difference between the mean swimming speed of fish in time periods 4 and 6. The line within the box represents the median value for that specific time period, the top and bottom of the box plot represent the 75% and 25% interquartile ranges of the time period respectively, the t-shaped bars represent on the top and bottom of the box plots represent the 95% and 5% ranges of data (respectively), and circles represent outliers.
This part is not important for the paper unless the authors provide data on urchin roe composition and references. Other than that it is only speculation. In an earlier investigation .9 it was demonstrated that the GSI is influenced by total dietary lipid (TDL) levels in the white shrimp. Higher TDL levels led to increase in the concentration of highly unsaturated fatty acids (HUFA). Because HUFA cannot be synthesized de novo by the penaeid shrimp.10 these should be present in the diet for gonad development and offspring quality. Importance of HUFA in diet of this species of shrimp has also been emphasized by Lytle et al.11 who suggested that the profiles of these fatty acids are a comparative tool in assessing the maturation diet. Mendoza et al.12 reported the influence of squid extracts on triggering the secondary vitellogenesis in the white shrimp. Ceballos et al.13 are of the view that for the balanced nutrition to have effects on somatic growth land gonad development, optimum culture conditions are necessary.
Other factors examined in quantifying the schooling behavior of A. sapidissima included; identifying the proportion of fish per time period moving upstream versus downstream, identifying the proportion of fish found within the first school during a time period, and looking for individual behavioral responses, specifically C-starts and startle responses. The data suggests that the majority of A. sapidissima continued to travel upstream despite being subjected to high frequency sounds.
The lower number of fish per school during treatment periods 5 and 8 was most likely due to the treatment of 120 kHz. This was a direct result of the observed avoidance behavior of A. sapidissima, similar to behaviors previously explained by Plachta and Popper .4 A higher number of schools present as well as a relatively small number of fish within schools during treatment period 5 could signify a change in general schooling behavior. The reduced time schools were present suggests that the larger schools of fish found during control periods may have broken up into smaller groups. These smaller schools showed an increased velocity upon being subjected to a frequency of 120 kHz -0dB. Continuous echo-locating clicks from T. truncatus have been known to cause schooling A. sapidissima to form compact schools diminishing the ability of predators to distinguish individuals in the school. 4
High variability in the number of fish per school during control periods 1, 2, and 3 can be described as a result of the size of large individual schools of fish, far larger than those found later in the day. This suggests that as the day went on the variability in the number of fish within a school decreased, which could have been a result of the barrage of treatments these fishes were exposed to throughout the experiment. The change in the number of fish per school in treatment periods 4, 5, and 6 shows that there was a decrease in the number as the frequency was activated and upon deactivation the number of fish per school increased again. The same observation took place for treatment periods 7, 8, and 9 showing that there was indeed an avoidance behavior observed towards frequencies of 120 kHz -0dB.
The median time schools were present was also affected by the presence of the 120 kHz frequency. Treatment period 5 had the lowest time of schools present than any other time period (excluding treatment period 8) although not statistically different from treatment period 4. The resulting drops in mean time schools were present for treatment period 5 and 8 are also characteristic of an avoidance behavior to the frequency 120 kHz -0dB. Schools of American shad subjected to this frequency during these time periods were most likely exhibiting a form of avoidance behavior in which they were attempting to turn away slowly from the source of the sound as observed by Plachta & Popper.4
The high variability in the swimming speed of American shad during treatment period 8 is most likely attributed to the low numbers of fish present, thereby exaggerating the variability. Although there is also high variability in swimming speed during treatment period 5 where there were much higher numbers of fish to be quantified. This suggests that a frequency of 120 kHz may increase the variability of swimming speed of American shad. Startle responses were not observed during these time periods most likely as a result of the video quality produced by the DIDSON, the amount of background noise produced by passing boats and fishermen, and the relative distance these fish were away from the DTX transducer. There was no startle response observed during the experiment although all schools where treatments were experienced had fish being observed at the moment of activation. Previous studies have observed that upon a close enough range, high frequency sounds illicit a random and very fast panic response in schooling A. sapidissima .3-4 Although there were no startle responses observed during these treatment periods the data still suggests that an overall avoidance behavior is taking place during time periods where a frequency of 120kHz -0dB is present.
The detection of ultrasonic frequencies in the Order Clupeiformes has been hypothesized to be a result of an evolutionary adaptation to detect and therefore avoid echo-locating predators .5,10 A. sapidissima has been observed to detect the echo-locating clicks of Tursiops truncatus at ranges of up to 187m away. Although it has been reported that T. truncatus is able to detect schooling shad well before the shad can detect the emitted clicks, shad are still able to perform evasive action and avoid these predators .10 Many Odontocetes emit echo-locating clicks with peak frequencies of 90-100 kHz, well within the hearing range of A. sapidissima.12 The increased sensitivity in A. sapidissima between 25 kHz and 150 kHz covers the peak frequencies used by echo-locating Odontocetes and could be a result of evolutionary selective pressures in ancestral species .10
It is generally accepted that the auditory capabilities of Clupeiformes originated before cetaceans were evolutionarily able to use echo-location as a result of the unique auditory coupling between the inner ear and swim bladder in all clupeids. The detection of high frequencies of sound in Clupeiformes may be a result of ancestral species living in shallow waters where low frequency sounds attenuated very rapidly and high frequencies carried greater distances. In order for these ancestral species to collect information about their surrounding environment they would have needed to hear high frequencies of sound. This new form of collecting information created high selective pressure on those individuals able to detect biologically relevant sounds at higher frequencies. These early specializations could have allowed for some Clupeiformes to be pre-adapted to detecting the high frequencies used by cetaceans and thereby evolve certain behaviors when confronted with echo-locating predators .1 This study shows a significant change in the schooling behavior of A. sapidissima when subjected to ultrasonic frequencies. Findings which we believe can be utilized for multiple purposes including the reduction in entrainment in dams and the possible removal of these fishes from polluted/construction areas.
I would like to express my thanks to Patrick Erbland, Matthew Dzaugis, Joseph Zydlewski, Ted Castro-Santos and Todd Dubreuil, who aided with the collection and generation of the data. I would also like to further thank Dr. Gayle Zydlewski her mentorship, and support throughout this project. Funding for this study was provided by the Penobscot River Restoration Trust and NOAA-Fisheries.
None.

©2015 Velez. This is an open access article distributed under the terms of the, which permits unrestricted use, distribution, and build upon your work non-commercially.