Journal of
eISSN: 2572-8466


Research Article Volume 4 Issue 3
1Department of Biotechnology, OPJS University, India
2Department of Bioinformatics, Xcelris Labs Limited, India
Correspondence: Chandan Badapanda, Xcelris Labs Limited, Ahmedabad, Gujarat, India, Tel 91-79-66092177, Fax 91-79-66309341
Received: October 30, 2017 | Published: December 20, 2017
Citation: Badapanda C, Rani R, Sahoo GC. Advancing our understanding of the soil microbial communities using QIIME software: a 16S data analysis pipeline. J Appl Biotechnol Bioeng. 2017;4(3):610-616. DOI: 10.15406/jabb.2017.04.00106
QIIME (Quantitative Insights Into Microbial Ecology) is one of the most popular open-source bioinformatics suite for performing 16S rRNA as well as Internal Transcribed Spacer (ITS) data analysis. The challenge that has frustrated microbiologists for decades is how to access the microorganisms that cannot be cultured in the laboratory and NGS (Next Generation Sequencing) platforms provide an additional set of tools to study uncultured species. Here, QIIME pipeline is implemented on soil samples to discover the microbial communities that exist in the soil where Rhazya stricta (Apocynaceae) is grown. The data sets of five soil samples were downloaded from NCBI-SRA for analysis through QIIME. The NGS technologies are very promising for resolving the immense soil 16S rRNA gene bacterial diversity and the pipeline implemented in this work can also be used for other bacterial diversity studies apart from the soil sample. Also our aim is to make use of the data which is often buried in supplementary data or SRA database that can be used to derive meaningful conclusion in metagenomics study through integrated bioinformatics approaches.
Keywords: 16S rRNA, data analysis, QIIME, bioinformatics, NGS, metagenomics, ITS
Rhazya stricta (Apocynaceae) is an important medicinal plant found commonly in South Asia (Pakistan, India and Afghanistan) and the Middle East (i.e. Saudi Arabia, Qatar, United Arab Emirates (UAE), Iran and Iraq). It is used in local folk medicine to treat many diseases such as diabetes mellitus, certain inflammatory conditions, and helminthiasis because leaves of Rhazya stricta contains more than 100 alkaloids with diverse pharmacological properties.1 Furthermore, as a perennial, it is likely that the associated microflora in the rhizosphere and on the leaves is controlled by the plant itself via these gene products and compounds. Plants use an array of secondary metabolites to defend themselves against harmful organisms and to attract others that are beneficial.2
The soil microbiota harbours thousands of bacteria, archaeal, and eukaryotic taxa and these microorganisms play critical roles in regulating soil fertility, plant health and controlling biogeochemical cycling of elements essential for life.3 To identify cultured fungal isolates associated with Rhazya stricta in the rhizosphere and soil in the vicinity of the plant from different sites of Saudi Arabia, a 18S and DNA barcoding study was performed.2 A few studies on genomic and transcriptomics of the plant Rhazya stricta were also done4,5 but so far to our knowledge no report has been published on the 16S data analysis profile of the soil sample where Rhazya stricta is grown. The microflora of desert soil is highly dependent on the temperature, moisture and the presence of organic carbon.6 In this article, QIIME (Quantitative Insights into Microbial Ecology)7 Software Package is implemented to address two things
Soil near Rhazya stricta plants were taken as site for collecting the samples and in the manuscript we have renamed the samples as Sample A, Sample B, Sample C, Sample D and Sample E. Rhazya stricta (Apocynaceae) is a small, desert shrub found in Saudi Arabia and some other Asian countries. The total DNA was isolated from different soil sites around Rhazya stricta plant located in Saudi Arabia (N21°26.4’, E39°31.8’), these sites contain extensive Rhazya stricta plants. Soil DNA isolation was done by Power Soil DNA isolation kit as per the details under the NCBI Bioproject Id PRJEB8340. The Sequencing was carried out using Illumina MiSeq platform using 2 x150bp sequencing chemistry. An analysis of the deep sequences generated from the 16S V4 rRNA region amplicons was carried out to identify the taxonomic positions as well as the phylogenetic across five samples through the software package QIIME.7
Data analysis
For the study of diversity of microbial community present in rhizosphere of Rhazya stricta, QIIME-1.8.07 software was used. Trimmomatic (V0.36)8 was used for quality filtration and filtration was done on quality value >25 to get high quality (HQ) data. Paired end data were given as input in QIIME for the identification of non-chimeric sequences which is subsequently used in the downstream analysis process. Operational taxonomy unit (OTU) were assigned to similar sequences, for this UCLUST algorithm9 was used at sequence similarity threshold of 97% and greengenes database10 was used as the reference database for picking up OTUs, followed by picking up the representative OTUs. Taxonomy was assigned to each sequence, using BLAST tool11 assignment method and the greengenes database was used as the reference database at 90% similarity. Diversity between samples (“beta diversity”) was measured with UniFrac distances and evaluated using Principal Coordinate Analysis (PCoA) plots. The detail of the 16S data analysis is also previously described by our group12 and the workflow for 16S rRNA data analysis is provided in Figure 1.
A total of 5710165 16S rRNA sequences from the five soil samples (Sample A, Sample B, Sample C, Sample D and Sample E) were taken for the QIIME analysis. The details of Sample A, Sample B, Sample C, Sample D and Sample E with their SRA submitted ID, amount of high quality data is provided in Table 1.
Sample Name |
SRA ID |
Raw Reads |
HQ reads |
Sample A |
ERR747886 |
952991 |
945600 |
Sample B |
ERR747887 |
1612304 |
1599742 |
Sample C |
ERR747888 |
1506361 |
1496742 |
Sample D |
ERR747889 |
1525294 |
1514090 |
Sample E |
ERR747891 |
154901 |
153991 |
Table 1 Data statistics of Sample A, Sample B, Sample C, Sample D and Sample E
A total of 142971 OTUs were assigned at 97% identity for all 5 samples taking Greengenes database10 as a reference database through QIIME pipeline.7 Through QIIME, Actinobacteria, Proteobacteria followed by Acidobacter were found to be the most abundant phyla across five samples (Sample A, Sample B, Sample C, Sample D and Sample E). At phylum level, 22.9%, 24.3%, 29.5% and 16.2% of OTUs were assigned with Actinobacteria for Sample A, Sample B, Sample D and Sample E respectively, whereas 34.3% of OTUs were assigned with Actinobacteria for Sample C. Actinobacteria have significant biogeochemical roles in terrestrial soils as they have the ability to produce biologically-active secondary metabolites and almost 16,500 compounds have been reported to show antibacterial property against pathogenic bacteria.13,14 Secondly, Proteobacteria was found to be 22.2%, 17.2%, 19.7% and 23.4% in Sample A, Sample B, Sample D and Sample E where as Sample C was enriched with 38.3% with Proteobacteria. Actinomycetes (phylum-Actinobacteria) is found to be the most abundant bacterial phylum in desert soil.6 Apart from above, various other phyla such as Chloroflexi, Firmicutes, Gemmatimonadetes, Verrucomicrobia, Cyanobacteria were also identified to be present in all the five samples. A similar pattern of abundant phyla were reported previously from the desert soil and a variety of soil samples from different regions of the globe.3,15
Archaeal taxa were relatively rare across many biomes but abundantly present in hot desert soils and Thaumarchaeota being the principal representative archaeal group in nearly all soil samples reported previously.3,16 Two archaeal phyla, Euryarchaeota and Crenarchaeota were found to be present in all the five samples (Sample A, Sample B, Sample C, Sample D and Sample E). Euryarchaeota was found to be most abundant group with 9.82%, 6.81%, 0.14%, 13% and 8.58% OTUs in Sample A, Sample B, Sample C, Sample D and Sample E respectively. Crenarchaeota were found to be second most abundant group representing 2.40%, 1.64%, 0.05%, 0.89% and 1.94% OTUs in Sample A, Sample B, Sample C, Sample D and Sample E respectively. All Crenarchaeota belong to Thaumarchaeota and all Euryarchaeota belong to Thermoplasmata at class level and found to be present in all the five samples (Sample A, Sample B, Sample C, Sample D and Sample E). The similar pattern was also observed in hot desert soil samples reported previously.17
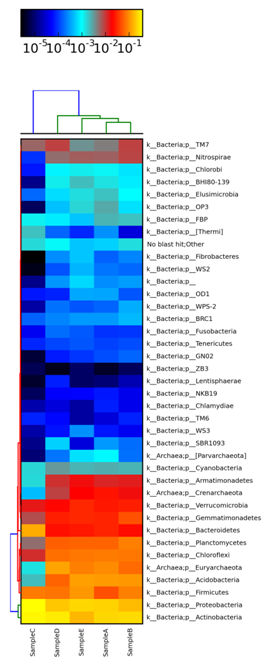
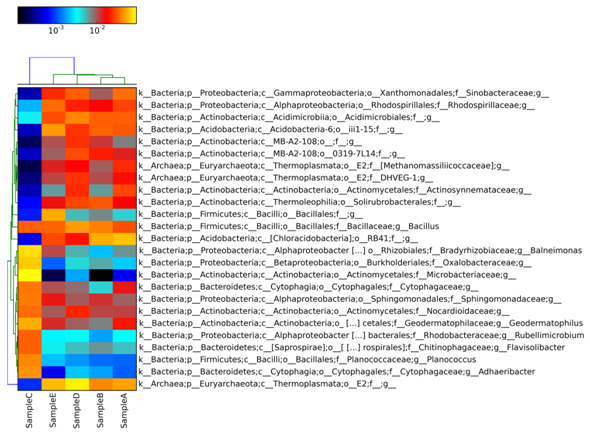
A heatmap is generated across Sample A, Sample B, Sample C, Sample D and Sample E in Figure 2 showing the comparative analysis at Phylum level through MetaPhIAn.18 In heatmap, each row corresponds to an OTU, and each column corresponds to a sample. The higher the abundance of an OTU in a sample, the more intense is the color at the corresponding position in the heatmap. By default, the OTUs (rows) were clustered by UPGMA hierarchical clustering, and the samples (columns) were presented in the order in which they appear in the OTU table. Figure 3 represents the heatmap across Sample A, Sample B, Sample C, Sample D and Sample E and their comparison at genus level. For interactive visualization of results Krona graph was generated at class level for Sample A, Sample B, Sample C, Sample D and Sample E. From Figure 4, it is observed that Sample C was enriched with 33.2% of Actinobacteria and 28.6% of Alphaproteobacteria at class level and found to be dominant as compared to other samples. In Sample D, 12.9% of OTUs were enriched with Thermoplasta and 6.9% were enriched with Thermoleophila. The Krona graph19 was generated in Figure 4 for Sample A, Sample B, Sample C, Sample D and Sample E respectively at class level.

Figure 2 A heatmap showing the abundance of each phylum within each microbial community is drawn through MetaPhIAn for Sample A, Sample B, Sample C, Sample D and Sample E.

Figure 3 An OTU table heat map showing taxonomy assignment for each OTU. The OTU heatmap displays raw OTU counts per sample, where the counts are colored based on the contribution of each OTU to the total OTU count present in that sample (blue: contributes low percentage of OTUs to sample; red/yellow: contributes high percentage of OTUs). Heatmap generated at genus level.
Alpha diversity
Alpha diversity within the five soil samples were used to depict evenness or richness of lineages present in all the samples.3,7,12 In all samples the total observed species was found in a range of 18000 to 108000. Sample A was found to have highest number of observed species (108333) whereas Sample D was found having lowest number of observed species (15010). No significant differences were observed in the alpha diversity indices across five samples and Table 2 represents the alpha diversity of all five samples using different matrices (shannon, PD Whole tree (Phylogenetic diversity whole tree), chao1, observed species).
Sample Name |
Shannon |
PD whole tree |
Chao1 |
Observed Species |
Sample A |
12.92365 |
2188.898 |
166462 |
108333 |
Sample B |
11.65946 |
844.2823 |
45335.98 |
33407 |
Sample C |
12.55557 |
2197.672 |
105938.6 |
74910 |
Sample D |
11.3913 |
424.9066 |
24184.47 |
15010 |
Sample E |
8.902856 |
430.9604 |
30922.92 |
18534 |
Table 2 Alpha diversity calculations for Sample A, Sample B, Sample C, Sample D and Sample E
Beta diversity
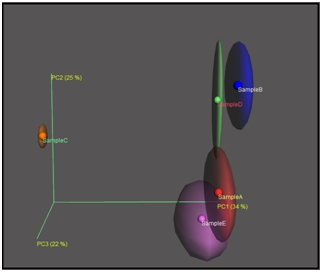
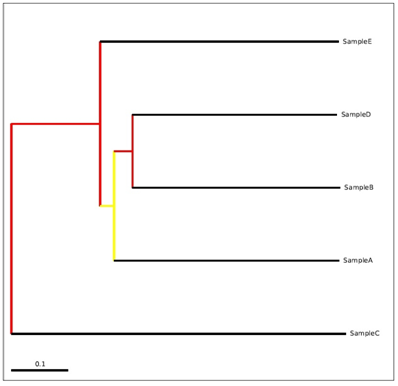
Beta diversity depict the dissimilarity between the samples.3,7,12 We had calculated the bray-curtis distances among five samples. Table 3 having the distances between the samples. From the PcoA analysis, it can be inferred that Sample C found to be most distant sample from Sample A, Sample B, Sample D and Sample E. Unweighted UniFrac PcoA (principal coordinates analysis) plots were used to show the relationship between soil samples.13 PcoA plot for Sample A, Sample B, Sample C, Sample D and Sample E is provided in the Figure 5 and phylogenetic analysis among five samples is shown in Figure 6. From the above analysis (beta diversity, PcoA and Phylogenetic study), it can be inferred that sample C is having different taxonomic composition as compared to sample A, B, D, E.
Sample B |
Sample A |
Sample D |
Sample E |
Sample C |
|
Sample B |
0 |
45504.04 |
51291.19 |
60148.3 |
133838.3 |
Sample A |
45504.04 |
0 |
36322.29 |
29534.51 |
122924.5 |
Sample D |
51291.19 |
36322.29 |
0 |
53226.45 |
128100.9 |
Sample E |
60148.3 |
29534.51 |
53226.45 |
0 |
121025.2 |
Sample C |
133838.3 |
122924.5 |
128100.9 |
121025.2 |
0 |
Table 3 Beta diversity between Sample A, Sample B, Sample C, Sample D and Sample E

Figure 5 Principle Coordinate Analysis (PCoA) Plot from unweighted UniFrac distance of Sample A, Sample B, Sample C, Sample D and Sample E.

Figure 6 A visualization of bootstrap-supported hierarchical cluster tree using unweighted uniFrac distance matrix that was used for the PcoA plot for the Sample A, Sample B, Sample C, Sample D and Sample E. The figure shows the tree with internal nodes colored, red for 75-100% support, yellow for 50-75%, green for 25-50%, and blue for <25% support. The bar at the bottom of the tree indicates a length corresponding to 0.1 nucleotide substitutions per site.
16S rRNA sequence analysis performed in this study contributed to the thermo tolerance microbiota present in the soil of Rhazya stricta, an arid land, perennial evergreen shrub commonly found in the Arabian Peninsula and Indian subcontinent. At phylum level, Actinobacteria, Proteobacteria followed by Acidobacter were found to be the most abundant phyla across Sample A, Sample B, Sample C, Sample D and Sample E.
The observed species calculated from alpha diversity varies from 15010 to 108333 OTUs between five samples. From the PcoA analysis, it can be inferred that Sample C was found to be the most distant sample from Sample A, Sample B, Sample D and Sample E. This result is also in line with the phylogenetic analysis as Sample C was found to be the out group as compared to Sample A, Sample B, Sample D and Sample E.
The QIIME pipeline implemented for the bacterial diversity analysis of five samples in this article, can also be used for any other bacterial data analysis from any environmental sample. In conclusion, our aim is to make use of the data which is often buried in supplementary data or SRA database or other public resources and can be used to derive meaningful conclusion in metagenomics study through integrated bioinformatics approaches.
None.
The author declares no conflict of interest.

©2017 Badapanda, et al. This is an open access article distributed under the terms of the, which permits unrestricted use, distribution, and build upon your work non-commercially.