Journal of
eISSN: 2572-8466


Research Article Volume 4 Issue 1
1Department of Applied Microbiology, Ferhat Abbas University, Algeria
2Laboratory Reactions and Process Engineering (LRPE), University of Lorraine, France
Correspondence: Aicha Nancib, Laboratory of Applied Microbiology, Ferhat Abbas University, 19000 Setif, Algeria, Tel 00-213-798-870-283, Fax 00 213 031 81 90 89
Received: April 28, 2017 | Published: October 16, 2017
Citation: Nancib A, Diboune N, Nancib N, et al. Statistical optimization of dilute acid hydrolysis of wood sawdust for lactic acid production. J Appl Biotechnol Bioeng. 2017;4(1):502-509. DOI: 10.15406/jabb.2017.04.00093
Sawdust wood (SW) is a promising lignocellulosic biomass for lactic acid production due to its abundant availability, low cost and high carbohydrates content that can be converted to fermentable sugars. The dilute acid hydrolysis of SW was investigated in this study and Lactococcus lactis was used to determine the feasibility of utilizing WS as feedstock for the production of lactic acid. Central composite design (CCD) was employed to optimize sulfuric acid, substrate loading and hydrolysis time for maximum sugar recovery. The results obtained were interpreted by analysis of variance and response surface methodology. The optimal acid hydrolysis conditions were as follows: sulfuric acid concentration of 8% (v/v) with substrate loading of 16% (w/v) and hydrolysis time of 2h. Under the optimal conditions, a glucose concentration of 8.78g/L was achieved. A regression model was generated according to the experimental data. Upon statistical analysis, coefficient of determination (R2) obtained was 0.96. Lactococcus lactis was found to be a potent lactic acid bacteria (LAB) strain for the production of lactic acid utilizing acid hydrolysate of WS and yeast extract as carbon and nitrogen sources, respectively. The maximum lactic acid concentration of 9.87g/L was obtained with a yield of 1.1g/g.
Keywords: wood sawdust, acid hydrolysis, lignocellulosic biomass, central composite design, fermentation, lactic acid
SW, sawdust wood; CCD, central composite design; LAB, lactic acid bacteria; L-LDH, L-lactate dehydrogenase; RSM, response surface methodology; 3D, 3-dimensional; MSW, meranti wood sawdust; OFI, Opuntia ficus indica
Lactic acid has a wide application in food, pharmaceutical, leather, cosmetic applications, textile, and polylactic acid industries.1-3 Lactic acid can be produced either by fermentation or by chemical synthesis. But the biotechnological fermentation process has received significant importance due to environmental concerns, use of renewable resources instead of petrochemicals, low production temperature, low energy requirements, and high purity. Mammalian cells only contain L-lactate dehydrogenase (L-LDH), so L(+) form of lactic acid is used for food and drug industry, because the human body is only adapted to assimilate this form by the action of the enzyme L-LDH whereas D-lactic acid is often harmful to human metabolism, his accumulation in the blood can cause acidosis.4,5 Lactic acid can be synthesized by microbial fermentation of the various raw materials such as molasses,6 whey,7 and date juice.8 As in any industrial organic acid or solvent fermentation, the main economic factors are the choice and cost of the substrate and the cost of recovery in downstream processing. Feedstock that would reduce the processing cost would greatly enhance the competitiveness of fermentative lactate production. Many efforts have been made to develop biotechnologies for lactate generation from such a cheap, abundant and renewable substrate. Recently, fermentation of non-food biomass has also gained considerable attention due to the forthcoming scarcity of fossil fuels and the increased lack of food and feed supplies over the world. Biomass of lignocelluloses is a low-cost and extensively available renewable carbon source as an alternative to the conventional feed stocks.9-11 Lignocellulosic biomass is primarily composed of cellulose, hemicellulose, and lignin.12,13 A cellulosic feedstock (such as wood) has been widely used to replace refined sugar, and been utilized for the production of ethanol,14,15 single cell protein,16 xylitol17 and organic acid such as lactic acid.18
The conversion of wood to lactic acid is more challenging due to the complex structure of the lingocellulose. The three polymers of Lignocellulosic biomass are arranged to form a highly recalcitrant structure,19 hindering the availability of carbohydrates for fermentation processes, representing a high barrier for the bioconversion of lignocellulosic material. In fact it is necessary to pretreat the wood to alter its structural and chemical composition to facilitate hydrolysis of carbohydrates to fermentable sugars.20,21 Pretreatment uses various techniques, including ammonia fiber explosion, chemical treatment, biological treatment, and steam explosion, to alter the structure of cellulosic biomass to make cellulose more accessible. Conversion of wood lignocellulosic biomass to glucose and other monomeric sugars can be achieved by acids or enzymes hydrolysis.22-25 Due to its low cost, pretreatment of lignocellulosic biomass through sulfuric acid is a conventional method. As the main component of lignocelluloses materials, cellulose is a biopolymer consisting of many glucose units connected through β-1,4-glycosidic bonds. The breakage of the β-1,4-glycosidic bonds by acids leads to the hydrolysis of cellulose polymers, resulting in the sugar molecule glucose or oligosaccharides. While depolymerization of hemicelluloses yields a mixture of different sugars that may contain xylose, glucose, mannose, arabinose, galactose and traces of other sugars, depending on the kind of the wood used. The hydrolysis reactions using dilute acid are very complex, mainly because the substrate is in a solid phase and the catalyst in a liquid phase. The reaction rate of hydrolysis depends on a number of variables, such as: temperature, acid concentration, time, substrate concentration and substrate composition.26 Few studies have reported the dilute-acid hydrolysis of lignocellulosic biomass from wood and the use of microorganism with ability to produce lactic acid in these hydrolysates.18,27-29
Optimization of hydrolysis conditions is necessary for improving the efficiency of biomass conversion processes. Rafiqul et al.30 pointed out that xylose release via acid bioconversion of Meranti wood sawdust depended on a number of process factors like temperature, H2SO4 concentration, and residence time. The present study was undertaken to evaluate the ability of a strain of Lactococcus lactis to grow on wood sawdust hydrolysate, prepared by dilute acid hydrolysis, for lactic acid production. Response surface methodology (RSM) based on central composite design (CCD) was applied to identify the optimum hydrolysis conditions for maximum sugar production. A mathematical correlation between acid concentration, substrate loading, and hydrolysis time was developed to obtain a maximum fermentable sugar concentration. The batch fermentative mode was studied to evaluate the feasibility of utilizing hydrolysate of sawdust as feedstock for the production of lactic acid.
Substrate
The sawdust of different wood species such as pine, beech, spruce was provided from the joinery (woodworking Setif/Algeria). The sawdust was dried at 60°C for 72 h. The dried sawdust was milled to increase its surface area and make the cellulose readily available for hydrolysis. It was then stored at room temperature for subsequent use.
Dilute acid hydrolysis
In this step, pretreated sawdust was hydrolyzed at 92°C with dilute sulfuric acid (Sigma-Aldrich, Deisenhofen, Germany). The sulfuric acid, substrate loading and the hydrolysis time were varied according to the experimental design. After acid hydrolysis, the solid residue was separated by centrifugation and the pH of the resulting supernatant was adjusted to 10 using 2N Ca(OH)2 (Sigma-Aldrich, Deisenhofen, Germany), filtering, acidifying to pH 5.5, adding sodium sulfite (Merck, Darmstadt, Germany) (1 g/L). The resulting precipitate was centrifuged off and the pH was adjusted to 6. All experiment runs were performed in duplicate
Design of experiment
A three variable central composite design for response surface methodology was used to study the combined effect of sulfuric acid concentration (4.63-11.36%), substrate loading (1.59-18.41%) and hydrolysis time (0.63-7.36 h) on glucose concentration over five level combinations (-α, -1, 0, +1, +α) shown in Table 1. Based on CCD, the experimental runs comprises of 20 trials (8 factorial points, 6 axial points and 6 central points). The coded values for independent variable were -1 (lowest level), 0 (middle level) and +1 (highest level). The factors (-α, +α) that ran along the axes drawn from the middle of the cube through the center of each face cube is coded as -1.682 and +1.682, respectively. The complete experimental design and results consisting of coded levels, actual variables, and responses (experimental and predicted values) are given in Table 2. To determine if there exist a relationship between the independent variables (sulfuric acid concentration, substrate loading and hydrolysis time) and the dependent variable (glucose concentration), the data collected were subjected to regression analysis using response surface regression procedure of MINITAB 16 (Minitab Inc, State College, PA). Second-order polynomial Eq (1) including main effects and interaction effects of each variable was used to calculate the predicted response:
……… (1)
Variables |
Codes |
Coded levels |
||||
-α |
-1 |
0 |
1 |
α |
||
H2SO4 % (v/v) |
X1 |
4.63 |
6 |
8 |
10 |
11.36 |
Substrate loading % (w/v) |
X2 |
1.59 |
5 |
10 |
15 |
18.41 |
Hydrolysis time (h) |
X3 |
0.63 |
2 |
4 |
6 |
7.36 |
Table 1 Experimental range and levels of variables
α (axial distance) = (Nf)1/4, Where Nf is the number of experiments of the factorial design. In this case, 1.682
Run |
Coded Factor |
Actual factor |
Glucose (g/L) |
|||||
X1 |
X2 |
X3 |
X1 (%) |
X2 (%) |
X3 (h) |
Observed Response |
Predicted Response |
|
1 |
-1 |
-1 |
-1 |
6 |
5 |
2 |
2.84 |
2.72 |
2 |
1 |
-1 |
-1 |
10 |
5 |
2 |
2.94 |
2.91 |
3 |
-1 |
1 |
-1 |
6 |
15 |
2 |
7.28 |
7.01 |
4 |
1 |
1 |
-1 |
10 |
15 |
2 |
8.65 |
8.23 |
5 |
-1 |
-1 |
1 |
6 |
5 |
6 |
3.83 |
4.18 |
6 |
1 |
-1 |
1 |
10 |
5 |
6 |
3.42 |
3.63 |
7 |
-1 |
1 |
1 |
6 |
15 |
6 |
6.71 |
6.68 |
8 |
1 |
1 |
1 |
10 |
15 |
6 |
7.1 |
7.16 |
9 |
0 |
0 |
0 |
8 |
10 |
0 |
5.46 |
4.93 |
10 |
0 |
0 |
0 |
8 |
10 |
0 |
5.55 |
4.93 |
11 |
0 |
0 |
0 |
8 |
10 |
0 |
4.29 |
4.93 |
12 |
0 |
0 |
0 |
8 |
10 |
0 |
4.33 |
4.93 |
13 |
0 |
0 |
0 |
8 |
10 |
0 |
5.32 |
4.93 |
14 |
0 |
0 |
0 |
8 |
10 |
0 |
4.65 |
4.93 |
15 |
- α |
0 |
0 |
4.63 |
10 |
0 |
3.33 |
3.34 |
16 |
+ α |
0 |
0 |
11.36 |
10 |
0 |
3.83 |
3.9 |
17 |
0 |
- α |
0 |
8 |
1.59 |
0 |
3.44 |
3.16 |
18 |
0 |
+ α |
0 |
8 |
18.41 |
0 |
9.37 |
9.73 |
19 |
0 |
0 |
- α |
8 |
10 |
0.63 |
5.18 |
5.65 |
20 |
0 |
0 |
+ α |
8 |
10 |
7.36 |
6.36 |
5.98 |
21a |
0 |
1.2 |
-1 |
8 |
16 |
2 |
8.78 |
8.39 |
Table 2 Experimental and predicted values of glucose concentration recorded in the experimental set up of RSM
a: Optimum conditions of acid hydrolysis.
Where Yiis the predicted response used to relate to the independent variable, xi and xj are the variables, k is the number of studied factors; while β0 is the constant coefficient and βi, βij and βii the coefficient of linear, interaction and square terms respectively. Multivariate regression analysis with model equation (1) was carried out on the data to yield equation (2) which was used to optimize the product responses.
…. (2)
The fitness of the polynomial model equation to the response was evaluated by the coefficient of R2 as well as the lack of fit, using F-test.
Media and growth conditions
Lactococcus lactis subsp. lactis (Lactococcus lactis) was used. Stock cultures were stored in Elliker medium with 20 % (v/v) glycerol at -20°C. The inoculum was prepared by transferring glycerol stock culture to an Erlenmeyer flask containing 100 ml of Elliker medium31 for pre-culture. The flask was subsequently incubated at 33.5°C for 12 h. Then, the culture containing the production medium (wood sawdust hydrolysate) was inoculated. A 10 % (v/v) inoculum was used in the fermentation. The pH of the final culture medium was adjusted to 6. The agitation speed was controlled at 200 rpm. Flask cultures were conducted in 250-ml Erlenmeyer flasks containing 100 ml of production medium. Wood sawdust hydrolysate was used essentially as the carbon source in the fermentation medium. Table 3 summarizes the characteristics of wood sawdust hydrolysate used in fermentation experiments. The medium was sterilized at 121°C for 20 min. After cooling, the hydrolysate was supplemented with extract yeast, 5 g/L; KH2PO4 (Sigma-Aldrich, Deisenhofen, Germany), 0.5 g/L; K2HPO4 (Sigma-Aldrich, Deisenhofen, Germany) 0.5 g/L; MnSO4 H2O (Merck, Darmstadt, Germany) 0.07 g/L; MgSO4 7H2O (Merck, Darmstadt, Germany) 0.5 g/L; CH3COONa 3H2O (Sigma-Aldrich, Deisenhofen, Germany) 6 g/L. The solutions of nutrients were sterilized separately.
Characteristics |
TPCa mg eq. GA/g |
Glucose (g/L) |
Reducing sugars (g/L) |
Moisture (%) |
pH (units) |
Wood Sawdust Hydrolysate |
50.8 |
8.7 |
34 |
7.5 |
6 |
Table 3 Characteristics of wood sawdust hydrolysate used in fermentation experiments
TPCa: Total phenolic content mg eq. gallic acid/g extract.
Analytical methods
The concentration of lactic acid was measured based on colorimetric determination by Taylor method.32 Glucose was measured using an enzymatic kit (Glucose PAP SL’’ Elitech). The total reducing sugars content of the final hydrolysate was determined by the colorimetric method using the UV-Vis spectrophotometer, (Spectronic Genesis 20) at 540 nm using 3, 5- dinitrosalicylic acid (DNS reagent) with glucose as standard.33 Total phenolic content in sawdust extracts was estimated by the Folin-Ciocalteu Method .34
The results of CDD experiments for studying the effects of three independent variables: sulfuric acid concentration, substrate loading and hydrolysis time are presented in the Table 2 along with the mean predicted and observed response. The coefficient of determination (R2) of the model was 0.96, this value means that 96% of the variability was explained by the model and indicated that the model adequately represented the real relationship between the variables under consideration. The adjusted determination coefficient (R2adj = 92.40%) was also able to confirm the significance of the model.
The mathematical model which represents a second-order polynomial is given by the following equation:
(3)
Where Y is the glucose concentration and positive sign in front of the terms indicates synergetic effect, whereas negative sign indicates antagonistic effect.
Pareto chart, which is very useful in design of experiments, is used in this work, to make it much easier to visualize the main and interaction effects of the factors to the response variable, that is, glucose concentration (Figure 1). The model identified that within the studied range of experiments the sulfuric acid (X1) has the highest positive impact on the hydrolysis process followed by the hydrolysis time (X3), quadratic effect of hydrolysis time (X3?2), interactive effect of sulfuric acid and substrate loading (X1X2), quadratic effect of substrate loading (X22) in a decreasing order (X1>X3>X32>X1X2>X22). While the sulfuric acid has a slight positive impact on the glucose concentration, its quadratic effect has the highest negative impact on the hydrolysis process, followed by the negative effect of substrate loading (X2), interactive effect of sulfuric acid and hydrolysis time (X1X3), interactive effect of substrate loading and time (X2X3) in a decreasing order.
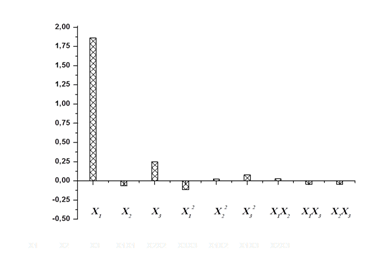
Figure 1 Pareto chart showing the effect of different independent variables on glucose concentration.
The analysis of variance (ANOVA) for the response surface full quadratic model is given in Table 4. The model was statistically significant as seen from the P-value (P = 0.000) and Ficher's F-test (F = 26.67). The lack of fit p value of 0.698 indicates that the model did not show lack of fit. The responses reveal that linear model term (X1), interactive model term (X2X3) and quadratic term model (X32) are significant (p<0.05). The quadratic model terms (X12 and X22) were more significant than the other terms. The P-value >0.05 means that the model terms are insignificant. We can see from Table 4 that interactions between the sulfuric acid and substrate loading (X1X2), interactions between the sulfuric acid and hydrolysis time (X1X3) and the linear coefficients (X2 and X3) are insignificant. Figure 2 is a parity plot showing a comparison between experimental values of the response and those predicted by the statistical model. All points were clustered around the diagonal line, indicating good fitness of the model. The residuals from the least squares are an important tool for judging the model adequacy. Figure 3A shows the plot of residuals vs. the predicted response. The residual plots of the model are randomly distributed without any trends. This result indicates good predictions of maximum response along with constant variance and adequacy of the quadratic models. The standardized residuals versus run plot represented in Figure 3B shows randomly scattered points ranged between ±0.75; the errors were normally distributed and insignificant.
Source |
Sum of Squares |
DF |
Mean Squares |
F-value |
p- value |
Model |
64.45 |
9 |
7.16 |
26.67 |
0 |
X1 (H2SO4) |
0.38 |
1 |
2.51 |
9.36 |
0.012* |
X2 (Substrate) |
52.13 |
1 |
0.02 |
0.25 |
0.748 |
X3 (Time) |
0.13 |
1 |
0.06 |
1.99 |
0.63 |
X1.X2 |
0.53 |
1 |
0.53 |
1.03 |
0.188 |
X1.X3 |
0.27 |
1 |
0.27 |
6 |
0.333 |
X2.X3 |
1.61 |
1 |
1.61 |
11.48 |
0.034* |
X12 |
4.26 |
1 |
3.08 |
15 |
0.007** |
X22 |
3.71 |
1 |
4.14 |
15.43 |
0.003** |
X32 |
1.4 |
1 |
1.4 |
5.21 |
0.046* |
Residual |
2.68 |
10 |
0.26 |
||
Lack of Fit |
1.02 |
5 |
0.2 |
0.61 |
0.698 |
Pure Error |
1.66 |
5 |
0.33 |
||
Cor Total |
67.13 |
19 |
|||
Table 4 ANOVA results for glucose concentration model
R2 = 96%; R2adj = 92.40%.
**P < 0.01- Significant at 1% level.
* P < 0.05- Significant at 5% level.
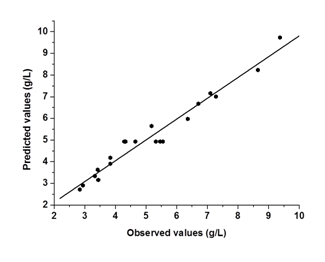
Figure 2 Parity plot showing the distribution of experimental vs. Predicted values of glucose concentration.
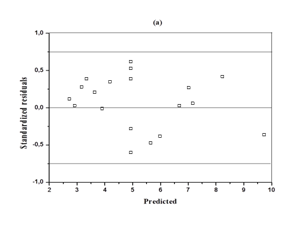
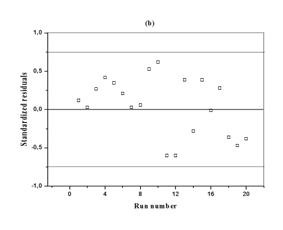
Figure 3 Diagnostic plots for glucose concentration
a) Residual versus predicted concentration
b) Residual versus run number
Optimization of dilute acid hydrolysis
Three dimensional (3D) response surface plots were generated to determine the optimum levels of the variables that were investigated in this study. The plots were generated by keeping one variable constant at the center point and varying the others within the experimental range. The resulting response surfaces showed the effect of sulfuric acid, substrate loading and time on the glucose concentration. The effects of the sulfuric acid concentration and substrate loading on the glucose concentration are shown in Figure 4A. An increase in the sulfuric acid concentration with substrate loading resulted in an increase in the glucose concentration until an optimum value of about 8.91 g/L, i.e., 9 % (v/v) acid concentration, 18 % (w/v) substrate loading. Generally, dilute acid can dissolve and recover most of the hemicellulose as dissolved sugars under low process severity.35,36 Consequently, the rate at which the glycosidic bonds are broken will increase.37,38 The effect of acid concentration and hydrolysis time on the glucose concentration is presented in Figure 4B. Maximum glucose concentration was observed in the zone of acid concentration near the central value of 8% and hydrolysis time range of 6.7 to 7.4 h and in the zone of acid concentration of 8.8 to 9.2% and hydrolysis time range of 0.6 to 1.2 h. The concentration of sugar increased with increase in acid concentration. A similar observation was reported by Amenaghawon et al.39 for the dilute acid hydrolysis of cassava bagasse. In another research, Rafiqul et al. 30 studied the dilute acid hydrolysis of Meranti wood sawdust (MSW) at a temperature ranging from 121 to 125°C, 2-6% sulfuric acid concentration and reaction time of 20-80 min. The authors reported that predicted xylose yield reduced with the increase of acid concentration, when residence time was held at 80 min and the reciprocal result was found with the low residence time (40 min). The maximum sugar was obtained at a temperature of 124°C, a time of 80 min and an acid concentration about 3.3%.
The Figure 4C exhibits the interactive effect of substrate loading and hydrolysis time on glucose concentration. As shown in the plot, optimal glucose concentration was observed under increased substrate loading near to 18%, and 1 h of hydrolysis time. Any further increase in the hydrolysis time led to no appreciable effect on the production of glucose. The glucose yield was observed to be higher at high substrate loading and low time hydrolysis. Validation of the experimental model was done to check the optimum conditions of acid hydrolysis of sawdust and to check the accuracy of the model. The final optimized hydrolysis conditions obtained with RSM were 8% (v/v) acid concentration, 16% (w/v) substrate loading and 2 h hydrolysis time (Table 2). The validity of the results predicted by the regression model was confirmed by carrying out repeated experiments under optimal hydrolysis conditions. The results obtained from two replications demonstrated that the average of the maximum glucose concentration (8.78 g/L) obtained was close to the predicted value (8.39 g/L) thus showing validity.
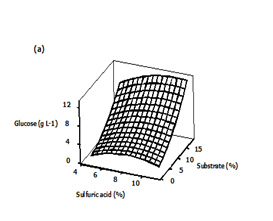
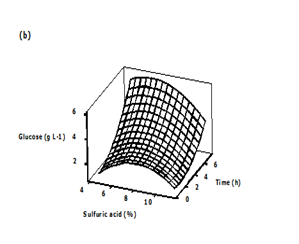
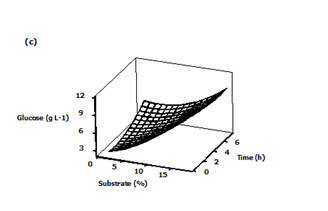
Figure 4 Three-dimensional surface plots showing the effect of different variables on glucose concentration
a) Effect of sulfuric acid and substrate loading
b) Effect of sulfuric acid and time
c) Effect of substrate loading and time.
Lactic acid production from sawdust hydrolysate
To determine the effect of wood sawdust hydrolysate on lactic acid production, batch fermentation was performedin conical flasks for 72 h. The production of lactic acid and substrate consumption are shown in Figure 5. Lactic acid production reached 9.87 g/L in 72 h with a yield of 1.1 g/g. Table 5 shows the comparison of lactic acid results of some independent researchers using Lactococcus lactis and different processes. The lactic-acid production value obtained is lower than most values that have been reported in the literature. For example, Shi et al.40 used immobilized Lactococcus lactis to obtain 142 g/L lactic acid from Artichoke;Nancib et al.41 reported 60.3 g/L lactic-acid concentration from date juice using a mixed culture of Lactobacillus casei and Lactococcus lactis. Other research results that have been reported include lactic-acid production using different strains like L. pentosus with lactic acid production of 9 g/L with a yield of 0.90 g/g from wheat-straw hemicellulose hydrolysates and 10 g/L with a yield of 0.61 g/g using L. brevis;42 Bacillus coagulans MXL-9 with lactic acid production of 33 g/L and a yield of 0.73 g/g from wood hemicellulose extracts (16); Bustos et al.43 reported 46.0 g/L lactic-acid concentration and yield of 0.78 g/g from vine-trimming hydrolysate using a L. pentosus strain; Buendo et al.18 reported 43.66 g/L lactic-acid concentration with a yield of 0.72 g/g from wood extract hydrolysate. Although, lactic acid production by L. lactis from this work was lower in terms of concentration, the maximum yield 1.1 is higher than those found by Meziane et al.44 and Laopaiboon et al.45 which were equal to 0.1 and 0.361 by respectively. The results obtained are in agreement with those reported by Jonglertjunya et al.46 who achieved a production of lactic acid of 10.6 g/L with yield of 1.4 g/g using sugarcane bagasses hydrolysate.
Microorganisms |
Substrates |
Lactic acid (g/L) |
Yield (Yp/s)a (g/g) |
References |
Immobilized Lactococcus lactis |
Artichoke |
142 |
- |
|
Mixed culture: (Lactobacillus casei and Lactococcus lactis) |
Date juice |
60.3 |
1.91 |
|
Lactococcus lactis |
OFI fruit juice |
32.5 |
0.63 |
|
Lactococcus lactis (10-1 JCM 7638) |
Xylose |
33 |
0.6 |
|
Lactococcus lactis |
Molasses |
40 |
- |
|
Lactococcus lactis (10-1) |
Sugarcane bagasse |
10.9 |
0.36 |
|
Lactococcus lactis |
Glucose and xylose |
10.6 |
1.4 |
|
Immobilized cells (Lactococcus lactis) |
Molasses and whey |
15.8 |
0.1 |
|
Lactococcus lactis |
Sawdust |
9.87 |
1.1 |
This work |
Table 5 Representative results reported in the literature for lactic acid production using Lactococcus lactis
a: Yield of lactic acid produced (g) to substrate consumed (g).
The hydrolysis of wood sawdust was carried out using dilute sulfuric acid according to a three variable central composite design. The optimum hydrolysis conditions are a sulfuric acid concentration of 8% (v/v), substrate loading of 16% (w/v), and hydrolysis time of 2 h. Under these conditions, the maximum concentration of glucose obtained (8.78 g/L) was close to the predicted value (8.39 g/L). So wood sawdust hydrolysate supplemented with yeast extract, was found to be a potential substrate for lactic acid production by Lactococcus lactis. The maximum lactic acid concentration obtained was 9.87 g/L, which is equivalent to a conversion yield of about 1.1 g/g.
None.
Authors declare there is no conflict of interest in publishing the article.

©2017 Nancib, et al. This is an open access article distributed under the terms of the, which permits unrestricted use, distribution, and build upon your work non-commercially.