Submit manuscript...
Journal of
eISSN: 2572-8466

Applied Biotechnology & Bioengineering

Research Article Volume 2 Issue 6

The thrombus to embolus transition and its contributing factors

Christie MC, Salinas MM

Department of Biomedical Engineering, Florida International University, USA

Correspondence: Michael C Christie, Department of Biomedical Engineering, The Engineering Center, Florida International University, 10555 West Flagler Street, EAS 2600, Miami, Florida 33199, USA, Tel 3053487392, Fax 3053486954

Received: March 12, 2017 | Published: April 17, 2017

Citation: Christie MC, Salinas MM. The thrombus to embolus transition and its contributing factors. J Appl Biotechnol Bioeng. 2017;2(6):237-247. DOI: 10.15406/jabb.2017.02.00051

Download PDF

Abstract

Thromboembolic events are some of the major causes of death in the United States. They must be carefully monitored in persons who are susceptible to thrombus formation due to hypercoagulability problems which may arise as a result of surgery or diseases such as sickle cell anemia, thalassemia, leukemia and diabetes. Successful diagnosis and treatment of thrombosis pose a real challenge to the medical field and there exists an urgency to develop more sophisticated methods for countering this condition. When thrombi detaches from the vessel wall, patients are at great risk of stroke events and even death. In an effort to gain a better understanding with regard to the thrombus to embolus transition, we have performed simulations through CFD-ACE+ computational engine in which we vary thrombus height, shape, location along the vessel wall, blood pressure and blood viscosity. Results of this simulation model suggest a higher likelihood for the thrombus to embolus transition as the thrombus height increases. Results also show that a thrombus is more likely to become mobile in hypertensive patients but is less likely to become mobile in sickle cell, diabetic and leukemic patients. This we explain is due to higher blood viscosities in these patients which result in lowered wall shear stresses. In addition, we confirm the hypothesis that clot shape influences the occurrence of the thrombus to embolus transition as pressure on the clot is shown to be substantially greater in radially asymmetric thrombi. Pressure profiles also suggest that prolonged exposure to high pressure, as in hypertension, increases the probability of initiation of the transition as the clot becomes fatigued and weakens, resulting in the completion of the thrombus to embolus transition when the hemodynamic forces overcome the adhesive forces in the system. Finally, we propose a “peel-off” type mechanism as an explanation of the process of transitioning from a thrombus to an embolus.

Keywords: stroke, thrombosis, hypertension, embolism, leukemia, diabetes

Abbreviations

SCD, sickle cell disease; RBCs, red blood cells; CGL, chronic granulocytic leukemia; WBCs, white blood cells; DVT, deep vein thrombosis; LMWH, low molecular weight heparin; ePTFE, expanded poly-tetra-fluoro-ethylene

Introduction

It is central to comprehend the origin and behavior of thrombus given that thrombosis in the coronary and cerebral circulations is one of the most frequent pathological events and it is one of the major causes of morbidity and death in Western culture.1-3 Various epidemiological studies reveal a correlation connecting myocardial infarction and clot mechanical properties.4-6 Also, it is worth mentioning that in the United States alone nearly sixty thousand people die of pulmonary embolism each year.7 Thrombus nucleation in the cardiovascular system can be triggered by vessel injury, excessive agglomeration of platelets or excessively high shear rates.8,9 These events can activate platelets making these release cytokines that stimulate platelet aggregation; simultaneously, as platelets come together, a series of reactions known as the coagulation cascade occur.10 In the coagulation cascade, the enzyme thrombin converts fibrinogen into fibrin fibers5,11 which are responsible for intertwining and reinforcing the platelet plug.12 Figure 1 shows the microscopic structure of a clot. Hypercoagulability states in patients suffering from blood genetic disorders such as sickle cell disease (SCD), leukemia, anemia, diabetes and thalassemia as well as pregnant women need to be carefully monitored for thrombus formation. In SCD, red blood cells (RBCs) adopt an anomalous, rigid, sickle shape which decreases the cells flexibility and results in their restricted movement through blood vessels.13-15 By using MRI techniques, it has been seen how sickle cells agglomerate around brain wall vessels which can easily lead to stroke.16,17

Hild et al.18 reported that an anomalous peripheral white blood cell count, as seen in leukemic patients, can increase blood viscosity due to an elevated cytocrit. In his article: “Hyperviscosity in Chronic Granulocytic Leukemia”, Hild et al.18 describes the case of a chronic granulocytic leukemia (CGL) patient with WBC count of 260,000/mm3 who developed ischemic necrosis in three fingers. Blood analysis of ten other people with CGL showed an increase in whole blood viscosity due to elevated counts of white blood cells (WBCs). Leukemia has also been attributed with Retinal hemorrhage, retinal vein thrombosis, myocardial infarction, acute limb ischemia and renal vein thrombosis.19,20,21 Thalassemia, another genetic blood disorder, is associated with hypercoagulable states and an increased incidence of thromboembolic episodes.22 β-thalassemia has been linked to venous thromboembolic events in deep vein of the limbs, portal vein and cerebral veins.23 Furthermore, although less common, thalassemia is also associated with thrombotic strokes, transient ischemic attacks and myocardial infarction.22,24 Thomas et al.25 explains that during pregnancy the coagulation system is subjected to physiological changes which could potentially lead to a thrombotic event. Throughout pregnancy, there are augmented levels of coagulation factors for example fibrinogen and factor VIII and there are diminished levels of coagulation inhibitors such as protein S.24-26 In diabetes mellitus whole blood viscosity increases due to elevated blood glucose levels. Patients suffering from diabetes are at a higher risk from suffering severe organ microcirculation problems in kidneys and eyes.27,28 Furthermore, they can develop cardiovascular complications for instance pulmonary embolism, myocardial infarction or stroke.28-30

Complications with the coagulation process can lead to the development of thrombus in the wall vessels of the cardiovascular system. One example is deep vein thrombosis (DVT). DVT is a condition in which blood clots form in veins that are deep inside the body.4,7 The greater part of DVT cases occur in the deep veins of the legs such as the femoral, popliteal, anterior tibial, posterior tibial and peroneal veins.10,31 DVT is also known as the economy class syndrome due to the link between air travel and the occurrence of thrombosis in deep veins.32,33 Figure 2 depicts the superficial and deep veins of the legs. Low levels of aspirin are routinely used in the treatment of vessel thrombosis due to its anti-platelet bond properties.13,34,35 Also, low molecular weight heparin (LMWH) is broadly used as an injectable anticoagulant mediator, for the reason that it avoids clot nucleation and restrains supplementary growth of existing thrombus.14,36 In patients with extreme deep vein thrombosis where anti-platelet and anticoagulant therapy has failed, a filter is permanently placed into the inferior vena cava25,37 and it works as a clot trap should the embolus break from thrombus. Thrombolytic drugs can be accompanied by ultrasound or heat inducing therapy due to the fact that they help to dissolve the thrombus more effectively and faster.16 In addition, blood pressure is lowered for the reason that higher pressures could precipitate the transition from thrombus to embolus.28 However, lowering blood pressure should be carefully monitored due to the fact that unphysiological low pressures can cause fainting, shock or even death.12-14

In this report we will investigate the peel off mechanism of thrombus and how clot height, size, location, blood viscosity and pressure accelerates or delays such mechanism. Our hypothesis is that at t>>0, thrombus mechanical properties weaken and failure happens after the activation of the peel off mechanism at the lower end of the clot. Shear stresses acting on the thrombus continue to peel the thrombus further off followed by its transition to embolus, as shown in the Figure 3. We pretend to create a platform of information regarding thrombus to embolus transition and its contribution factors such as height, attachment area, shape and location along the vessel length. This study was done by using the computational fluid dynamics solver CFD-ACE+ which is an industrial software package offered by CFDRC Group Company. A cylindrical geometry was created on CFD-GEOM and it is composed of three independent meshes in order to represent the blood flow, thrombus occlusion and wall vessel.

Model description

 In order to represent the inner lumen of the vessel, an X-Y plane 10 mm (D) circle was created with center (0, 0) and it was extruded 300 mm in the Z-direction. A 5 mm (R) semi circle with center (0, 5) was revolved along its own axis at 90 and -90 degrees and translated in the Z- direction. Both geometries were intersected and trimmed in order to create an occluded cylinder representing the flow of blood when it passes through a thrombus. This structure was shelled and meshed with unstructured domain with tetrahedral 0.845 size cells. The thrombus mesh was constructed by forming a four-sided surface at the occlusion site and it was done with tetrahedral 0.645 size cells. In order to represent the wall vessel, an X-Y plane 13 mm (D) circle was created with center (0,0) and divided in half; then, two 1.5 mm (Thickness) four-sided surfaces were created and translated 30 mm towards the other end of the cylinder. This allows the vessel wall geometry to integrate the already created inner grid as part of its domain. Later, the wall vessel was meshed with tetrahedral cells of 1.2 sizes. By using the CFD-ACE+ database, each of the three meshes can obtain properties of blood, thrombus and vessel wall, respectively. CFD-ACE+ database allows to record density, viscosity, Young’s modulus, thermal expansion and heat capacity. In this simulation we will use expanded poly-tetra-fluoro-ethylene (ePTFE) to construct the vessel wall, because it shows mechanical properties which are similar to vein walls.38,39 These properties are then incorporated to the model at the volume conditions engine (Table 1-3).

Material

ρ (Kg/m3)

µ (centi-Poise)

E (MPa)

Poisson’s Ratio

Blood

10606

3.56

-

-

Thrombi

-

-

15006,39

-

ePTFE

15509

-

27009,8

0.38

Table 1 Shows the physical and mechanical properties of the materials used in the simulation.

Condition

Venous Pressure (mmHg)

Normal

2033,34

Pre-hypertensive

236,1

Hypertensive

2733,19

Table 2 Shows the blood pressure values uses throughout the simulations.

Condition

Blood Viscosity (cPoise)

Normal

3.56

Sickle Cell Disease

4.235

Leukemia

6.217,23

Diabetes

4.043,25

Table 3 Shows the viscosity values for normal, SCD, leukemia and diabetes blood used throughout the simulations.

Mathematical model

Momentum conservation

 Newton’s second law states that the time rate of change of the momentum of a fluid element is equal to the sum of the forces on the element. There are two types of forces acting on this model: Surface forces comprise pressure and viscosity while Body forces refer to gravity and momentum resistance. The body forces are incorporated as source expressions. The x-component of the momentum equation is established by setting the rate of change of x-momentum of the fluid equal to the total force in the x-direction on the element due to surface stresses plus the rate of increase of x-momentum due to sources:

(ρμ) τ +(ρ V μ)= (ρ+ τ χχ ) x + τ γχ y + τ zχ z + S Μχ MathType@MTEF@5@5@+= feaagKart1ev2aaatCvAUfeBSjuyZL2yd9gzLbvyNv2CaerbuLwBLn hiov2DGi1BTfMBaeXatLxBI9gBaerbd9wDYLwzYbItLDharqqtubsr 4rNCHbGeaGWj0Jf9crFfpeea0xh9v8qiW7rqqrFfpeea0xe9Lq=Jc9 vqaqpepm0xbba9pwe9Q8fs0=yqaqpepae9pg0FirpepeKkFr0xfr=x fr=xb9adbaqaaeGaciGaaiaabeqaamaabaabaaGcbaqcfa4aaSaaae aacqGHciITcaGGOaGaeqyWdiNaeqiVd0MaaiykaaqaaiabgkGi2kab es8a0baacqGHRaWkcqGHhis0cqGHIaYTcaGGOaGaeqyWdiNabmOvay aalaGaeqiVd0Maaiykaiabg2da9maalaaabaGaeyOaIyRaaiikaiab gkHiTiabeg8aYjabgUcaRiabes8a0naaBaaabaGaeq4XdmMaeq4Xdm gabeaacaGGPaaabaGaeyOaIyRaamiEaaaacqGHRaWkdaWcaaqaaiab gkGi2kabes8a0naaBaaabaGaeq4SdCMaeq4XdmgabeaaaeaacqGHci ITcaWG5baaaiabgUcaRmaalaaabaGaeyOaIyRaeqiXdq3aaSbaaeaa caWG6bGaeq4XdmgabeaaaeaacqGHciITcaWG6baaaiabgUcaRiaado fadaWgaaqaaiabfY5anjabeE8aJbqabaaaaa@732B@ (3.1.1)

(ρν) τ +(ρ V ν)= τ xy x + (ρ+ τ yy ) y + τ zy z + S Μy MathType@MTEF@5@5@+= feaagKart1ev2aaatCvAUfeBSjuyZL2yd9gzLbvyNv2CaerbuLwBLn hiov2DGi1BTfMBaeXatLxBI9gBaerbd9wDYLwzYbItLDharqqtubsr 4rNCHbGeaGWj0Jf9crFfpeea0xh9v8qiW7rqqrFfpeea0xe9Lq=Jc9 vqaqpepm0xbba9pwe9Q8fs0=yqaqpepae9pg0FirpepeKkFr0xfr=x fr=xb9adbaqaaeGaciGaaiaabeqaamaabaabaaGcbaqcfa4aaSaaae aacqGHciITcaGGOaGaeqyWdiNaeqyVd4MaaiykaaqaaiabgkGi2kab es8a0baacqGHRaWkcqGHhis0cqGHIaYTcaGGOaGaeqyWdiNabmOvay aalaGaeqyVd4Maaiykaiabg2da9maalaaabaGaeyOaIyRaeqiXdq3a aSbaaeaacaWG4bGaamyEaaqabaaabaGaeyOaIyRaamiEaaaacqGHRa WkdaWcaaqaaiabgkGi2kaacIcacqGHsislcqaHbpGCcqGHRaWkcqaH epaDdaWgaaqaaiaadMhacaWG5baabeaacaGGPaaabaGaeyOaIyRaam yEaaaacqGHRaWkdaWcaaqaaiabgkGi2kabes8a0naaBaaabaGaamOE aiaadMhaaeqaaaqaaiabgkGi2kaadQhaaaGaey4kaSIaam4uamaaBa aabaGaeuiNd0KaamyEaaqabaaaaa@6EE8@ (3.1.2)

(ρw) τ +(ρ V w)= τ xz x + τ yz y + (ρ+ τ zz ) z + S Μz MathType@MTEF@5@5@+= feaagKart1ev2aaatCvAUfeBSjuyZL2yd9gzLbvyNv2CaerbuLwBLn hiov2DGi1BTfMBaeXatLxBI9gBaerbd9wDYLwzYbItLDharqqtubsr 4rNCHbGeaGWj0Jf9crFfpeea0xh9v8qiW7rqqrFfpeea0xe9Lq=Jc9 vqaqpepm0xbba9pwe9Q8fs0=yqaqpepae9pg0FirpepeKkFr0xfr=x fr=xb9adbaqaaeGaciGaaiaabeqaamaabaabaaGcbaqcfa4aaSaaae aacqGHciITcaGGOaGaeqyWdiNaam4DaiaacMcaaeaacqGHciITcqaH epaDaaGaey4kaSIaey4bIeTaeyOiGCRaaiikaiabeg8aYjqadAfaga WcaiaadEhacaGGPaGaeyypa0ZaaSaaaeaacqGHciITcqaHepaDdaWg aaqaaiaadIhacaWG6baabeaaaeaacqGHciITcaWG4baaaiabgUcaRm aalaaabaGaeyOaIyRaeqiXdq3aaSbaaeaacaWG5bGaamOEaaqabaaa baGaeyOaIyRaamyEaaaacqGHRaWkdaWcaaqaaiabgkGi2kaacIcacq GHsislcqaHbpGCcqGHRaWkcqaHepaDdaWgaaqaaiaadQhacaWG6baa beaacaGGPaaabaGaeyOaIyRaamOEaaaacqGHRaWkcaWGtbWaaSbaae aacqqHCoqtcaWG6baabeaaaaa@6D74@ (3.1.3)

In these equations, p is the static pressure and τ ij MathType@MTEF@5@5@+= feaagKart1ev2aaatCvAUfeBSjuyZL2yd9gzLbvyNv2CaerbuLwBLn hiov2DGi1BTfMBaeXatLxBI9gBaerbd9wDYLwzYbItLDharqqtubsr 4rNCHbGeaGWj0Jf9crFfpeea0xh9v8qiW7rqqrFfpeea0xe9Lq=Jc9 vqaqpepm0xbba9pwe9Q8fs0=yqaqpepae9pg0FirpepeKkFr0xfr=x fr=xb9adbaqaaeGaciGaaiaabeqaamaabaabaaGcbaqcfaOaeqiXdq 3aaSbaaeaacaWGPbGaamOAaaqabaaaaa@3C58@  is the viscous stress tensor.

Navier-stokes equations

The momentum equations, given above, contain the unknown viscous stress components τ ij MathType@MTEF@5@5@+= feaagKart1ev2aaatCvAUfeBSjuyZL2yd9gzLbvyNv2CaerbuLwBLn hiov2DGi1BTfMBaeXatLxBI9gBaerbd9wDYLwzYbItLDharqqtubsr 4rNCHbGeaGWj0Jf9crFfpeea0xh9v8qiW7rqqrFfpeea0xe9Lq=Jc9 vqaqpepm0xbba9pwe9Q8fs0=yqaqpepae9pg0FirpepeKkFr0xfr=x fr=xb9adbaqaaeGaciGaaiaabeqaamaabaabaaGcbaqcfaOaeqiXdq 3aaSbaaeaacaWGPbGaamOAaaqabaaaaa@3C58@ therefore a model must be provided to define the viscous stresses.40 In Newtonian flows, the viscous stresses are proportional to the deformation rates of the fluid element and they can be related to velocity gradients to produce the following shear stress terms:

χχ =2μ μ χ 2 3 μ( V ) MathType@MTEF@5@5@+= feaagKart1ev2aaatCvAUfeBSjuyZL2yd9gzLbvyNv2CaerbuLwBLn hiov2DGi1BTfMBaeXatLxBI9gBaerbd9wDYLwzYbItLDharqqtubsr 4rNCHbGeaGWj0Jf9crFfpeea0xh9v8qiW7rqqrFfpeea0xe9Lq=Jc9 vqaqpepm0xbba9pwe9Q8fs0=yqaqpepae9pg0FirpepeKkFr0xfr=x fr=xb9adbaqaaeGaciGaaiaabeqaamaabaabaaGcbaqcfa4aaSbaae aacqaHhpWycqaHhpWyaeqaaiabg2da9iaaikdacqaH8oqBdaWcaaqa aiabgkGi2kabeY7aTbqaaiabgkGi2kabeE8aJbaacqGHsisldaWcaa qaaiaaikdaaeaacaaIZaaaaiabeY7aTjaacIcacqGHhis0cqGHIaYT ceWGwbGbaSaacaGGPaaaaa@4F62@ (3.2.1)

yy =2μ ν y 2 3 μ( V ) MathType@MTEF@5@5@+= feaagKart1ev2aaatCvAUfeBSjuyZL2yd9gzLbvyNv2CaerbuLwBLn hiov2DGi1BTfMBaeXatLxBI9gBaerbd9wDYLwzYbItLDharqqtubsr 4rNCHbGeaGWj0Jf9crFfpeea0xh9v8qiW7rqqrFfpeea0xe9Lq=Jc9 vqaqpepm0xbba9pwe9Q8fs0=yqaqpepae9pg0FirpepeKkFr0xfr=x fr=xb9adbaqaaeGaciGaaiaabeqaamaabaabaaGcbaqcfa4aaSbaae aacaWG5bGaamyEaaqabaGaeyypa0JaaGOmaiabeY7aTnaalaaabaGa eyOaIyRaeqyVd4gabaGaeyOaIyRaamyEaaaacqGHsisldaWcaaqaai aaikdaaeaacaaIZaaaaiabeY7aTjaacIcacqGHhis0cqGHIaYTceWG wbGbaSaacaGGPaaaaa@4D39@ (3.2.2)

zz =2μ w z 2 3 μ( V ) MathType@MTEF@5@5@+= feaagKart1ev2aaatCvAUfeBSjuyZL2yd9gzLbvyNv2CaerbuLwBLn hiov2DGi1BTfMBaeXatLxBI9gBaerbd9wDYLwzYbItLDharqqtubsr 4rNCHbGeaGWj0Jf9crFfpeea0xh9v8qiW7rqqrFfpeea0xe9Lq=Jc9 vqaqpepm0xbba9pwe9Q8fs0=yqaqpepae9pg0FirpepeKkFr0xfr=x fr=xb9adbaqaaeGaciGaaiaabeqaamaabaabaaGcbaqcfa4aaSbaae aacaWG6bGaamOEaaqabaGaeyypa0JaaGOmaiabeY7aTnaalaaabaGa eyOaIyRaam4DaaqaaiabgkGi2kaadQhaaaGaeyOeI0YaaSaaaeaaca aIYaaabaGaaG4maaaacqaH8oqBcaGGOaGaey4bIeTaeyOiGCRabmOv ayaalaGaaiykaaaa@4C80@ (3.2.3)

χγ = τ γz =μ[ μ γ + ν χ ] MathType@MTEF@5@5@+= feaagKart1ev2aaatCvAUfeBSjuyZL2yd9gzLbvyNv2CaerbuLwBLn hiov2DGi1BTfMBaeXatLxBI9gBaerbd9wDYLwzYbItLDharqqtubsr 4rNCHbGeaGWj0Jf9crFfpeea0xh9v8qiW7rqqrFfpeea0xe9Lq=Jc9 vqaqpepm0xbba9pwe9Q8fs0=yqaqpepae9pg0FirpepeKkFr0xfr=x fr=xb9adbaqaaeGaciGaaiaabeqaamaabaabaaGcbaqcfa4aaSbaae aacqaHhpWycqaHZoWzaeqaaiabg2da9iabes8a0naaBaaabaGaeq4S dCMaamOEaaqabaGaeyypa0JaeqiVd02aamWaaeaadaWcaaqaaiabgk Gi2kabeY7aTbqaaiabgkGi2kabeo7aNbaacqGHRaWkdaWcaaqaaiab gkGi2kabe27aUbqaaiabgkGi2kabeE8aJbaaaiaawUfacaGLDbaaaa a@53BA@ (3.2.4)

χz = τ zχ =μ[ μ z + w χ ] MathType@MTEF@5@5@+= feaagKart1ev2aaatCvAUfeBSjuyZL2yd9gzLbvyNv2CaerbuLwBLn hiov2DGi1BTfMBaeXatLxBI9gBaerbd9wDYLwzYbItLDharqqtubsr 4rNCHbGeaGWj0Jf9crFfpeea0xh9v8qiW7rqqrFfpeea0xe9Lq=Jc9 vqaqpepm0xbba9pwe9Q8fs0=yqaqpepae9pg0FirpepeKkFr0xfr=x fr=xb9adbaqaaeGaciGaaiaabeqaamaabaabaaGcbaqcfa4aaSbaae aacqaHhpWycaWG6baabeaacqGH9aqpcqaHepaDdaWgaaqaaiaadQha cqaHhpWyaeqaaiabg2da9iabeY7aTnaadmaabaWaaSaaaeaacqGHci ITcqaH8oqBaeaacqGHciITcaWG6baaaiabgUcaRmaalaaabaGaeyOa IyRaam4DaaqaaiabgkGi2kabeE8aJbaaaiaawUfacaGLDbaaaaa@51BE@ (3.2.5)

yz = τ zy =μ[ ν z + w y ] MathType@MTEF@5@5@+= feaagKart1ev2aaatCvAUfeBSjuyZL2yd9gzLbvyNv2CaerbuLwBLn hiov2DGi1BTfMBaeXatLxBI9gBaerbd9wDYLwzYbItLDharqqtubsr 4rNCHbGeaGWj0Jf9crFfpeea0xh9v8qiW7rqqrFfpeea0xe9Lq=Jc9 vqaqpepm0xbba9pwe9Q8fs0=yqaqpepae9pg0FirpepeKkFr0xfr=x fr=xb9adbaqaaeGaciGaaiaabeqaamaabaabaaGcbaqcfa4aaSbaae aacaWG5bGaamOEaaqabaGaeyypa0JaeqiXdq3aaSbaaeaacaWG6bGa amyEaaqabaGaeyypa0JaeqiVd02aamWaaeaadaWcaaqaaiabgkGi2k abe27aUbqaaiabgkGi2kaadQhaaaGaey4kaSYaaSaaaeaacqGHciIT caWG3baabaGaeyOaIyRaamyEaaaaaiaawUfacaGLDbaaaaa@4F95@ (3.2.6)

Substitution of the above shear stress terms into the momentum equations yields the Navier-Stokes equations:

(ρμ) τ +(ρ V μ)= ρ χ + x [ 2μ μ χ 2 3 μ( V ) ]+ γ [ μ[ μ γ + ν χ ] ]+ z [ μ[ μ z + w χ ] ]+ S Μχ MathType@MTEF@5@5@+= feaagKart1ev2aaatCvAUfeBSjuyZL2yd9gzLbvyNv2CaerbuLwBLn hiov2DGi1BTfMBaeXatLxBI9gBaerbd9wDYLwzYbItLDharqqtubsr 4rNCHbGeaGWj0Jf9crFfpeea0xh9v8qiW7rqqrFfpeea0xe9Lq=Jc9 vqaqpepm0xbba9pwe9Q8fs0=yqaqpepae9pg0FirpepeKkFr0xfr=x fr=xb9adbaqaaeGaciGaaiaabeqaamaabaabaaGceaqabeaajuaGda WcaaqaaiabgkGi2kaacIcacqaHbpGCcqaH8oqBcaGGPaaabaGaeyOa IyRaeqiXdqhaaiabgUcaRiabgEGirlabgkci3kaacIcacqaHbpGCce WGwbGbaSaacqaH8oqBcaGGPaGaeyypa0JaeyOeI0YaaSaaaeaacqGH ciITcqaHbpGCaeaacqGHciITcqaHhpWyaaGaey4kaSYaaSaaaeaacq GHciITaeaacqGHciITcaWG4baaamaadmaabaGaaGOmaiabeY7aTnaa laaabaGaeyOaIyRaeqiVd0gabaGaeyOaIyRaeq4XdmgaaiabgkHiTm aalaaabaGaaGOmaaqaaiaaiodaaaGaeqiVd0MaaiikaiabgEGirlab gkci3kqadAfagaWcaiaacMcaaiaawUfacaGLDbaacqGHRaWkaOqaaK qbaoaalaaabaGaeyOaIylabaGaeyOaIyRaeq4SdCgaamaadmaabaGa eqiVd02aamWaaeaadaWcaaqaaiabgkGi2kabeY7aTbqaaiabgkGi2k abeo7aNbaacqGHRaWkdaWcaaqaaiabgkGi2kabe27aUbqaaiabgkGi 2kabeE8aJbaaaiaawUfacaGLDbaaaiaawUfacaGLDbaacqGHRaWkda WcaaqaaiabgkGi2cqaaiabgkGi2kaadQhaaaWaamWaaeaacqaH8oqB daWadaqaamaalaaabaGaeyOaIyRaeqiVd0gabaGaeyOaIyRaamOEaa aacqGHRaWkdaWcaaqaaiabgkGi2kaadEhaaeaacqGHciITcqaHhpWy aaaacaGLBbGaayzxaaaacaGLBbGaayzxaaGaey4kaSIaam4uamaaBa aabaGaeuiNd0Kaeq4Xdmgabeaaaaaa@A13F@ (3.2.7)

(ρν) τ +(ρ V ν)= ρ y + χ [ μ[ μ γ + ν χ ] ]+ γ [ 2μ ν y 2 3 μ( V ) ]+ z [ μ[ ν z + w y ] ]+ S Μγ MathType@MTEF@5@5@+= feaagKart1ev2aaatCvAUfeBSjuyZL2yd9gzLbvyNv2CaerbuLwBLn hiov2DGi1BTfMBaeXatLxBI9gBaerbd9wDYLwzYbItLDharqqtubsr 4rNCHbGeaGWj0Jf9crFfpeea0xh9v8qiW7rqqrFfpeea0xe9Lq=Jc9 vqaqpepm0xbba9pwe9Q8fs0=yqaqpepae9pg0FirpepeKkFr0xfr=x fr=xb9adbaqaaeGaciGaaiaabeqaamaabaabaaGceaqabeaajuaGda WcaaqaaiabgkGi2kaacIcacqaHbpGCcqaH9oGBcaGGPaaabaGaeyOa IyRaeqiXdqhaaiabgUcaRiabgEGirlabgkci3kaacIcacqaHbpGCce WGwbGbaSaacqaH9oGBcaGGPaGaeyypa0JaeyOeI0YaaSaaaeaacqGH ciITcqaHbpGCaeaacqGHciITcaWG5baaaiabgUcaRmaalaaabaGaey OaIylabaGaeyOaIyRaeq4XdmgaamaadmaabaGaeqiVd02aamWaaeaa daWcaaqaaiabgkGi2kabeY7aTbqaaiabgkGi2kabeo7aNbaacqGHRa WkdaWcaaqaaiabgkGi2kabe27aUbqaaiabgkGi2kabeE8aJbaaaiaa wUfacaGLDbaaaiaawUfacaGLDbaacqGHRaWkaOqaaKqbaoaalaaaba GaeyOaIylabaGaeyOaIyRaeq4SdCgaamaadmaabaGaaGOmaiabeY7a TnaalaaabaGaeyOaIyRaeqyVd4gabaGaeyOaIyRaamyEaaaacqGHsi sldaWcaaqaaiaaikdaaeaacaaIZaaaaiabeY7aTjaacIcacqGHhis0 cqGHIaYTceWGwbGbaSaacaGGPaaacaGLBbGaayzxaaGaey4kaSYaaS aaaeaacqGHciITaeaacqGHciITcaWG6baaamaadmaabaGaeqiVd02a amWaaeaadaWcaaqaaiabgkGi2kabe27aUbqaaiabgkGi2kaadQhaaa Gaey4kaSYaaSaaaeaacqGHciITcaWG3baabaGaeyOaIyRaamyEaaaa aiaawUfacaGLDbaaaiaawUfacaGLDbaacqGHRaWkcaWGtbWaaSbaae aacqqHCoqtcqaHZoWzaeqaaaaaaa@9FC6@ (3.2.8)

(ρw) τ +(ρ V w)= ρ z + x [ μ[ μ z + w x ] ]+ γ [ μ[ ν z + w x ] ]+ z [ 2μ w y 2 3 μ( V ) ]+ S Μz MathType@MTEF@5@5@+= feaagKart1ev2aaatCvAUfeBSjuyZL2yd9gzLbvyNv2CaerbuLwBLn hiov2DGi1BTfMBaeXatLxBI9gBaerbd9wDYLwzYbItLDharqqtubsr 4rNCHbGeaGWj0Jf9crFfpeea0xh9v8qiW7rqqrFfpeea0xe9Lq=Jc9 vqaqpepm0xbba9pwe9Q8fs0=yqaqpepae9pg0FirpepeKkFr0xfr=x fr=xb9adbaqaaeGaciGaaiaabeqaamaabaabaaGceaqabeaajuaGda WcaaqaaiabgkGi2kaacIcacqaHbpGCcaWG3bGaaiykaaqaaiabgkGi 2kabes8a0baacqGHRaWkcqGHhis0cqGHIaYTcaGGOaGaeqyWdiNabm OvayaalaGaam4DaiaacMcacqGH9aqpcqGHsisldaWcaaqaaiabgkGi 2kabeg8aYbqaaiabgkGi2kaadQhaaaGaey4kaSYaaSaaaeaacqGHci ITaeaacqGHciITcaWG4baaamaadmaabaGaeqiVd02aamWaaeaadaWc aaqaaiabgkGi2kabeY7aTbqaaiabgkGi2kaadQhaaaGaey4kaSYaaS aaaeaacqGHciITcaWG3baabaGaeyOaIyRaamiEaaaaaiaawUfacaGL DbaaaiaawUfacaGLDbaacqGHRaWkaOqaaKqbaoaalaaabaGaeyOaIy labaGaeyOaIyRaeq4SdCgaamaadmaabaGaeqiVd02aamWaaeaadaWc aaqaaiabgkGi2kabe27aUbqaaiabgkGi2kaadQhaaaGaey4kaSYaaS aaaeaacqGHciITcaWG3baabaGaeyOaIyRaamiEaaaaaiaawUfacaGL DbaaaiaawUfacaGLDbaacqGHRaWkdaWcaaqaaiabgkGi2cqaaiabgk Gi2kaadQhaaaWaamWaaeaacaaIYaGaeqiVd02aaSaaaeaacqGHciIT caWG3baabaGaeyOaIyRaamyEaaaacqGHsisldaWcaaqaaiaaikdaae aacaaIZaaaaiabeY7aTjaacIcacqGHhis0cqGHIaYTceWGwbGbaSaa caGGPaaacaGLBbGaayzxaaGaey4kaSIaam4uamaaBaaabaGaeuiNd0 KaamOEaaqabaaaaaa@9A12@ (3.2.9)

By rearranging these equations and moving the smaller contributions of the viscous stress terms to the momentum source term, we can rewrite the Navier-Stokes equations in a more useful form:

(ρμ) τ +(ρ V μ)= ρ χ +(μ V μ)+ S Μχ MathType@MTEF@5@5@+= feaagKart1ev2aaatCvAUfeBSjuyZL2yd9gzLbvyNv2CaerbuLwBLn hiov2DGi1BTfMBaeXatLxBI9gBaerbd9wDYLwzYbItLDharqqtubsr 4rNCHbGeaGWj0Jf9crFfpeea0xh9v8qiW7rqqrFfpeea0xe9Lq=Jc9 vqaqpepm0xbba9pwe9Q8fs0=yqaqpepae9pg0FirpepeKkFr0xfr=x fr=xb9adbaqaaeGaciGaaiaabeqaamaabaabaaGcbaqcfa4aaSaaae aacqGHciITcaGGOaGaeqyWdiNaeqiVd0MaaiykaaqaaiabgkGi2kab es8a0baacqGHRaWkcqGHhis0cqGHIaYTcaGGOaGaeqyWdiNabmOvay aalaGaeqiVd0Maaiykaiabg2da9iabgkHiTmaalaaabaGaeyOaIyRa eqyWdihabaGaeyOaIyRaeq4XdmgaaiabgUcaRiabgEGirlabgkci3k aacIcacqaH8oqBceWGwbGbaSaacqaH8oqBcaGGPaGaey4kaSIaam4u amaaBaaabaGaeuiNd0Kaeq4Xdmgabeaaaaa@629C@ (3.2.10)

(ρv) τ +(ρ V v)= ρ y +(μ V v)+ S Μy MathType@MTEF@5@5@+= feaagKart1ev2aaatCvAUfeBSjuyZL2yd9gzLbvyNv2CaerbuLwBLn hiov2DGi1BTfMBaeXatLxBI9gBaerbd9wDYLwzYbItLDharqqtubsr 4rNCHbGeaGWj0Jf9crFfpeea0xh9v8qiW7rqqrFfpeea0xe9Lq=Jc9 vqaqpepm0xbba9pwe9Q8fs0=yqaqpepae9pg0FirpepeKkFr0xfr=x fr=xb9adbaqaaeGaciGaaiaabeqaamaabaabaaGcbaqcfa4aaSaaae aacqGHciITcaGGOaGaeqyWdiNaamODaiaacMcaaeaacqGHciITcqaH epaDaaGaey4kaSIaey4bIeTaeyOiGCRaaiikaiabeg8aYjqadAfaga WcaiaadAhacaGGPaGaeyypa0JaeyOeI0YaaSaaaeaacqGHciITcqaH bpGCaeaacqGHciITcaWG5baaaiabgUcaRiabgEGirlabgkci3kaacI cacqaH8oqBceWGwbGbaSaacaWG2bGaaiykaiabgUcaRiaadofadaWg aaqaaiabfY5anjaadMhaaeqaaaaa@5EF9@ (3.2.11)

(ρw) τ +(ρ V w)= ρ z +(μ V w)+ S Μz MathType@MTEF@5@5@+= feaagKart1ev2aaatCvAUfeBSjuyZL2yd9gzLbvyNv2CaerbuLwBLn hiov2DGi1BTfMBaeXatLxBI9gBaerbd9wDYLwzYbItLDharqqtubsr 4rNCHbGeaGWj0Jf9crFfpeea0xh9v8qiW7rqqrFfpeea0xe9Lq=Jc9 vqaqpepm0xbba9pwe9Q8fs0=yqaqpepae9pg0FirpepeKkFr0xfr=x fr=xb9adbaqaaeGaciGaaiaabeqaamaabaabaaGcbaqcfa4aaSaaae aacqGHciITcaGGOaGaeqyWdiNaam4DaiaacMcaaeaacqGHciITcqaH epaDaaGaey4kaSIaey4bIeTaeyOiGCRaaiikaiabeg8aYjqadAfaga WcaiaadEhacaGGPaGaeyypa0JaeyOeI0YaaSaaaeaacqGHciITcqaH bpGCaeaacqGHciITcaWG6baaaiabgUcaRiabgEGirlabgkci3kaacI cacqaH8oqBceWGwbGbaSaacaWG3bGaaiykaiabgUcaRiaadofadaWg aaqaaiabfY5anjaadQhaaeqaaaaa@5EFE@ (3.2.12)

Pressure forces

Pressure forces are calculated in the following manner:

P x =A×F C x ×P MathType@MTEF@5@5@+= feaagKart1ev2aaatCvAUfeBSjuyZL2yd9gzLbvyNv2CaerbuLwBLn hiov2DGi1BTfMBaeXatLxBI9gBaerbd9wDYLwzYbItLDharqqtubsr 4rNCHbGeaGWj0Jf9crFfpeea0xh9v8qiW7rqqrFfpeea0xe9Lq=Jc9 vqaqpepm0xbba9pwe9Q8fs0=yqaqpepae9pg0FirpepeKkFr0xfr=x fr=xb9adbaqaaeGaciGaaiaabeqaamaabaabaaGcbaqcfaOaamiuam aaBaaabaGaamiEaaqabaGaeyypa0JaamyqaiabgEna0kaadAeacaWG dbWaaSbaaeaacaWG4baabeaacqGHxdaTcaWGqbaaaa@4408@ (3.3.1)

P y =A×F C y ×p MathType@MTEF@5@5@+= feaagKart1ev2aaatCvAUfeBSjuyZL2yd9gzLbvyNv2CaerbuLwBLn hiov2DGi1BTfMBaeXatLxBI9gBaerbd9wDYLwzYbItLDharqqtubsr 4rNCHbGeaGWj0Jf9crFfpeea0xh9v8qiW7rqqrFfpeea0xe9Lq=Jc9 vqaqpepm0xbba9pwe9Q8fs0=yqaqpepae9pg0FirpepeKkFr0xfr=x fr=xb9adbaqaaeGaciGaaiaabeqaamaabaabaaGcbaqcfaOaamiuam aaBaaabaGaamyEaaqabaGaeyypa0JaamyqaiabgEna0kaadAeacaWG dbWaaSbaaeaacaWG5baabeaacqGHxdaTcaWGWbaaaa@442A@  (3.3.2)

P z =A×F C z ×P MathType@MTEF@5@5@+= feaagKart1ev2aaatCvAUfeBSjuyZL2yd9gzLbvyNv2CaerbuLwBLn hiov2DGi1BTfMBaeXatLxBI9gBaerbd9wDYLwzYbItLDharqqtubsr 4rNCHbGeaGWj0Jf9crFfpeea0xh9v8qiW7rqqrFfpeea0xe9Lq=Jc9 vqaqpepm0xbba9pwe9Q8fs0=yqaqpepae9pg0FirpepeKkFr0xfr=x fr=xb9adbaqaaeGaciGaaiaabeqaamaabaabaaGcbaqcfaOaamiuam aaBaaabaGaamOEaaqabaGaeyypa0JaamyqaiabgEna0kaadAeacaWG dbWaaSbaaeaacaWG6baabeaacqGHxdaTcaWGqbaaaa@440C@ (3.3.3)

Where A is the face area, FC is the face normal x-component, y-component, or z-component and P is the pressure. The shear forces are calculated in the following manner:

F sh_x = μ 1 ×A× V x_rel x N MathType@MTEF@5@5@+= feaagKart1ev2aaatCvAUfeBSjuyZL2yd9gzLbvyNv2CaerbuLwBLn hiov2DGi1BTfMBaeXatLxBI9gBaerbd9wDYLwzYbItLDharqqtubsr 4rNCHbGeaGWj0Jf9crFfpeea0xh9v8qiW7rqqrFfpeea0xe9Lq=Jc9 vqaqpepm0xbba9pwe9Q8fs0=yqaqpepae9pg0FirpepeKkFr0xfr=x fr=xb9adbaqaaeGaciGaaiaabeqaamaabaabaaGcbaqcfaOaamOram aaBaaabaGaam4CaiaadIgacaGGFbGaamiEaaqabaGaeyypa0ZaaSaa aeaacqaH8oqBdaWgaaqaaiaaigdaaeqaaiabgEna0kaadgeacqGHxd aTcaWGwbWaaSbaaeaacaWG4bGaai4xaiaadkhacaWGLbGaamiBaaqa baaabaGaamiEamaaBaaabaGaamOtaaqabaaaaaaa@4D81@ (3.3.4)

F sh_y = μ 1 ×A× V y_rel y N MathType@MTEF@5@5@+= feaagKart1ev2aaatCvAUfeBSjuyZL2yd9gzLbvyNv2CaerbuLwBLn hiov2DGi1BTfMBaeXatLxBI9gBaerbd9wDYLwzYbItLDharqqtubsr 4rNCHbGeaGWj0Jf9crFfpeea0xh9v8qiW7rqqrFfpeea0xe9Lq=Jc9 vqaqpepm0xbba9pwe9Q8fs0=yqaqpepae9pg0FirpepeKkFr0xfr=x fr=xb9adbaqaaeGaciGaaiaabeqaamaabaabaaGcbaqcfaOaamOram aaBaaabaGaam4CaiaadIgacaGGFbGaamyEaaqabaGaeyypa0ZaaSaa aeaacqaH8oqBdaWgaaqaaiaaigdaaeqaaiabgEna0kaadgeacqGHxd aTcaWGwbWaaSbaaeaacaWG5bGaai4xaiaadkhacaWGLbGaamiBaaqa baaabaGaamyEamaaBaaabaGaamOtaaqabaaaaaaa@4D84@ (3.3.5)

F sh_z = μ 1 ×A× V z_rel z N MathType@MTEF@5@5@+= feaagKart1ev2aaatCvAUfeBSjuyZL2yd9gzLbvyNv2CaerbuLwBLn hiov2DGi1BTfMBaeXatLxBI9gBaerbd9wDYLwzYbItLDharqqtubsr 4rNCHbGeaGWj0Jf9crFfpeea0xh9v8qiW7rqqrFfpeea0xe9Lq=Jc9 vqaqpepm0xbba9pwe9Q8fs0=yqaqpepae9pg0FirpepeKkFr0xfr=x fr=xb9adbaqaaeGaciGaaiaabeqaamaabaabaaGcbaqcfaOaamOram aaBaaabaGaam4CaiaadIgacaGGFbGaamOEaaqabaGaeyypa0ZaaSaa aeaacqaH8oqBdaWgaaqaaiaaigdaaeqaaiabgEna0kaadgeacqGHxd aTcaWGwbWaaSbaaeaacaWG6bGaai4xaiaadkhacaWGLbGaamiBaaqa baaabaGaamOEamaaBaaabaGaamOtaaqabaaaaaaa@4D87@ (3.3.6)

Where μ 1 MathType@MTEF@5@5@+= feaagKart1ev2aaatCvAUfeBSjuyZL2yd9gzLbvyNv2CaerbuLwBLn hiov2DGi1BTfMBaeXatLxBI9gBaerbd9wDYLwzYbItLDharqqtubsr 4rNCHbGeaGWj0Jf9crFfpeea0xh9v8qiW7rqqrFfpeea0xe9Lq=Jc9 vqaqpepm0xbba9pwe9Q8fs0=yqaqpepae9pg0FirpepeKkFr0xfr=x fr=xb9adbaqaaeGaciGaaiaabeqaamaabaabaaGcbaqcfaOaeqiVd0 2aaSbaaeaacaaIXaaabeaaaaa@3B27@  is the laminar viscosity, A is the face area, V y_rel MathType@MTEF@5@5@+= feaagKart1ev2aaatCvAUfeBSjuyZL2yd9gzLbvyNv2CaerbuLwBLn hiov2DGi1BTfMBaeXatLxBI9gBaerbd9wDYLwzYbItLDharqqtubsr 4rNCHbGeaGWj0Jf9crFfpeea0xh9v8qiW7rqqrFfpeea0xe9Lq=Jc9 vqaqpepm0xbba9pwe9Q8fs0=yqaqpepae9pg0FirpepeKkFr0xfr=x fr=xb9adbaqaaeGaciGaaiaabeqaamaabaabaaGcbaqcfaOaamOvam aaBaaabaGaamyEaiaac+facaWGYbGaamyzaiaadYgaaeqaaaaa@3E44@ is the relative velocity at the boundary in the x-direction, y-direction or z-direction and x N MathType@MTEF@5@5@+= feaagKart1ev2aaatCvAUfeBSjuyZL2yd9gzLbvyNv2CaerbuLwBLn hiov2DGi1BTfMBaeXatLxBI9gBaerbd9wDYLwzYbItLDharqqtubsr 4rNCHbGeaGWj0Jf9crFfpeea0xh9v8qiW7rqqrFfpeea0xe9Lq=Jc9 vqaqpepm0xbba9pwe9Q8fs0=yqaqpepae9pg0FirpepeKkFr0xfr=x fr=xb9adbaqaaeGaciGaaiaabeqaamaabaabaaGcbaqcfaOaamiEam aaBaaabaGaamOtaaqabaaaaa@3A86@ is the distance from the cell center to the face center. The pressure moments are computer through the following equations:

P m_x =F C y × P z F C z × P y MathType@MTEF@5@5@+= feaagKart1ev2aaatCvAUfeBSjuyZL2yd9gzLbvyNv2CaerbuLwBLn hiov2DGi1BTfMBaeXatLxBI9gBaerbd9wDYLwzYbItLDharqqtubsr 4rNCHbGeaGWj0Jf9crFfpeea0xh9v8qiW7rqqrFfpeea0xe9Lq=Jc9 vqaqpepm0xbba9pwe9Q8fs0=yqaqpepae9pg0FirpepeKkFr0xfr=x fr=xb9adbaqaaeGaciGaaiaabeqaamaabaabaaGcbaqcfaOaamiuam aaBaaabaGaamyBaiaac+facaWG4baabeaacqGH9aqpcaWGgbGaam4q amaaBaaabaGaamyEaaqabaGaey41aqRaamiuamaaBaaabaGaamOEaa qabaGaeyOeI0IaamOraiaadoeadaWgaaqaaiaadQhaaeqaaiabgEna 0kaadcfadaWgaaqaaiaadMhaaeqaaaaa@4BCC@ (3.3.7)

P m_y =F C z × P x F C x × P z MathType@MTEF@5@5@+= feaagKart1ev2aaatCvAUfeBSjuyZL2yd9gzLbvyNv2CaerbuLwBLn hiov2DGi1BTfMBaeXatLxBI9gBaerbd9wDYLwzYbItLDharqqtubsr 4rNCHbGeaGWj0Jf9crFfpeea0xh9v8qiW7rqqrFfpeea0xe9Lq=Jc9 vqaqpepm0xbba9pwe9Q8fs0=yqaqpepae9pg0FirpepeKkFr0xfr=x fr=xb9adbaqaaeGaciGaaiaabeqaamaabaabaaGcbaqcfaOaamiuam aaBaaabaGaamyBaiaac+facaWG5baabeaacqGH9aqpcaWGgbGaam4q amaaBaaabaGaamOEaaqabaGaey41aqRaamiuamaaBaaabaGaamiEaa qabaGaeyOeI0IaamOraiaadoeadaWgaaqaaiaadIhaaeqaaiabgEna 0kaadcfadaWgaaqaaiaadQhaaeqaaaaa@4BCB@ (3.3.8)

P m_z =F C x × P y F C y × P x MathType@MTEF@5@5@+= feaagKart1ev2aaatCvAUfeBSjuyZL2yd9gzLbvyNv2CaerbuLwBLn hiov2DGi1BTfMBaeXatLxBI9gBaerbd9wDYLwzYbItLDharqqtubsr 4rNCHbGeaGWj0Jf9crFfpeea0xh9v8qiW7rqqrFfpeea0xe9Lq=Jc9 vqaqpepm0xbba9pwe9Q8fs0=yqaqpepae9pg0FirpepeKkFr0xfr=x fr=xb9adbaqaaeGaciGaaiaabeqaamaabaabaaGcbaqcfaOaamiuam aaBaaabaGaamyBaiaac+facaWG6baabeaacqGH9aqpcaWGgbGaam4q amaaBaaabaGaamiEaaqabaGaey41aqRaamiuamaaBaaabaGaamyEaa qabaGaeyOeI0IaamOraiaadoeadaWgaaqaaiaadMhaaeqaaiabgEna 0kaadcfadaWgaaqaaiaadIhaaeqaaaaa@4BCA@ (3.3.9)

Where FC is the face center location for a given x, y, or z component and P is the pressure force for a given x, y, or z component. The viscous moments are calculated in the following manner:

M x =F C y × F sh_z F C z × F sh_y MathType@MTEF@5@5@+= feaagKart1ev2aaatCvAUfeBSjuyZL2yd9gzLbvyNv2CaerbuLwBLn hiov2DGi1BTfMBaeXatLxBI9gBaerbd9wDYLwzYbItLDharqqtubsr 4rNCHbGeaGWj0Jf9crFfpeea0xh9v8qiW7rqqrFfpeea0xe9Lq=Jc9 vqaqpepm0xbba9pwe9Q8fs0=yqaqpepae9pg0FirpepeKkFr0xfr=x fr=xb9adbaqaaeGaciGaaiaabeqaamaabaabaaGcbaqcfaOaamytam aaBaaabaGaamiEaaqabaGaeyypa0JaamOraiaadoeadaWgaaqaaiaa dMhaaeqaaiabgEna0kaadAeadaWgaaqaaiaadohacaWGObGaai4xai aadQhaaeqaaiabgkHiTiaadAeacaWGdbWaaSbaaeaacaWG6baabeaa cqGHxdaTcaWGgbWaaSbaaeaacaWGZbGaamiAaiaac+facaWG5baabe aaaaa@4F70@ (3.3.10)

M y =F C z × F sh_x F C x × F sh_z MathType@MTEF@5@5@+= feaagKart1ev2aaatCvAUfeBSjuyZL2yd9gzLbvyNv2CaerbuLwBLn hiov2DGi1BTfMBaeXatLxBI9gBaerbd9wDYLwzYbItLDharqqtubsr 4rNCHbGeaGWj0Jf9crFfpeea0xh9v8qiW7rqqrFfpeea0xe9Lq=Jc9 vqaqpepm0xbba9pwe9Q8fs0=yqaqpepae9pg0FirpepeKkFr0xfr=x fr=xb9adbaqaaeGaciGaaiaabeqaamaabaabaaGcbaqcfaOaamytam aaBaaabaGaamyEaaqabaGaeyypa0JaamOraiaadoeadaWgaaqaaiaa dQhaaeqaaiabgEna0kaadAeadaWgaaqaaiaadohacaWGObGaai4xai aadIhaaeqaaiabgkHiTiaadAeacaWGdbWaaSbaaeaacaWG4baabeaa cqGHxdaTcaWGgbWaaSbaaeaacaWGZbGaamiAaiaac+facaWG6baabe aaaaa@4F6F@ (3.3.11)

M z =F C x × F sh_y F C y × F sh_x MathType@MTEF@5@5@+= feaagKart1ev2aaatCvAUfeBSjuyZL2yd9gzLbvyNv2CaerbuLwBLn hiov2DGi1BTfMBaeXatLxBI9gBaerbd9wDYLwzYbItLDharqqtubsr 4rNCHbGeaGWj0Jf9crFfpeea0xh9v8qiW7rqqrFfpeea0xe9Lq=Jc9 vqaqpepm0xbba9pwe9Q8fs0=yqaqpepae9pg0FirpepeKkFr0xfr=x fr=xb9adbaqaaeGaciGaaiaabeqaamaabaabaaGcbaqcfaOaamytam aaBaaabaGaamOEaaqabaGaeyypa0JaamOraiaadoeadaWgaaqaaiaa dIhaaeqaaiabgEna0kaadAeadaWgaaqaaiaadohacaWGObGaai4xai aadMhaaeqaaiabgkHiTiaadAeacaWGdbWaaSbaaeaacaWG5baabeaa cqGHxdaTcaWGgbWaaSbaaeaacaWGZbGaamiAaiaac+facaWG4baabe aaaaa@4F6E@ (3.3.12)

Stress module

The Stress Module solves the structural mechanics equations in finite element form. For each element, displacements are defined at the nodes and obtained within the element by interpolation from the nodal values using shape functions. Given in matrix form as:

u={ u v w }=Na MathType@MTEF@5@5@+= feaagKart1ev2aaatCvAUfeBSjuyZL2yd9gzLbvyNv2CaerbuLwBLn hiov2DGi1BTfMBaeXatLxBI9gBaerbd9wDYLwzYbItLDharqqtubsr 4rNCHbGeaGWj0Jf9crFfpeea0xh9v8qiW7rqqrFfpeea0xe9Lq=Jc9 vqaqpepm0xbba9pwe9Q8fs0=yqaqpepae9pg0FirpepeKkFr0xfr=x fr=xb9adbaqaaeGaciGaaiaabeqaamaabaabaaGcbaqcfaOaamyDai abg2da9maacmaabaqbaeqabmqaaaqaaiaadwhaaeaacaWG2baabaGa am4DaaaaaiaawUhacaGL9baacqGH9aqpcaWGobGaamyyaaaa@4285@ (3.4.1)

Where u is the displacement field throughout the element, N is the shape function matrix and a is a vector of nodal displacements. The strains ε MathType@MTEF@5@5@+= feaagKart1ev2aaatCvAUfeBSjuyZL2yd9gzLbvyNv2CaerbuLwBLn hiov2DGi1BTfMBaeXatLxBI9gBaerbd9wDYLwzYbItLDharqqtubsr 4rNCHbGeaGWj0Jf9crFfpeea0xh9v8qiW7rqqrFfpeea0xe9Lq=Jc9 vqaqpepm0xbba9pwe9Q8fs0=yqaqpepae9pg0FirpepeKkFr0xfr=x fr=xb9adbaqaaeGaciGaaiaabeqaamaabaabaaGcbaqcfaOaeqyTdu gaaa@3A3C@ are derived from the displacements u and hence the nodal displacements a and it can be associated as:

dε=Bda MathType@MTEF@5@5@+= feaagKart1ev2aaatCvAUfeBSjuyZL2yd9gzLbvyNv2CaerbuLwBLn hiov2DGi1BTfMBaeXatLxBI9gBaerbd9wDYLwzYbItLDharqqtubsr 4rNCHbGeaGWj0Jf9crFfpeea0xh9v8qiW7rqqrFfpeea0xe9Lq=Jc9 vqaqpepm0xbba9pwe9Q8fs0=yqaqpepae9pg0FirpepeKkFr0xfr=x fr=xb9adbaqaaeGaciGaaiaabeqaamaabaabaaGcbaqcfaOaamizai abew7aLjabg2da9iaadkeacaWGKbGaamyyaaaa@3EC1@ (3.4.2)

For large strains the relationship is described as:

B= B o + B L (a) MathType@MTEF@5@5@+= feaagKart1ev2aaatCvAUfeBSjuyZL2yd9gzLbvyNv2CaerbuLwBLn hiov2DGi1BTfMBaeXatLxBI9gBaerbd9wDYLwzYbItLDharqqtubsr 4rNCHbGeaGWj0Jf9crFfpeea0xh9v8qiW7rqqrFfpeea0xe9Lq=Jc9 vqaqpepm0xbba9pwe9Q8fs0=yqaqpepae9pg0FirpepeKkFr0xfr=x fr=xb9adbaqaaeGaciGaaiaabeqaamaabaabaaGcbaqcfaOaamOqai abg2da9iaadkeadaWgaaqaaiaad+gaaeqaaiabgUcaRiaadkeadaWg aaqaaiaadYeaaeqaaiaacIcacaWGHbGaaiykaaaa@4118@ (3.4.3)

Where B o MathType@MTEF@5@5@+= feaagKart1ev2aaatCvAUfeBSjuyZL2yd9gzLbvyNv2CaerbuLwBLn hiov2DGi1BTfMBaeXatLxBI9gBaerbd9wDYLwzYbItLDharqqtubsr 4rNCHbGeaGWj0Jf9crFfpeea0xh9v8qiW7rqqrFfpeea0xe9Lq=Jc9 vqaqpepm0xbba9pwe9Q8fs0=yqaqpepae9pg0FirpepeKkFr0xfr=x fr=xb9adbaqaaeGaciGaaiaabeqaamaabaabaaGcbaqcfaOaamOqam aaBaaabaGaam4Baaqabaaaaa@3A71@ is the standard small-strain strain-displacement matrix and B L MathType@MTEF@5@5@+= feaagKart1ev2aaatCvAUfeBSjuyZL2yd9gzLbvyNv2CaerbuLwBLn hiov2DGi1BTfMBaeXatLxBI9gBaerbd9wDYLwzYbItLDharqqtubsr 4rNCHbGeaGWj0Jf9crFfpeea0xh9v8qiW7rqqrFfpeea0xe9Lq=Jc9 vqaqpepm0xbba9pwe9Q8fs0=yqaqpepae9pg0FirpepeKkFr0xfr=x fr=xb9adbaqaaeGaciGaaiaabeqaamaabaabaaGcbaqcfaOaamOqam aaBaaabaGaamitaaqabaaaaa@3A4E@ is a linear function of the nodal displacement; On the other hand, small strains can be described as follows:

σ=D(ε ε o )+ σ o MathType@MTEF@5@5@+= feaagKart1ev2aaatCvAUfeBSjuyZL2yd9gzLbvyNv2CaerbuLwBLn hiov2DGi1BTfMBaeXatLxBI9gBaerbd9wDYLwzYbItLDharqqtubsr 4rNCHbGeaGWj0Jf9crFfpeea0xh9v8qiW7rqqrFfpeea0xe9Lq=Jc9 vqaqpepm0xbba9pwe9Q8fs0=yqaqpepae9pg0FirpepeKkFr0xfr=x fr=xb9adbaqaaeGaciGaaiaabeqaamaabaabaaGcbaqcfaOaeq4Wdm Naeyypa0JaamiraiaacIcacqaH1oqzcqGHsislcqaH1oqzdaWgaaqa aiaad+gaaeqaaiaacMcacqGHRaWkcqaHdpWCdaWgaaqaaiaad+gaae qaaaaa@468A@ (3.4.4)

Where D is the elasticity matrix containing the material properties, ε o MathType@MTEF@5@5@+= feaagKart1ev2aaatCvAUfeBSjuyZL2yd9gzLbvyNv2CaerbuLwBLn hiov2DGi1BTfMBaeXatLxBI9gBaerbd9wDYLwzYbItLDharqqtubsr 4rNCHbGeaGWj0Jf9crFfpeea0xh9v8qiW7rqqrFfpeea0xe9Lq=Jc9 vqaqpepm0xbba9pwe9Q8fs0=yqaqpepae9pg0FirpepeKkFr0xfr=x fr=xb9adbaqaaeGaciGaaiaabeqaamaabaabaaGcbaqcfaOaeqyTdu 2aaSbaaeaacaWGVbaabeaaaaa@3B51@ and σ o MathType@MTEF@5@5@+= feaagKart1ev2aaatCvAUfeBSjuyZL2yd9gzLbvyNv2CaerbuLwBLn hiov2DGi1BTfMBaeXatLxBI9gBaerbd9wDYLwzYbItLDharqqtubsr 4rNCHbGeaGWj0Jf9crFfpeea0xh9v8qiW7rqqrFfpeea0xe9Lq=Jc9 vqaqpepm0xbba9pwe9Q8fs0=yqaqpepae9pg0FirpepeKkFr0xfr=x fr=xb9adbaqaaeGaciGaaiaabeqaamaabaabaaGcbaqcfaOaeq4Wdm 3aaSbaaeaacaWGVbaabeaaaaa@3B6D@ is initial strains and stresses. The equations used by the computational engine are obtained by forming a balance between the external and internal generalized forces using the principal of virtual work. If we let f be the vector of externally applied loads and apply a nodal virtual displacement of δ a MathType@MTEF@5@5@+= feaagKart1ev2aaatCvAUfeBSjuyZL2yd9gzLbvyNv2CaerbuLwBLn hiov2DGi1BTfMBaeXatLxBI9gBaerbd9wDYLwzYbItLDharqqtubsr 4rNCHbGeaGWj0Jf9crFfpeea0xh9v8qiW7rqqrFfpeea0xe9Lq=Jc9 vqaqpepm0xbba9pwe9Q8fs0=yqaqpepae9pg0FirpepeKkFr0xfr=x fr=xb9adbaqaaeGaciGaaiaabeqaamaabaabaaGcbaqcfaOaeqiTdq 2aaSbaaeaacaWGHbaabeaaaaa@3B41@ . External forces can be computed in the following manner:

W ext =δ a T f MathType@MTEF@5@5@+= feaagKart1ev2aaatCvAUfeBSjuyZL2yd9gzLbvyNv2CaerbuLwBLn hiov2DGi1BTfMBaeXatLxBI9gBaerbd9wDYLwzYbItLDharqqtubsr 4rNCHbGeaGWj0Jf9crFfpeea0xh9v8qiW7rqqrFfpeea0xe9Lq=Jc9 vqaqpepm0xbba9pwe9Q8fs0=yqaqpepae9pg0FirpepeKkFr0xfr=x fr=xb9adbaqaaeGaciGaaiaabeqaamaabaabaaGcbaqcfaOaam4vam aaBaaabaGaamyzaiaadIhacaWG0baabeaacqGH9aqpcqaH0oazcaWG HbWaaWbaaeqabaGaamivaaaacaWGMbaaaa@41E9@  (3.4.5)

While internal forces are given by:

W int = V δ ε T σdV= V δ a T B T σdV MathType@MTEF@5@5@+= feaagKart1ev2aaatCvAUfeBSjuyZL2yd9gzLbvyNv2CaerbuLwBLn hiov2DGi1BTfMBaeXatLxBI9gBaerbd9wDYLwzYbItLDharqqtubsr 4rNCHbGeaGWj0Jf9crFfpeea0xh9v8qiW7rqqrFfpeea0xe9Lq=Jc9 vqaqpepm0xbba9pwe9Q8fs0=yqaqpepae9pg0FirpepeKkFr0xfr=x fr=xb9adbaqaaeGaciGaaiaabeqaamaabaabaaGcbaqcfaOaam4vam aaBaaabaGaciyAaiaac6gacaGG0baabeaacqGH9aqpdaWdrbqaaiab es7aKjabew7aLnaaCaaabeqaaiaadsfaaaGaeq4WdmNaamizaiaadA facqGH9aqpaeaacaWGwbaabeGaey4kIipadaWdrbqaaiabes7aKjaa dggadaahaaqabeaacaWGubaaaiaadkeadaahaaqabeaacaWGubaaai abeo8aZjaadsgacaWGwbaabaGaamOvaaqabiabgUIiYdaaaa@552E@ (3.4.6)

The above equations incorporate equation (3.3.2) in order to express the strain in terms of the nodal displacements. By letting the external work be equal to the total internal work, we can get an equilibrium expression given as:

ψ(a)= V B T σdV f=0 MathType@MTEF@5@5@+= feaagKart1ev2aaatCvAUfeBSjuyZL2yd9gzLbvyNv2CaerbuLwBLn hiov2DGi1BTfMBaeXatLxBI9gBaerbd9wDYLwzYbItLDharqqtubsr 4rNCHbGeaGWj0Jf9crFfpeea0xh9v8qiW7rqqrFfpeea0xe9Lq=Jc9 vqaqpepm0xbba9pwe9Q8fs0=yqaqpepae9pg0FirpepeKkFr0xfr=x fr=xb9adbaqaaeGaciGaaiaabeqaamaabaabaaGcbaqcfaOaeqiYdK NaaiikaiaadggacaGGPaGaeyypa0Zaa8quaeaacaWGcbWaaWbaaeqa baGaamivaaaacqaHdpWCcaWGKbGaamOvaaqaaiaadAfaaeqacqGHRi I8aiabgkHiTiaadAgacqGH9aqpcaaIWaaaaa@4996@ (3.4.7)

A Newton-Raphson technique is used for displacements pertaining to non-linearity. Where at each iteration we solve for a correction to the current displacement field using:

dψ da (Δa) n+1 = ψ n MathType@MTEF@5@5@+= feaagKart1ev2aaatCvAUfeBSjuyZL2yd9gzLbvyNv2CaerbuLwBLn hiov2DGi1BTfMBaeXatLxBI9gBaerbd9wDYLwzYbItLDharqqtubsr 4rNCHbGeaGWj0Jf9crFfpeea0xh9v8qiW7rqqrFfpeea0xe9Lq=Jc9 vqaqpepm0xbba9pwe9Q8fs0=yqaqpepae9pg0FirpepeKkFr0xfr=x fr=xb9adbaqaaeGaciGaaiaabeqaamaabaabaaGcbaqcfa4aaSaaae aacaWGKbGaeqiYdKhabaGaamizaiaadggaaaGaaiikaiabfs5aejaa dggacaGGPaWaaWbaaeqabaGaamOBaiabgUcaRiaaigdaaaGaeyypa0 JaeyOeI0IaeqiYdK3aaWbaaeqabaGaamOBaaaaaaa@4858@ (3.4.8)

By manipulation of equations (3.3.2) and (3.3.4), the equation in the Newton-Raphson scheme is:

K T (Δa) n+1 =f V B T σdV MathType@MTEF@5@5@+= feaagKart1ev2aaatCvAUfeBSjuyZL2yd9gzLbvyNv2CaerbuLwBLn hiov2DGi1BTfMBaeXatLxBI9gBaerbd9wDYLwzYbItLDharqqtubsr 4rNCHbGeaGWj0Jf9crFfpeea0xh9v8qiW7rqqrFfpeea0xe9Lq=Jc9 vqaqpepm0xbba9pwe9Q8fs0=yqaqpepae9pg0FirpepeKkFr0xfr=x fr=xb9adbaqaaeGaciGaaiaabeqaamaabaabaaGcbaqcfaOaam4sam aaBaaabaGaamivaaqabaGaaiikaiabfs5aejaadggacaGGPaWaaWba aeqabaGaamOBaiabgUcaRiaaigdaaaGaeyypa0JaamOzaiabgkHiTm aapefabaGaamOqamaaCaaabeqaaiaadsfaaaGaeq4WdmNaamizaiaa dAfaaeaacaWGwbaabeGaey4kIipaaaa@4BEA@ (3.4.9)

Compliance

Deformation of the created meshes is based on the solution of the equations of linear elasticity given as:

u ji +(λ+u) u i j + f i =0 MathType@MTEF@5@5@+= feaagKart1ev2aaatCvAUfeBSjuyZL2yd9gzLbvyNv2CaerbuLwBLn hiov2DGi1BTfMBaeXatLxBI9gBaerbd9wDYLwzYbItLDharqqtubsr 4rNCHbGeaGWj0Jf9crFfpeea0xh9v8qiW7rqqrFfpeea0xe9Lq=Jc9 vqaqpepm0xbba9pwe9Q8fs0=yqaqpepae9pg0FirpepeKkFr0xfr=x fr=xb9adbaqaaeGaciGaaiaabeqaamaabaabaaGcbaqcfaOaamyDam aaBaaabaGaamOAaiaadMgaaeqaaiabgUcaRiaacIcacqaH7oaBcqGH RaWkcaWG1bGaaiykaiaadwhadaWgaaqaaiaadMgaaeqaamaaBaaaba GaamOAaaqabaGaey4kaSIaamOzamaaBaaabaGaamyAaaqabaGaeyyp a0JaaGimaaaa@490D@ (3.5.1)

Where u i MathType@MTEF@5@5@+= feaagKart1ev2aaatCvAUfeBSjuyZL2yd9gzLbvyNv2CaerbuLwBLn hiov2DGi1BTfMBaeXatLxBI9gBaerbd9wDYLwzYbItLDharqqtubsr 4rNCHbGeaGWj0Jf9crFfpeea0xh9v8qiW7rqqrFfpeea0xe9Lq=Jc9 vqaqpepm0xbba9pwe9Q8fs0=yqaqpepae9pg0FirpepeKkFr0xfr=x fr=xb9adbaqaaeGaciGaaiaabeqaamaabaabaaGcbaqcfaOaamyDam aaBaaabaGaamyAaaqabaaaaa@3A9E@ is the ith component of displacement f i MathType@MTEF@5@5@+= feaagKart1ev2aaatCvAUfeBSjuyZL2yd9gzLbvyNv2CaerbuLwBLn hiov2DGi1BTfMBaeXatLxBI9gBaerbd9wDYLwzYbItLDharqqtubsr 4rNCHbGeaGWj0Jf9crFfpeea0xh9v8qiW7rqqrFfpeea0xe9Lq=Jc9 vqaqpepm0xbba9pwe9Q8fs0=yqaqpepae9pg0FirpepeKkFr0xfr=x fr=xb9adbaqaaeGaciGaaiaabeqaamaabaabaaGcbaqcfaOaamOzam aaBaaabaGaamyAaaqabaaaaa@3A8F@  is the ith component of the body force and λ MathType@MTEF@5@5@+= feaagKart1ev2aaatCvAUfeBSjuyZL2yd9gzLbvyNv2CaerbuLwBLn hiov2DGi1BTfMBaeXatLxBI9gBaerbd9wDYLwzYbItLDharqqtubsr 4rNCHbGeaGWj0Jf9crFfpeea0xh9v8qiW7rqqrFfpeea0xe9Lq=Jc9 vqaqpepm0xbba9pwe9Q8fs0=yqaqpepae9pg0FirpepeKkFr0xfr=x fr=xb9adbaqaaeGaciGaaiaabeqaamaabaabaaGcbaqcfaOaeq4UdW gaaa@3A49@ and u MathType@MTEF@5@5@+= feaagKart1ev2aaatCvAUfeBSjuyZL2yd9gzLbvyNv2CaerbuLwBLn hiov2DGi1BTfMBaeXatLxBI9gBaerbd9wDYLwzYbItLDharqqtubsr 4rNCHbGeaGWj0Jf9crFfpeea0xh9v8qiW7rqqrFfpeea0xe9Lq=Jc9 vqaqpepm0xbba9pwe9Q8fs0=yqaqpepae9pg0FirpepeKkFr0xfr=x fr=xb9adbaqaaeGaciGaaiaabeqaamaabaabaaGcbaqcfaOaamyDaa aa@398F@ are the Lame constants given by:

μ= E 2(1+γ) MathType@MTEF@5@5@+= feaagKart1ev2aaatCvAUfeBSjuyZL2yd9gzLbvyNv2CaerbuLwBLn hiov2DGi1BTfMBaeXatLxBI9gBaerbd9wDYLwzYbItLDharqqtubsr 4rNCHbGeaGWj0Jf9crFfpeea0xh9v8qiW7rqqrFfpeea0xe9Lq=Jc9 vqaqpepm0xbba9pwe9Q8fs0=yqaqpepae9pg0FirpepeKkFr0xfr=x fr=xb9adbaqaaeGaciGaaiaabeqaamaabaabaaGcbaqcfaOaeqiVd0 Maeyypa0ZaaSaaaeaacaWGfbaabaGaaGOmaiaacIcacaaIXaGaey4k aSIaeq4SdCMaaiykaaaaaaa@4184@ (3.5.2)

λ= γE (1+γ)(12γ) MathType@MTEF@5@5@+= feaagKart1ev2aaatCvAUfeBSjuyZL2yd9gzLbvyNv2CaerbuLwBLn hiov2DGi1BTfMBaeXatLxBI9gBaerbd9wDYLwzYbItLDharqqtubsr 4rNCHbGeaGWj0Jf9crFfpeea0xh9v8qiW7rqqrFfpeea0xe9Lq=Jc9 vqaqpepm0xbba9pwe9Q8fs0=yqaqpepae9pg0FirpepeKkFr0xfr=x fr=xb9adbaqaaeGaciGaaiaabeqaamaabaabaaGcbaqcfaOaeq4UdW Maeyypa0ZaaSaaaeaacqaHZoWzcaWGfbaabaGaaiikaiaaigdacqGH RaWkcqaHZoWzcaGGPaGaaiikaiaaigdacqGHsislcaaIYaGaeq4SdC Maaiykaaaaaaa@47D1@ (3.5.3)

Here E is the modulus of elasticity and Y is Poisson’s ratio. Both of these are set to zero to in order to simplify the equations and reduce the cross-equation coupling. The body force is also zero and the following equation governing the displacements of the interior nodes results in the following expression

U ji + U i j =0 MathType@MTEF@5@5@+= feaagKart1ev2aaatCvAUfeBSjuyZL2yd9gzLbvyNv2CaerbuLwBLn hiov2DGi1BTfMBaeXatLxBI9gBaerbd9wDYLwzYbItLDharqqtubsr 4rNCHbGeaGWj0Jf9crFfpeea0xh9v8qiW7rqqrFfpeea0xe9Lq=Jc9 vqaqpepm0xbba9pwe9Q8fs0=yqaqpepae9pg0FirpepeKkFr0xfr=x fr=xb9adbaqaaeGaciGaaiaabeqaamaabaabaaGcbaqcfaOaamyvam aaBaaabaGaamOAaiaadMgaaeqaaiabgUcaRiaadwfadaWgaaqaaiaa dMgaaeqaamaaBaaabaGaamOAaaqabaGaeyypa0JaaGimaaaa@4108@ (3.5.4)

This equation is solved using a standard Galerkin formulation, which can be expressed as

V Φ α ( U ji + U i j )dV =0 MathType@MTEF@5@5@+= feaagKart1ev2aaatCvAUfeBSjuyZL2yd9gzLbvyNv2CaerbuLwBLn hiov2DGi1BTfMBaeXatLxBI9gBaerbd9wDYLwzYbItLDharqqtubsr 4rNCHbGeaGWj0Jf9crFfpeea0xh9v8qiW7rqqrFfpeea0xe9Lq=Jc9 vqaqpepm0xbba9pwe9Q8fs0=yqaqpepae9pg0FirpepeKkFr0xfr=x fr=xb9adbaqaaeGaciGaaiaabeqaamaabaabaaGcbaqcfa4aa8quae aacqqHMoGrdaWgaaqaaiabeg7aHbqabaGaaiikaiaadwfadaWgaaqa aiaadQgacaWGPbaabeaacqGHRaWkcaWGvbWaaSbaaeaacaWGPbaabe aadaWgaaqaaiaadQgaaeqaaiaacMcacaWGKbGaamOvaaqaaiaadAfa aeqacqGHRiI8aiabg2da9iaaicdaaaa@4A6C@ (3.5.5)

Where Φ α MathType@MTEF@5@5@+= feaagKart1ev2aaatCvAUfeBSjuyZL2yd9gzLbvyNv2CaerbuLwBLn hiov2DGi1BTfMBaeXatLxBI9gBaerbd9wDYLwzYbItLDharqqtubsr 4rNCHbGeaGWj0Jf9crFfpeea0xh9v8qiW7rqqrFfpeea0xe9Lq=Jc9 vqaqpepm0xbba9pwe9Q8fs0=yqaqpepae9pg0FirpepeKkFr0xfr=x fr=xb9adbaqaaeGaciGaaiaabeqaamaabaabaaGcbaqcfaOaeuOPdy 0aaSbaaeaacqaHXoqyaeqaaaaa@3BCF@  is the shape function for node U and V is the volume. After integrating by parts and simplifying terms we obtain the following expression:

V E Φ α ( U ji + U i j )dV = A E Φ α ( U ij + U i ji ) n i dA =0 MathType@MTEF@5@5@+= feaagKart1ev2aaatCvAUfeBSjuyZL2yd9gzLbvyNv2CaerbuLwBLn hiov2DGi1BTfMBaeXatLxBI9gBaerbd9wDYLwzYbItLDharqqtubsr 4rNCHbGeaGWj0Jf9crFfpeea0xh9v8qiW7rqqrFfpeea0xe9Lq=Jc9 vqaqpepm0xbba9pwe9Q8fs0=yqaqpepae9pg0FirpepeKkFr0xfr=x fr=xb9adbaqaaeGaciGaaiaabeqaamaabaabaaGcbaqcfa4aa8quae aacaWGfbGaeuOPdy0aaSbaaeaacqaHXoqyaeqaaiaacIcacaWGvbWa aSbaaeaacaWGQbGaamyAaaqabaGaey4kaSIaamyvamaaBaaabaGaam yAaaqabaWaaSbaaeaacaWGQbaabeaacaGGPaGaamizaiaadAfaaeaa caWGwbaabeGaey4kIipacqGH9aqpdaWdrbqaaiaadweacqqHMoGrda Wgaaqaaiabeg7aHbqabaGaaiikaiaadwfadaWgaaqaaiaadMgacaWG QbaabeaacqGHRaWkcaWGvbWaaSbaaeaacaWGPbaabeaadaWgaaqaai aadQgacaWGPbaabeaacaGGPaGaamOBamaaBaaabaGaamyAaaqabaGa amizaiaadgeaaeaacaWGbbaabeGaey4kIipacqGH9aqpcaaIWaaaaa@5FE3@ (3.5.6)

Internal displacements are obtained in the following manner:

U j =φ U β j β MathType@MTEF@5@5@+= feaagKart1ev2aaatCvAUfeBSjuyZL2yd9gzLbvyNv2CaerbuLwBLn hiov2DGi1BTfMBaeXatLxBI9gBaerbd9wDYLwzYbItLDharqqtubsr 4rNCHbGeaGWj0Jf9crFfpeea0xh9v8qiW7rqqrFfpeea0xe9Lq=Jc9 vqaqpepm0xbba9pwe9Q8fs0=yqaqpepae9pg0FirpepeKkFr0xfr=x fr=xb9adbaqaaeGaciGaaiaabeqaamaabaabaaGcbaqcfaOaamyvam aaBaaabaGaamOAaaqabaGaeyypa0JaeqOXdO2aaSraaeaacqaHYoGy aeqaaiaadwfadaqhaaqaaiaadQgaaeaacqaHYoGyaaaaaa@4291@ (3.5.7)

Where U j β MathType@MTEF@5@5@+= feaagKart1ev2aaatCvAUfeBSjuyZL2yd9gzLbvyNv2CaerbuLwBLn hiov2DGi1BTfMBaeXatLxBI9gBaerbd9wDYLwzYbItLDharqqtubsr 4rNCHbGeaGWj0Jf9crFfpeea0xh9v8qiW7rqqrFfpeea0xe9Lq=Jc9 vqaqpepm0xbba9pwe9Q8fs0=yqaqpepae9pg0FirpepeKkFr0xfr=x fr=xb9adbaqaaeGaciGaaiaabeqaamaabaabaaGcbaqcfaOaamyvam aaDaaabaGaamOAaaqaaiabek7aIbaaaaa@3C21@ is the displacement component at node β. This allows to obtain an equation for nodal displacements given as:

K ij α U β J β =0 MathType@MTEF@5@5@+= feaagKart1ev2aaatCvAUfeBSjuyZL2yd9gzLbvyNv2CaerbuLwBLn hiov2DGi1BTfMBaeXatLxBI9gBaerbd9wDYLwzYbItLDharqqtubsr 4rNCHbGeaGWj0Jf9crFfpeea0xh9v8qiW7rqqrFfpeea0xe9Lq=Jc9 vqaqpepm0xbba9pwe9Q8fs0=yqaqpepae9pg0FirpepeKkFr0xfr=x fr=xb9adbaqaaeGaciGaaiaabeqaamaabaabaaGcbaqcfaOaam4sam aaDaaabaGaamyAaiaadQgaaeaacqaHXoqyaaWaaWraaeqabaGaeqOS digaaiaadwfadaqhaaqaaiaadQeaaeaacqaHYoGyaaGaeyypa0JaaG imaaaa@43F3@ (3.5.8)

Where

K ij α = β V ( Φ α Φ β δ i j + Φ αj Φ βj )dV MathType@MTEF@5@5@+= feaagKart1ev2aaatCvAUfeBSjuyZL2yd9gzLbvyNv2CaerbuLwBLn hiov2DGi1BTfMBaeXatLxBI9gBaerbd9wDYLwzYbItLDharqqtubsr 4rNCHbGeaGWj0Jf9crFfpeea0xh9v8qiW7rqqrFfpeea0xe9Lq=Jc9 vqaqpepm0xbba9pwe9Q8fs0=yqaqpepae9pg0FirpepeKkFr0xfr=x fr=xb9adbaqaaeGaciGaaiaabeqaamaabaabaaGcbaqcfaOaam4sam aaDaaabaGaamyAaiaadQgaaeaacqaHXoqyaaWaaWraaeqabaGaeqOS digaaiabg2da9maapefabaGaaiikaiabfA6agnaaBaaabaGaeqySde gabeaaaeaacaWGwbaabeGaey4kIipacqqHMoGrdaWgaaqaaiabek7a IbqabaGaeqiTdq2aaSbaaeaacaWGPbaabeaadaWgaaqaaiaadQgaae qaaiabgUcaRiabfA6agnaaBaaabaGaeqySdeMaamOAaaqabaGaeuOP dy0aaSbaaeaacqaHYoGycaWGQbaabeaacaGGPaGaamizaiaadAfaaa a@5967@ (3.5.9)

And, δ ij MathType@MTEF@5@5@+= feaagKart1ev2aaatCvAUfeBSjuyZL2yd9gzLbvyNv2CaerbuLwBLn hiov2DGi1BTfMBaeXatLxBI9gBaerbd9wDYLwzYbItLDharqqtubsr 4rNCHbGeaGWj0Jf9crFfpeea0xh9v8qiW7rqqrFfpeea0xe9Lq=Jc9 vqaqpepm0xbba9pwe9Q8fs0=yqaqpepae9pg0FirpepeKkFr0xfr=x fr=xb9adbaqaaeGaciGaaiaabeqaamaabaabaaGcbaqcfaOaeqiTdq 2aaSbaaeaacaWGPbGaamOAaaqabaaaaa@3C38@ is the Kronecker delta.

Results

Figures of hemodynamic simulations using CFD+ACE are shown and described in this section. We started by analyzing the role that thrombus height plays on the shear stresses exerted on the thrombus surface by the blood.41 In order to do this, we created three models with 0.5, 0.25 and 0.125 HD ratio (H/D = ratio between thrombus height and vessel inner diameter) as shown in the Figure 4-6 which shows the maximum shear stress profiles exerted on thrombi of different height. Showing first, a thrombus of 0.5 H/D (Figure 4) ratio illustrates shear stresses higher that thrombus created with 0.25 (Figure 5) or 0.125 H/D ratio (Figure 6). Next simulations will describe the behavior of thrombus at different positions along the vessel wall. We created three different models with thrombi close at the outlet, center and inlet as shown in Figure 7 through Figure 8, respectively.

By keeping constant all model dimensions and materials parameters, we can appreciate the pure effect that location plays with respect to vessel length. Outlet thrombus (Figure 7) shows lower shear stress than central thrombus (Figure 9). While Inlet thrombus (Figure 8) represents higher shear stress and, consequently, higher risk for embolus transition. Similar effects are observed by varying thrombus shape. Figure 10 shows lower shear stress than Figure 11. This is clearly due to the lack of symmetry in the thrombus (Figure 11). Figure 12 through Figure 13 take into account normal, pre-hypertensive and hypertensive conditions, respectively. As expected, Hypertensive thrombus shear stress (Figure 13) is higher than pre-hypertensive profiles (Figure 14) and it is much higher than the shear stress caused by normal pressure as shown in Figure 12. The above graphs suggest than the peel off mechanism would be activated sooner with higher pressure. However, thrombus shear stress profiles seem to lower as blood viscosity is increased. Figure 15 shows profiles with SCD viscosity of 4.12 cPoise. This shear stress is significantly lower than Figure 16 which represents normal blood viscosity of 3.5 cPoise. Thrombus seems to undergo significantly lower shear stresses under the influence of leukemic blood (~6.2 cPoise) as shown in Figure 17. Although not as low as leukemic profiles, shear stress does decrease under diabetic conditions as shown in Figure 18. Also, thrombus shear stress profiles with SCD viscosity increase at higher pressures as shown in the Figures 19-21. Figure 19 depicts the shear stress exerted by SCD blood on a thrombus under normal pressure. Shear stress is increased under pre-hypertensive conditions (Figure 20). Also, results reveal that a SCD patient suffering from hypertension would experience higher shear stress on the thrombus surface as seen in Figure 21. Similar results are found in leukemic profiles analyzed under normal, pre-hypertensive and hypertensive conditions as shown in Figures 22-24. Interestingly, patients suffering from mild diabetes mellitus show thrombus shear stress profiles higher than leukemic profiles, as shown in Figures 25-27. Figure 26 illustrates the shear stress exerted by diabetic blood on a thrombus under normal pressure. Shear stress is amplified under pre-hypertensive circumstances as shown in Figure 25. However, the shear stress exerted on the thrombus by diabetic blood is still much lower than stress profiles of normal blood viscosity.
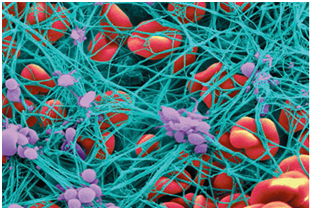
Figure 1 Shows agglomeration of platelets (purple) which convert fibrinogen into a network of fibrin fibers (blue) that stops the flow of blood.41
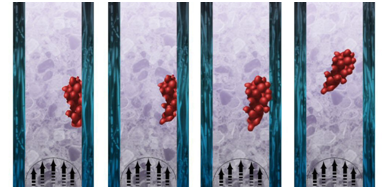
Figure 2

  1. Shows the superficial and perforating veins, while
  2. Shows the deep veins of the leg.

Figure 3

  1. Thrombus at t=0.
  2. Activation of Peel off mechanism at t>>0.
  3. Advance stage of peel off mechanism.
  4. Thrombus to embolus transition.

Figure 4 Shows the shear stress profile at 0.5 H/D ratio of a semispherical thrombus at the center of the vessel.

Figure 5 Shows the shear stress profile at 0.25 H/D ratio of a semispherical thrombus at the center of the vessel.

Discussion

Analysis of the results supports the intuitive reasoning that as thrombus height increases, the shear stress that bloods exerts on the thrombus also increases as shown in Figure 4 through Figure 6. Here, higher pressure at the upstream side of the thrombus is observed at 0.5 H/D ratio when compared to H/D of 0.25 or 0.125. This happens due to the fact that blood velocity is higher as it approaches the center of the flow. This is caused by the reduction in the cross sectional area of the vessel due to the existence of the thrombus. Consequently, the interface between the thrombus and the vessel wall must undergo significant torque effects. Furthermore, the continuous pulsatile stresses applied at the surface of the thrombus will deteriorate it’s the mechanical properties at t >> 0.42 Likewise, locality of the thrombus along the vessel wall plays a key role in the triggering of the peel off mechanism and subsequent thrombus to embolus transition. Figure 7 through Figure 8 show shear stress profiles in which parameters for all three models have been kept constant, with the exception of thrombus location along the vein wall. Further analysis reveals a decrease in the shear stress by as much as 14% and 35% in the upper and central thrombus, respectively, when compared to the thrombus located at the bottom of the vein. In the same manner, clots that have formed with unsymmetrical shapes experience higher stresses than symmetrical thrombus as shown in Figures 10 & 11. Here it is shown that shear stress is as much as 25 % higher in the asymmetrical than in the symmetrical thrombus. Equally important, profiles for pre-hypertensive and hypertensive conditions support the congenital belief that shear stress increases at higher pressures as seen in Figures 12-14. This may not be the case in hypertensive patients suffering from SCD for the reason that their velocity profiles above normal would only reach normal physiological values due to the fact that their blood viscosity is higher.23 Consequently, thrombus shear stress profiles in the presence of SCD decreased substantially under normal, pre-hypertensive and hypertensive conditions as shown in Figures 18-20.
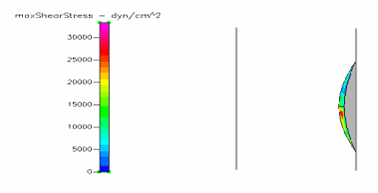
Figure 6 Shows the shear stress profile at 0.125 H/D ratio of a semispherical thrombus at the center of the vessel.
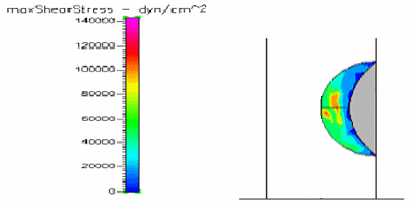
Figure 7 Shows the shear stress profile of a semispherical thrombus at the vessel upper end.

Figure 8 Shows the shear stress profile at 0.5 H/D ratio of a semispherical thrombus at the vessel lower end.
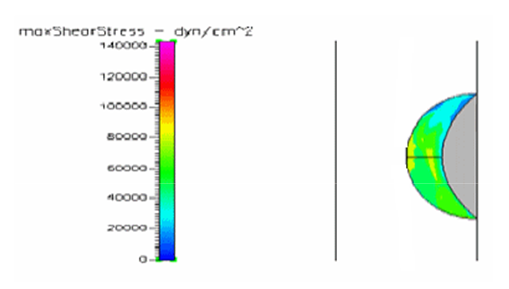
Figure 9 Shows the shear stress profile at 0.5 H/D ratio of a semispherical thrombus at the center of the vessel.
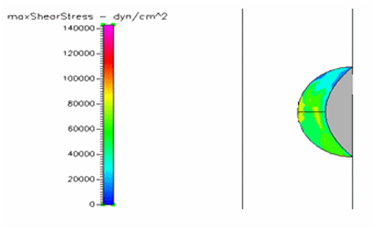
Figure 10 Shows the shear stress profile of semispherical thrombus at the center of the vessel.

Figure 11 Shows the shear stress profile of an asymmetrical thrombus at the center of the vessel.

Figure 12 Shows the shear stress profile at 0.5 H/D ratio of semispherical thrombus at the center of the vessel with normal pressure.

Figure 13 Shows the shear stress profile at 0.5 H/D ratio of semispherical thrombus at the center of the vessel with hypertensive pressure.
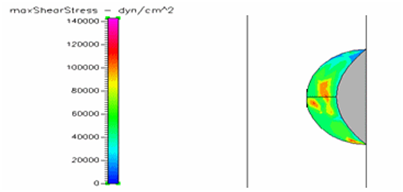
Figure 14 Shows the shear stress profile at 0.5 H/D ratio of semispherical thrombus at the center of the vessel with pre-hypertensive pressure.
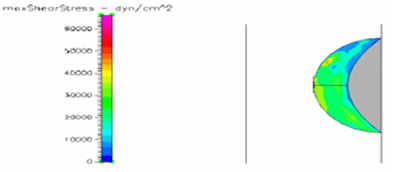
Figure 15 Shows the shear stress profile of semispherical thrombus at the center of the vessel with SCD blood viscosity.

Figure 16 Shows the shear stress profile of semispherical thrombus at the center of the vessel with normal blood viscosity.
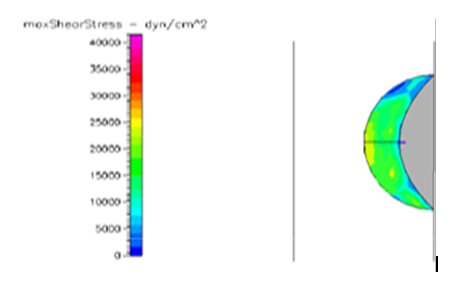
Figure 17 Shows the shear stress profile of semispherical thrombus at the center of the vessel with leukemic blood viscosity.
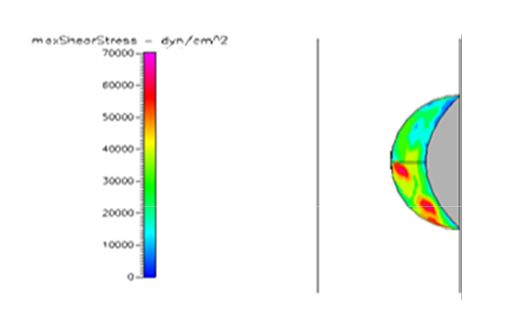
Figure 18 Shows the shear stress profile of semispherical thrombus at the center of the vessel with normal pressure and diabetic blood viscosity.
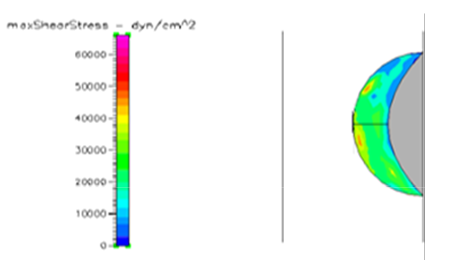
Figure 19 Shows the shear stress profile of semispherical thrombus at the center of the vessel with normal pressure and SCD blood viscosity.

Figure 20 Shows the shear stress profile of semispherical thrombus at the center of the vessel with pre-hypertensive pressure and SCD blood viscosity.

Figure 21 Shows the shear stress profile of semispherical thrombus at the center of the vessel with hypertensive pressure and SCD blood viscosity.
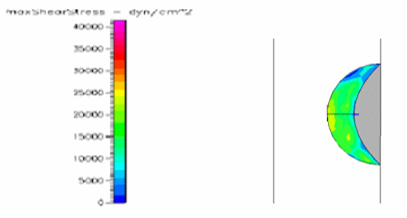
Figure 22 Shows the shear stress profile of semispherical thrombus at the center of the vessel with normal pressure and leukemic blood viscosity.

Figure 23 Shows the shear stress profile of semispherical thrombus at the center of the vessel with pre-hypertensive pressure and leukemic blood viscosity.
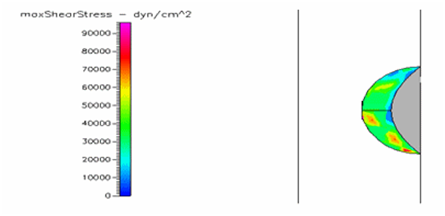
Figure 24 Shows the shear stress profile of semispherical thrombus at the center of the vessel with hypertensive pressure.
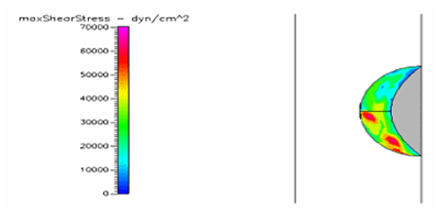
Figure 25 Shows the shear stress profile at 0.5 H/D ratio of semispherical thrombus at the center of the vessel with normal pressure and diabetic blood viscosity.
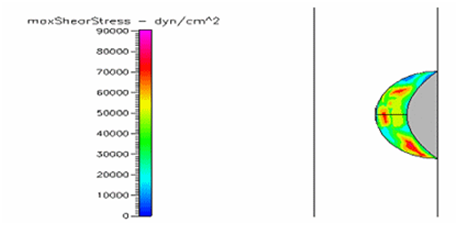
Figure 26 Shows the shear stress profile of semispherical thrombus at the center of the vessel with pre-hypertensive pressure and diabetic blood viscosity.

Figure 27 Shows the shear stress of semispherical thrombus at the center of the vessel with hypertensive pressure and diabetic blood viscosity.

Thrombus shear stress profiles for leukemic and diabetic viscosity have also been performed under normal, pre-hypertensive and hypertensive pressures. Leukemic viscosity has been reported to have reached values of about 6.2 cPoise or even higher.18,21 This is 70% more viscosity that normal blood. Figure 21 shows shear stress almost three times lower in leukemia than in normal blood. Furthermore, Figure 23 shows how leukemia, in combination with hypertension, only reaches maximum shear stresses of about 80000dynes/cm2 equivalent to normal physiological conditions. Although not as viscous as SCD and leukemic blood, diabetes mellitus also increases blood viscosity and it does cause less shear stress on a thrombus as shown in Figure 21 through Figure 23. However, there have been cases or extremely high viscosity in patients suffering from this disease.27,28 These findings point to the suggestion that thrombus would weaken slower, delaying the activation of the peel off mechanism, should it develop in conjunction with SCD, leukemia or diabetes. Further thought allows foretelling that thrombus to embolus transition in a leukemic patient would delay the most out of the mentioned complications. This may be of some value, although the effects of such conditions are not flattering at all towards the cardiovascular system having in mind that hypercoagulability conditions allows for higher blood viscosity which is chief among the causes of thrombus formation in the first place. A longitudinal study of these diseases about blood viscosity and thrombus fatigue may grant evidence for or against this hypothesis.

Conclusion

One of the principal achievements of this paper is the development a model that simulates blood flow through a vein afflicted with thrombosis by using CFD-GEOM and CDF-ACE+. It accounts for hemodynamic forces acting on the thrombus surface and vessel wall. It models the shear stress profiles acting on the thrombus and it allows varying its height, location along the vessel length, shape, blood pressure and blood viscosity. Results obtained from our simulations give a clear data of the risk of thrombus to embolus transition. A second important achievement of this study is the description of the peel off mechanism explained in detail in Figure 2. Here we proposed that activation of such mechanism occurs at t>>0. However, we have also determined that it could occur faster or it could be delayed as discussed in our results section. Our final achievement is the modeling of thrombus shear stress profiles under sickle cell disease, leukemic and diabetic blood viscosities as well as the simulations with blood pressure changes for normal, pre-hypertensive and hypertensive conditions for each of these diseases where their figures and results can be found on section 4 of this study. As cardiovascular conditions such as pulmonary embolism, stroke and myocardial infarction increase in the United States Population, so does the necessity for better diagnostic procedures and treatments. We hope that cardiovascular researchers benefit from this study as there is a need for scientific papers pertaining to thrombus-embolus transition.

Acknowledgements

This work was financially supported by the Norman Weldon Research Internship from the Department of Biomedical Engineering at Florida International University.

Conflict of interest

The author declares no conflict of interest.

References

  1. Mousa SA, Forsythe MS. Comparison of the effect of different platelet GPIIb/IIa antagonists on the dynamics of platelet/fibrin-mediated clot strength induced using thromboelastography. Thromb Res. 2001;104(1):49–56.
  2. Chadran K, Yoganathan A, Rittgers S. Bio-Fluid Mechanics: The Human Circulation. Atlanta: USA: CRC Press; 2007. p. 319–333.
  3. Wang DH, Makaroun M, Webster MW, et al. Mechanical properties and microstructure of intra-luminal thrombus from abdominal aortic aneurysm. J Biomech Eng. 2001;123(6):536–539.
  4. Alt E, Banyai S, Banyai M, et al. Blood theology in deep venous thrombosis-relation to persistent and transient risk factors. Thromb Res. 2002;107:101–107.
  5. Weisel JW. The mechanical Properties of fibrin for basic scientist and clinicians. Biophys Chem. 2004;112(2-3):267–276.
  6. Weisel JW. Biophysics. Enigmas of blood clot elasticity. Science. 2008;320(5875):456–457.
  7. Kyrle PA, Eichinger S. Deep vein thrombosis. Lancet. 2005;365(9465):1163–1174.
  8. Lim BB, Lee EH, Sotomayor M, et al. Molecular basis of fibrin clot elasticity. Structure. 2008;16(3):449–459.
  9. Mody NA, Lomakin O, Doggett TA, et al. Mechanics of transient platelet adhesion to von willebrand factor under flow. Biophys J. 2005;88(2):1432–1443.
  10. Meissner MH, Moneta G, Burnand K, et al. The hemodynamics and diagnostics of venous disease. J Vasc Surg. 2007;46(Suppl S):4S–24S.
  11. Hertzberg BS, Kliewer MA, DeLong DM, et al. Sonographic assessment of lower limb vein diameters: implications for the diagnosis and characterization of deep venous thrombosis. AJR Am J Roentgenol. 1997;168(5):1253–1257.
  12. Galili O, Mannheim D, Rapaport S, et al. A novel intermittent mechanical compression device for stasis prevention in the lower limbs during limited mobility situations. Thromb Res. 2007;121(1):37–41.
  13. Saladin K. Anatomy and Physiology. New York, USA: McGraw- Hill; 2001. p. 562–584.
  14. Silverthorn U. Human Physiology an Integrated Approach. Michigan: Pearson/Benjamin Cummings, USA; 2005. p. 362–311.
  15. Tillit M, Martinez S, Ramnath G, et al. Hemodynamics of sickle cell anemia with varying parameters. Ann Biomed Eng. 2008. p. 1–6.
  16. Adams RJ, McKie VC, Brambilla D, et al. Stroke prevention trial in sickle cell anemia. Control Clin Trials. 1997;19(1):110–129.
  17. Moritani T, Numaguchi Y, Lemer NB, et al. Sickle cell cerebrovascular disease Usual and unusual findings on MR imaging and MR angiography. Clin Imaging. 2004;28(3):173–186.
  18. Hild DH, Myers TJ. Hyperviscosity in chronic granulocytic leukemia. Cancer. 1980;46(6):1418–1421.
  19. Treleaven J. Acute leukaemia. Leukemia. 2004. p. 65–69.
  20. Majhail NS, Lichtin AE. Acute leukemia with a very high leukocyte count: Confronting a medical emergency. Cleve Clin J Med. 2004;71(8):633–637.
  21. Lichtman MA. Rheology of Leukocytes, Leukocyte suspensions and blood in leukemia. J Clin Invest. 1973;52(2):350–358.
  22. Birgens H, Ljung R. The Thalassemia syndromes. Scand J Clin Lab Invest. 1996;67(1):11–25.
  23. Koçak RK, Alparslan ZN, Ağridağ G, et al. The frequency of anaemia, iron deficiency, hemoglobin S and beta thalassemia in the south of Turkey. Eur J Epidemiol. 1995;11(2):181–184.
  24. Panigrahi I, Agarwal S. Thromboembolic complications in β-thalassemia: Beyond the horizon. Thromb Res. 2007;120(6):783–789.
  25. Thomas LA, Summers RR, Cardwell MS. Use of Greenfield filters in pregnant women at risk of pulmonary embolism. South Med J. 1999;90(2):215–217.
  26. Chan WS, Ginsberg JS. Diagnosis of deep vein thrombosis and pulmonary embolism in pregnancy. Thromb Res. 2002;107(3-4):85–91.
  27. Zingg W, Sulev JC, Morgan CD, et al. Blood viscosity in diabetic children. Diabetologia. 1971;7(6):461–462.
  28. Lowe GD, Lowe JM, Drummond MM, et al. Blood Viscosity in Young Male Diabetics with and without Retinopathy. Diabetologia. 1980;18(5):359–363.
  29. McMillan DE. Disturbance of Serum viscosity in diabetes mellitus. J Clin Invest. 1974;53(4):1071–1079.
  30. Yuan S, Liu Y, Zhu L. Vascular complications of diabetes mellitus. Exp Physiol. 1999;26:977–978.
  31. Galson SK. Prevention of deep vein thrombosis and pulmonary embolism. Public Health Rep. 2006;123(4):420–421.
  32. Kraaijenhagen RA, Haverkamp D, Koopman MM, et al. Travel and risk of venous thrombosis. Lancet. 2000;356(9240):1492–1493.
  33. Horsburgh J. Case report of a deep vein thrombosis in the femoral vein, an atypical presentation. Clinical Chiropractic. 2004;7:120–126.
  34. Goldhaber SZ, Correnti NG. Treatment of blood clots. Circulation. 2002;106:e138–e140.
  35. Wakefield TW. Treatment options for venous thrombosis. J Vasc Surg. 2000;31(3):613–620.
  36. Caprini JA, Arcelus JI, Motykie G, et al. The influence of oral anticoagulation therapy on deep vein thrombosis rates four weeks after total hip replacement. J Vasc Surg. 1999;30(5):813–820.
  37. Giannoudis PV, Pountos I, Pape HC, et al. Safety and efficacy of vena cava filters in trauma patients. Injury. 2007;38(1):7–18.
  38. Chiesa R, Melissano G, Castellano R, et al. Extensible expanded polytetrafluoroethylene vascular grafts for aortoiliac and aortofemoral reconstruction. Cardiovasc Surg. 2000;8(7):538–544.
  39. Doble M, Makadia N, Pavithran S, et al. Analysis of explanted ePTFE cardiovascular grafts (modified BT shunt). Biomed Mater. 2008;3(3):034118.
  40. Abraham P, Leftheriotis G, Desvaux B, et al. Diameter and velocity changes in the femoral vein during thermal stress in humans. Clin Physiol. 1994;14(1):15–21.
  41. Basmadjian D. Embolization: Critical thrombus height, shear rates and pulsatility. Patency of blood vessels. J Biomed Mater Res. 1989;23(11):1315–1326.
  42. Gasser TC, Görgülü G, Folkesson M, et al. Failure properties of intraluminal thrombus in abdominal aortic aneurysm under static and pulsating mechanical loads. J Vasc Surg. 2008;48(1):179–188.
Creative Commons Attribution License

©2017 Christie, et al. This is an open access article distributed under the terms of the, which permits unrestricted use, distribution, and build upon your work non-commercially.