Journal of
eISSN: 2572-8466


Research Article Volume 2 Issue 6
Nirma University, India
Correspondence: Vijay Kothari, Institute of Science, Nirma University, Ahmedabad, India, Tel 91-09998365230
Received: January 18, 2017 | Published: April 5, 2017
Citation: Sarvaiya N, Kothari V. Audible sound in form of music can influence microbial growth, metabolism and antibiotic susceptibility. J Appl Biotechnol Bioeng. 2017;2(6):212-219. DOI: 10.15406/jabb.2017.02.00048
Effect of a type of Indian classical music (Raag Malhar) comprised of the sound corresponding to a frequency range of 41-645Hz, on microbial growth, production of certain important metabolites and antibiotic susceptibility was investigated. All the bacteria and yeasts used as test organisms were found to register better growth under the influence of music, except Serratia marcescens. Music treatment was also found to promote production of bacterial pigments (prodigiosin and violacein) whose production is normally linked with quorum sensing in the producing bacteria. All the test organisms (except S. marcescens) exhibited an increased antibiotic susceptibility under the influence of music. Chromobacterium violaceum and S. marcescens were found to degrade cefazolin at a faster rate when incubated with music. Membrane permeability of the test organisms seemed to get altered owing to music treatment. Concentration of cations (calcium and potassium) and protein content of the music treated cultures was also significantly different than the untreated control. Alcohol tolerance of Saccharomyces cerevisiae was also notably enhanced under the influence of music.
Keywords: alcohol tolerance, calcium, membrane permeability, music, sound
CFS, cell free supernatant; HPLC, high performance liquid chromatography; ADCA, amino desacetoxycephalosporinic acid; ACA, amino cephalosporanic acid; TRP, transient receptor potential
Environmental factors are known to influence the growth and metabolism of different life forms.1 Audible sound, one of the environmental factors, has a wide distribution in natural world. When sounds of different tone, pitch, volume or frequency are integrated in a defined way, it produces music.2 A sound wave can be viewed as a disturbance transported through a medium via particle interaction and hence it can be characterized as a mechanical wave. Based on its frequency, sound can be broadly categorized into three categories: infrasound (up to 20 Hz), audible sound (20-20,000 Hz) and ultrasound (>20,000 Hz). In natural world nearly all life forms are surrounded by different kinds of sound and they also interact with these sounds. However, not enough efforts have been made to investigate the interaction between sound and biological systems.3 Even the use of physical signals such as sound waves, by the microorganisms for their intercellular communication has not received due attention.4 All living beings seem to be somehow getting affected by sound (audible/otherwise may be random sound/defined sound pattern in form of music) in a variety of ways and at differing levels. It has been claimed that Mozart’s music makes people more intelligent and improves health.5 Audible sound treatment has been shown to increase the colony forming ability of E. coli and also to alleviate the inhibitory effect of salt stress on E. coli growth in presence of increased concentration of sodium chloride.3 Pornpongmetta et al.6 reported microbial substrate utilization of aerobic bacteria from municipal waste water treatment plant to be affected by music. Ayan et al.7 have shown that low-intensity pulsed sound can affect morphology and genetics of Staphylococcus aureus. Eukaryotic life forms have also been reported to be influenced by sound. Wang et al.8 reported plasma membrane H+ ATPase activity of Chrysanthemum callus to be influenced by sound stimulation. Synthesis of nucleic acid and protein in Chrysanthemum has also been reported to be affected by sound waves.1 The present study attempted to investigate the effect of one of the Indian classical music-raag Miyan-Malhar (Raag refers to any particular defined sound pattern in Indian classical music) on microbial growth and production of certain industrially important metabolites by them.
Test organisms
Table 1 lists the prokaryotic and eukaryotic microorganisms used in this study and the parameter on which influence of music was investigated. All the test strains were procured from Microbial Type Culture Collection (MTCC, Chandigarh). All media were from Hi Media, Mumbai.
Music treatment
Sound stimulation of the test microbial culture(s) was executed as described in Sarvaiya et al.9 Frequency of the music played, as analyzed by WavePad Sound Editor Masters Edition v 5.5, was 41-645 Hz (Figure 1). Intensity of the sound, measured (with a sound level meter- ACD machine control Ltd.) at a distance of 15 cm from the speaker was 95-110 dB. Absence of detectable sound in the control chamber was ensured using decibel meter.
No. |
Organism |
MTCC Code |
Growth Medium |
Incubation Temperature (°C) |
Incubation Time(h) |
Parameter(s) Tested |
1 |
Xanthomonas campestris |
2286 |
Tryptone yeast extract broth supplemented with 0.7 g/L CaCl2 |
Room temperature |
72 (with intermittant shaking) |
Growth and Exo poly saccharide (EPS) production |
2 |
Chromobacterium violaceum |
2656 |
Nutrient broth |
35 |
24 (under static condition) |
Growth and violacein production |
3 |
Serratia marcescens |
97 |
30 |
Growth and prodigiosin production |
||
4 |
Staphylococcus aureus |
737 |
37 |
Growth |
||
5 |
Streptococcus pyogenes |
442 |
37 |
|||
6 |
Streptococcus mutans |
497 |
Brain heart infusion broth |
35 |
48 (static condition) |
|
7 |
Saccharomyces cerevisiae |
170 |
Glucose yeast |
Room temperature |
24 (static condition) |
Growth, alcohol production and alcohol tolerance |
8 |
Candida albicans |
3017 |
35 |
Growth |
Table 1 Test organisms and parameters estimated.
Estimation of growth and antibiotic susceptibility
Following incubation, growth in the experimental and control tubes was quantified by recording OD at 660 nm. During the same experiment, inoculation was also done in antibiotic containing media, in presence and absence of music, to check influence of music on antibiotic susceptibility of the test organisms. Amphotericin B (HiMedia) for yeasts and streptomycin (HiMedia) for bacteria, were used at sub-MIC (minimum inhibitory concentration) levels.
Violacein extraction and estimation
After quantifying growth by recording OD at 660 nm using spectrophotometer (Spectronic 20 D+, Thermo scientific), violacein extraction from C. violaceum culture was carried out as described in Choo et al.10 Briefly, 3 ml of the culture broth was centrifuged (Eppendorf 5417 R) at 12,000 rpm for 15 min and the resulting supernatant was discarded. The remaining cell pellet was re-suspended into 3 ml of DMSO (Merck, Mumbai) and incubated at room temperature for 30 min, followed by centrifugation at 12,000 rpm for 15 min. The violacein extracted in the supernatant was estimated by measuring OD at 585 nm.11
Prodigiosin extraction and estimation
After measuring growth at 660 nm, prodigiosin extraction from S. marcescens culture was carried out as described in Pradeep et al.12 Briefly, 3 ml of the culture broth was centrifuged at 12,000rpm for 15 min and the resulting supernatant was discarded. The remaining cell pellet was re-suspended in 3 ml of acidified methanol (4 ml of HCl into 96 ml of methanol; Merck), followed by incubation in dark at room temperature for 30 min. This was followed by centrifugation at 12,000 rpm for 15 min at 4°C. Prodigiosin in the resulting supernatant was estimated by measuring OD at 535 nm.
EPS quantification
After estimating the growth by measuring OD at 660 nm, culture broth was subjected to centrifugation at 7,500 rpm for 15 min and the cell free supernatant (CFS) was used for EPS quantification employing the method described in Li et al.13 with some modification. Briefly, 40 ml of chilled acetone (Merck) was added to 20 ml of CFS and allowed to stand for 30 min. The EPS thus precipitated was separated by filtration through pre-weighed Whatman#1 filter paper (Whatman International Ltd., England). Filter paper was dried at 60°C for 24 h and weight of EPS on paper was calculated.
Alcohol estimation
Alcohol was estimated photometrically. S. cerevisiae culture broth was centrifuged at 12,000 rpm for 15 min and the supernatant was subjected to alcohol estimation. One ml of the supernatant was mixed with 15 ml of distilled water and 25 ml of potassium dichromate reagent, followed by 10 ml of additional distilled water. Then incubation was carried out in water bath at 60°C for 30min, followed by measurement of OD at 600 nm. Standard curve was prepared using absolute ethanol (Eureka, Ahmedabad) at 2-10% v/v.
Evaluation of alcohol tolerance
S. cerevisiae was grown in GYE broth containing various alcohol concentrations (5-15 % v/v), with and without music. Following incubation (till appearance of visible growth), OD was measured at 660 nm. As a viability check, a loopful of culture (before measurement of growth) was streaked under aseptic conditions from each of the test tube onto GYE agar plate, followed by incubation at room temperature for 24 h.
Antibiotic uptake assay
As an indirect estimation of the amount of antibiotic taken up by the organism from the medium, concentration of antibiotic in the extracellular broth was measured (at the end of incubation) through high performance liquid chromatography (HPLC). The HPLC system (Shimadzu) was operated with a C18 column. Mobile phase contained methanol: Acetonitrile (40:60) for streptomycin and Acetonitrile: methanol (40: 60) for amphotericin B. Flow rate was kept 0.8 ml/min in case of streptomycin and 1.50 ml/min in case of amphotericin B. Detection wavelength was set at 382 nm and 280 nm respectively for amphotericin B and streptomycin.
Outer membrane permeability assay using cephalosporin
This assay was performed with two of the cephalosporin resistant gram-negative test organisms i.e. C. violaceum and S. marcescens. These organisms were inoculated in nutrient broth containing cefazolin (HiMedia) at 100µg/ml, with and without music. Following which OD was measured (Agilent) every 30 min (till 180min) at 660 nm (for estimation of growth), 278.5 nm (for determination of 7-amnio Desacetoxycephalosporinic acid; 7-ADCA),14 276.3 nm (for determination of 7-amino Cephalosporanic acid; 7-ACA) and 260 nm (for determination of cefazolin; Nikaido15).
Estimation of calcium, potassium and protein
After incubation, growth was quantified by measuring OD at 625 nm. Before proceeding further turbidity of control and experimental tubes were brought to the same level by diluting them appropriately. The broth containing microbial growth was subjected to centrifugation (nüve®, NF 800R) at 12,000 rpm for 15min. The CFS obtained after centrifugation was used for estimating extracellular calcium and potassium in case of S. cerevisiae. In case of bacteria, the cell pellet was subjected to cell lysis and the lysed content (after clarification by centrifugation at 12,000 rpm for 15 min) was used for estimation of intracellular calcium, potassium and intracellular protein content. Cell lysis was performed using the method described in Harley and Prescott16 with some modification. Briefly, the cell pellet obtained after centrifugation was suspended in 0.1 M phosphate buffer (pH 6.2), followed by addition of 0.05 ml of lysozyme (HiMedia, Mumbai) solution (2 mg/ml). This mixture was gently agitated and kept at room temperature for 1 h. Then the tubes containing this reaction mixture were placed in chilled water for 1 h, followed by addition of chloroform (Merck) into it and then incubated for 2 h at room temperature in case of gram-negative bacteria. For gram-positive bacteria, length of this incubation was kept 12 h (as 2 h incubation in their case was found to give incomplete lysis), following which the content was centrifuged (12,000 rpm for 15 min) and the supernatant was utilized as cell lysate. Calcium, potassium and protein estimation in the cell lysate thus obtained was carried out on an automated COBAS® INTEGRA 400 plus platform. Calcium estimation was based on O-cresolphthalein complexone method.17 Potassium estimation was based on an ion-selective electrode. Protein estimation was based on biuret method.
Statistical analysis
All the experiments were performed in triplicate and measurements are reported as mean ± standard deviation (SD). Statistical significance of the data was evaluated by applying t-test using Microsoft Excel®. Data with p values less than 0.05 was considered to be statistically significant.
Results regarding effect of music on microbial growth and the selected metabolites are presented in Table 2. Growth of all the test organisms was enhanced due to music treatment, except S. marcescens. However, production of the particular metabolite tested was enhanced by music in all cases including S. marcescens. The magnitude of increase in production of prodigiosin, violacein, EPS, or alcohol due to music was higher than the magnitude of increase in growth. This was due to increased production and/or secretion of test metabolite by individual cell (as indicated in the last column of Table 2), under influence of music. The change obtained in production of a particular metabolite was not parallel to the change obtained in the growth of the producing organism. In addition to growth and metabolite production, antibiotic susceptibility of the test organisms was also significantly affected by music (Table 3). Except S. marcescens, all test organism’s registered increased susceptibility to the antibiotic used, under influence of music. We assumed that this might be due to increased uptake of the antibiotic by the microbial cells under influence of music. To check whether this is the case, we determined extracellular concentration of the antibiotic (through HPLC) in the culture broth of one prokaryotic test organism (S. mutans) and one eukaryotic test organism (S. cerevisiae). The extracellular antibiotic concentration was found to be lesser in case of music treated cultures as compared to the control (Figure 2 & Figure 3), indicating that antibiotic uptake by the music treated cells was higher than the control cells. Further, the percent increase in the antibiotic uptake was higher than the percent increase in growth in the music treated cultures, indicating that higher uptake was not solely due to higher cell density in the music treated cultures.
Organism |
Growth (OD660) |
Prodigiosin (OD535) |
Prodigiosin Unit (OD535/OD660) |
||||||
S. marcescens |
Control (Mean± SD) |
Experimental (Mean± SD) |
% Change |
Control (Mean± SD) |
Experimental (Mean± SD) |
% Change |
Control |
Experimental |
% Change |
0.624± 0.003 |
0.580± 0.003 |
-7.05 |
0.213± 0.010 |
0.312±0.016 |
46.47 |
0.341 |
0.537 |
57.47 |
|
Growth (OD660) |
Violacein Production (OD585) |
Violacein Unit(OD585/OD660) |
|||||||
C. violaceum |
Control (Mean± SD) |
Experimental (Mean± SD) |
% Change |
Control (Mean± SD) |
Experimental (Mean± SD) |
% Change |
Control |
Experimental |
% Change |
0.598±0.006 |
0.654±0.012 |
9.36 |
0.191±0.001 |
0.366±0.005 |
91.62 |
0.319 |
0.559 |
75.23 |
|
Growth (OD660) |
EPS Production (g/L) |
EPS Production Per Unit OD (g/L) |
|||||||
X. campestris |
Control (Mean± SD) |
Experimental (Mean± SD) |
% Change |
Control (Mean± SD) |
Experimental (Mean± SD) |
% Change |
Control |
Experimental |
% Change |
0.291±0.006 |
0.319±0.006 |
9.62 |
2.700±0.002 |
3.800± 0.007 |
40.74 |
9.27 |
11.91 |
28.47 |
|
Growth (OD660) |
Alcohol Production (% v/v) (OD600) |
Alcohol Production Per Unit OD (% v/v) |
|||||||
S. cerevisiae |
Control (Mean± SD) |
Experimental (Mean± SD) |
% Change |
Control (Mean± SD) |
Experimental (Mean± SD) |
% Change |
Control |
Experimental |
% Change |
1.633± 0.005 |
1.703± 0.015 |
4.28 |
2.190± 0.005 |
2.460± 0.005 |
12.32 |
1.34 |
1.44 |
7.46 |
|
Growth (OD660) |
|||||||||
Control (Mean± SD) |
Experimental (Mean± SD) |
% Change |
|||||||
S. mutans |
0.278±0.002 |
0.301±0.007 |
8.27 |
||||||
S. aureus |
0.397±0.001 |
0.435±0.007 |
9.57 |
||||||
S. pyogenes |
0.470±0.006 |
0.540±0.003 |
14.89 |
||||||
C. albicans |
0.982±0.007 |
1.112±0.010 |
13.23 |
||||||
Table 2 Effect of music on microbial growth (harvest) and production of certain metabolites.
To further confirm that transport of solutes (such as antibiotics) through membrane is getting affected due to music, we performed an assay to measure release of cephalosporin degradation products under the influence of music. It is possible to measure the diffusion rates through porin channels in intact cells by coupling the influx of hydrophilic solutes with a “sink” process. This can be done by studying the influx of cephalosporins by coupling it to their hydrolysis by periplasmic β-lactamase. Cephalosporins are especially useful because the hydrolysis can be monitored easily by recording changes in the optical density at 260 nm.15 We performed this assay using cefazolin, with two gram-negative β-lactamase producer bacteria i.e. C. violaceum and S. marcescens. Cefazolin degradation (and subsequent release of the degradation products) occurred at a faster rate under the influence of music (Figure 4 & 5). In S. marcescens, uptake of cefazolin seemed to be slowed down by music. This decreased uptake of solutes by S. marcescens in presence of music may be responsible for its reduced growth (Table 2) and antibiotic susceptibility (Table 3). After observing the ability of the music to influence growth of the test organisms, we further investigated whether flux of calcium and potassium and intracellular protein synthesis are altered due to music treatment. Table 4 shows changes recorded in calcium and potassium concentration and intracellular protein content in three of the test organisms (protein measurement only for bacteria) under the influence of music. In both bacteria the intracellular calcium and protein concentration was found to be lower in music treated cells, however intracellular potassium concentration was notably higher in music treated cells of C. violaceum. In case of S. cerevisiae, music treatment resulted in reduced intracellular calcium and increased extracellular potassium concentration, as it happened with intracellular concentration of these cations in C. violaceum.
Organism |
Concentration of Antibiotic (µg/ml) |
Growth Without Music (OD660) |
% Inhibition (A) |
Growth With Music (OD660) |
% Inhibition (B) |
% Increase in Antibiotic Susceptibility Due to Music [(B)-(A)] |
||
2Control (Mean± SD) |
3Experimental (Mean± SD) |
2Control (Mean± SD) |
3Experimental (Mean± SD) |
|||||
S. marcescens |
5 |
0.624± 0.003 |
0.599± 0.001 |
5.47 |
0.580± 0.008 |
0.918± 0.012 |
(58.27% higher growth; no inhibition) |
Not applicable4 |
C. violaceum |
2 |
0.598± 0.006 |
0.404±0.004 |
32.44 |
0.654± 0.012 |
0.358± 0.003 |
45.25 |
12.81 |
S. mutants |
30 |
0.278± 0.002 |
0.038± 0.001 |
86.33 |
0.301± 0.007 |
0.026± 0.003 |
91.029 |
4.69 |
S. aureus |
2.5 |
0.397± 0.001 |
0.252± 0.004 |
36.52 |
0.435± 0.007 |
0.121± 0.0005 |
72.18 |
35.66 |
S. pyogenes |
2.5 |
0.470± 0.006 |
0.281± 0.005 |
41.21 |
0.540± 0.003 |
0.235± 0.005 |
56.48 |
15.19 |
S. cerevisiae |
5 |
1.633± 0.005 |
1.353± 0.005 |
17.14 |
1.696± 0.005 |
1.383± 0.005 |
18.16 |
1.06 |
C. albicans |
5 |
0.982± 0.007 |
0.845± 0.005 |
13.95 |
1.112± 0.010 |
0.821± 0.003 |
26.16 |
12.21 |
Table 3 Effect of music on antibiotic susceptibility of the test organisms.
Organism |
% Increment in Growth Due to Music (OD660 not shown) |
Calcium (µg/ml) |
Potassium (mM) |
Total Protein (µg/ml) |
||||||
Control |
Expt. |
% Change |
Control |
Expt. |
% Change |
Control |
Expt. |
% Change |
||
C. violaceum (Intracellular) |
8.1 |
3.1± 0.03 |
3± 0.06 |
-3.22 |
105± 1.05 |
149± 2.98 |
41.9 |
1± 0.010 |
0.9± 0.016 |
-10 |
S. pyogenes (Intracellular) |
25.4 |
3.7± 0.04 |
3.3±0.01 |
-10.81 |
129±1.29 |
128±0.71 |
-0.77 |
1.3± 0.023 |
0.9± 0.016 |
-30.76 |
S. cerevisiae (Extracellular) |
9.17 |
3.4± 0.01 |
3.3±0.02 |
-2.94 |
30±0.09 |
31±0.27 |
3.33 |
Not determined |
||
Table 4 Influence of music on calcium, potassium, and total protein content.
The increased production of pigments like violacein and prodigiosin (whose production is regulated by quorum sensing) in music treated cells (Table 2) becomes more interesting in the light of the fact that flux of calcium is also influenced by music (Table 4), as calcium has an important role in signal transduction. The role of calcium as a cell regulator is well established in eukaryotes and now being recognized in prokaryotes too. Involvement of calcium ions has been demonstrated in the maintenance of cell structure, motility, transport and cell differentiation processes. A number of calcium binding proteins have been isolated in many prokaryotic organisms. The Ca2+ ion acts as a universal messenger, transmitting signals from the cell surface to the cell interior. Cells respond to a variety of stimuli by transient changes in the intracellular free Ca2+ concentration, which is under tight regulation.18 Genes encoding homologues of most animal channels [e.g., K+-, Na+-, Cl−-specific; Ca2+-, cNMP-, voltage-activated and transient receptor potential (TRP) channels] have been documented in microbes.19 Ca2+ gated channels are among those gated by mechanical forces.20 A sound wave is characterized as a mechanical wave, which while passing through the liquid medium (microbial growth medium) creates vibrations. These vibrations, a form of mechanical force, can affect functioning of gated channels of the microbial cells. As a mechanical wave, audible sound would produce a mechanical stress to the microbial cells. Bacteria can respond to stress (or shock) by changing intracellular calcium concentration. Cyanobacteria were shown to modulate their intracellular calcium concentration in response to cold or heat shock.21 In addition to studying effect of music on growth and alcohol production in S. cerevisiae, we also investigated its effect on alcohol tolerance of this yeast (Table 5). Music treatment resulted into a notable increase in the alcohol tolerance of S. cerevisiae. In presence of alcohol from 5-12.5 %v/v the music treated experimental tubes showed significantly higher growth than the control tubes. At 15 %v/v alcohol, no growth was visible in the control tubes (not treated with music) till 120 h of incubation, whereas music induced experimental tubes had some growth. Following incubation loopful of culture from control as well as experimental tubes was plated onto GYE agar. This resulted into appearance of 167±13colonies in the plates corresponding to music treated culture, where as no growth appeared on the control plates. Tolerance of the alcohol producing organism to the higher concentrations of alcohol is a desired trait during industrial production of alcohol.22
Concentration of Ethanol (%v/v) |
Incubation Period (h) |
Control (OD660) (Mean± SD) |
Experimental (OD660) (Mean± SD) |
% Increment Due to Music |
5 |
24 |
0.641± 0.008 |
0.857± 0.010 |
33.691 |
10 |
24 |
0.085± 0.003 |
0.198± 0.002 |
132.941 |
12.5 |
48 |
0.111± 0.004 |
0.142± 0.010 |
27.922 |
15 |
120 |
0.007± 0.003 |
0.091± 0.002 |
12001 |
Table 5 Effect of music on alcohol tolerance in S. cerevisiae.

Figure 2 Faster decrease in extracellular concentration of streptomycin in music treated S. mutans culture
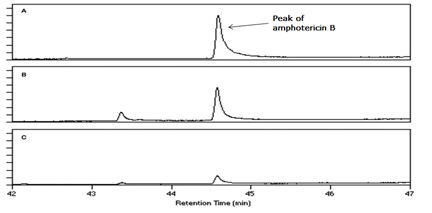
Figure 3 Faster decrease in extracellular concentration of amphotericin B in music treated S. cerevisiae culture
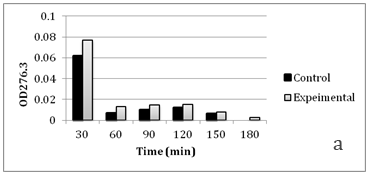

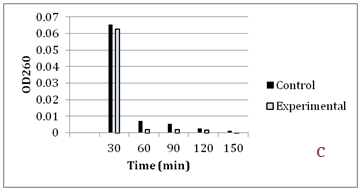
Figure 4 Faster cephalosporin degradation by music treated culture of C. violaceum.

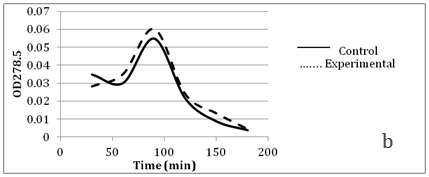
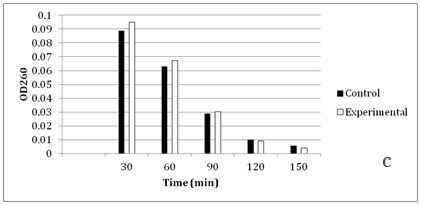
Figure 5 Faster cephalosporin degradation by music treated culture of S. marcescens.
This study has shown that sound (in form of music) can affect microbial growth and metabolism to a noticeable extent. In addition to growth, movement of antibiotics and/or their degradation products across the cell membrane, flux of calcium and potassium and intracellular protein concentration in bacteria were also affected by music treatment. Earlier few reports.3,6,7,8,23 have indicated the ability of sound to influence microorganisms. Sound (whether in form of music or otherwise) can travel through the growth medium in which microbes are inoculated and this can give rise to vibrations. Bacteria have been shown to be capable of sensing the vibrational acceleration and responding to it. Vibrational acceleration was shown to induce changes in the growth curve of certain bacteria (Escherichia coli, Bacillus subtilis, Pseudomonas aeruginosa and S. aureus), such as reduction in lag time and higher growth rate. Vibration could also affect the oxygen consumption by the test organisms.24 The observed changes in microbial activity in response to music may be owing to the combination of a variety of factors e.g., altered substrate utilization,6 altered membrane permeability and selectivity.25 enhancement of the metabolic capacity of the cell by promoting the enzymatic activities, change in the ability of the cells to synthesize RNA and protein1, or altered movement of certain cations across the cell, etc. The ability of microorganisms to generate, sense and respond to physical signals including sound waves had been documented.26 Experimental evidences suggesting microbial emission and response to physical signals like sound waves, electromagnetic radiation and electric currents are available. These signals can propagate rapidly [e.g. a sound wave with a frequency of 2280 Hz-which is within the audible range- will travel in water at a velocity of 1490 m/s, at 25°C, even at low intensities, they can elicit a rapid response from the sensing microorganisms.4 Sound waves can have role in microbial cell-cell communication, in both prokaryotes (bacteria) and eukaryotes (yeast and protozoa). As physical signals like sound waves are less amenable to diffusion constrains and can propagate through cells and different media, they can enable faster cellular responses. The energy inherent in sound signals can serve as a language during physical mode of microbial communication. Matsuhashi et al.26 suggested the possible function of sound waves as a growth-regulatory signal between bacterial cells. Cells emit and perceive sounds at wavelengths exceeding their own size.
In the present study we have found the intracellular concentration of two cations (calcium and potassium) getting affected by music. Activation of an ion channel can be the mechanism for the perception of sound. All cells, including microbes, detect and respond to mechanical forces. Channel proteins have evolved such that they can be directly stretched open when the membrane is under pressure. The ion flux through mechanosensitive channel proteins can change in response to external pressure/vibration. Mechanosensitive channels can serve as good models to scrutinize how membrane forces direct protein conformational changes. The mechanosensitive channel in yeast is also directly sensitive to membrane stretch. It is quite possible that proteins embedded in the lipid bilayer can respond to the changes (resulting from the vibrations created by sound waves) in the mechanical environment the lipid bilayer provides.18 In response to the vibrations generated owing to travelling of sound waves in the nutrient medium, cells may undergo repeated expansion and contraction, giving rise to a different sound; which may further be sensed by neighbouring cells and elicit some response in them. These mechanisms can involve the conversion of ATP and membrane potentials to movement. Intracellular conversion of the sound received by bacterial cells into electromagnetic waves is also theoretically possible.27 In the experimental set-up described in our study, sound is passing through air, the test tube made of glass and the liquid growth medium before reaching the microbial cell itself. Further, we conducted these experiments inside a glass chamber, from the walls of which sound can get reflected. Sound travels through different materials at a different speed, as the structure of each material can affect transmission. Sound usually travels faster in regular dense structures i.e. it will travel faster in solids followed by liquids and gases. When a wave of a specific frequency travels into materials of differing densities (as was the case in our experiments), the speed and wavelength changes. Thus the same frequency of sound can elicit different response from the same organism, if the medium through which sound transmits is different.
The ability of biological cells to sense and respond to wide variety of stimuli including light, mechanical force, chemicals, etc. is beyond doubt. Though quite a few reports have accumulated in literature suggesting the impact of sound on cellular activity, explaining the mode of action of sound on biological systems remains a complicated and challenging task. Research in this field is at a relatively early stage and it is not very clear how sound-based mechanisms may work. Sound can be viewed as a mechanical force and cells do possess receptors on the membrane which can sense mechanical pressure. All the microbial cells in a mono species population can be viewed as structures with similar resonant frequencies and they can synchronize to resonate together. This phenomenon of sympathetic resonance can be of significance while explaining influence of sound on biological systems.28 Future work in mechanosensory biology to study the interactions between cells and sound may uncover the underlying mechanism(s). Mechanosensory channels which can sense stretch on the cell membrane are distributed throughout the living world.29 A particular type of accumulation of proteins on the cell edges known as focal adhesions are believed to mediate mechanical signals from the cell exterior. The music played in the current study was corresponding to a frequency range of 41-645 Hz. Multiple studies have reported mechanical oscillations of the developing cells at even about 1 Hz30,31 indicating that cells can communicate mechanically at these frequencies. Future biology may see a consensus building on the biological significance of acoustic effects. With deeper understanding of bioacoustics, some microbiological applications may also be developed. For example, use of music in fermentation industry for increased production, or accelerating waste-treatment by microbes.
Authors thank Nirma Education and Research Foundation (NERF), Ahmedabad for financial and infrastructural support.
The author declares no conflict of interest.

©2017 Sarvaiya, et al. This is an open access article distributed under the terms of the, which permits unrestricted use, distribution, and build upon your work non-commercially.