eISSN: 2379-6367


Review Article Volume 5 Issue 2
St. John's University, USA
Correspondence: Rohan Ramnarain, St. John's University, USA , Tel 9548260403
Received: March 02, 2017 | Published: March 20, 2017
Citation: Piracha Z, Hoque I, George S, et al. A widespread post marketing surveillance study of the top performing drug-adverse reaction pairings in the FDA adverse event reporting system database from 2004 to 2015. Pharm Pharmacol Int J. 2017;5(2):48-49. DOI: 10.15406/ppij.2017.05.00114
post marketing, biologic products, drugs, pharmacovigilance signals, FDA communication systems, faers, ortho evra, vioxx, byetta, alli, enbrel, humira, tysabri
The Food and Drug Administration compiles safety data on all drug products from around the world in what is known as the FDA Adverse Event Reporting System (FAERS).1 The FAERS database keeps track of FDA’s post marketing surveillance for drug and therapeutic biologic products. Wide scale analysis of top drug adverse event reactions from FAERS data can be used to determine what relationship has the strongest correlation. This may be a reliable albeit not infallible way to detect Pharmacovigilance signals throughout a dataset and determine what warrants further attention or black box warnings through the FDA communication systems. Large scale mathematical analysis is conducted every year to determine the most commonly reported drugs and drug-associated adverse events as a pairing (x drug, y reaction). Through more detailed analysis, the researchers were able to illuminate the highest reporting drugs and associated adverse events with those drugs.
The preliminary data is as follows
This experiment aims to elicit the strength of these associations through the measurement of the PRR interval, a ratio generated from a 2x2 contingency table, comprising all reports with the drug and its reaction, all reports with the drug and no reaction, all reports with the reaction and no drug, and all other reports. From this, a PRR will be generated, allowing us to evaluate the context of these reactions and elucidate which one was the most prevalent throughout its year of incidence.2
The FAERS database is publicly available data and has been de-identified of original reports involved patients. The participants reported by physicians, pharmacists, or manufacturer's generated reports purposefully designed to be scrubbed of patient identifiers once assimilated into the FAERS through Med Watch. The data collected will consist of two main parts: safety report_ id (a number that coin cides each drug along with its reported reactions) and reactionmedrapt (description of the reaction). The most suitable statistical tool scenario is a two-by-two contingency table with PRR values, which will be calculated through a Microsoft Excel function, PRR=A/(A+B)/C/(C+D). The top drug-adr relationship calculated for each year we’re sought to determine the strength of each relationship by evaluating the cumulative FAERS data from that year to elicit a PRR value for each pairing within each year.3
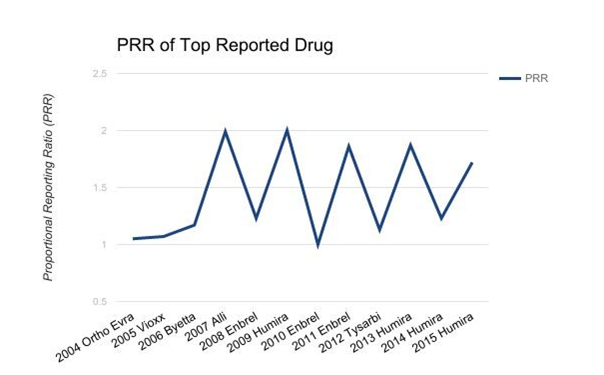
The top reported drugs from 2004 to 2015 include Ortho Evra, Vioxx, Byetta, Alli, Enbrel, Humira, and Tysabri. The rate of patients who were exposed to the medication and experienced an adverse event ranged from 1.00 to 2.00. This relative ratio shows that each drug was specific to a particular adverse event. The results are charted below Figure 1.

Figure 1 PRR of TOP reported drug.
Top Drug ADR pairing: Ortho Evra/ MI, 2004; Vioxx/Thromboembolic Events, 2005; Byetta/Nausea, 2006; Alli/Rectal Leakage, 2007; Enbrel/Drug Associated Infection, 2008; Humira/Injection Site Reactions, 2009; Enbrel/Drug Associated Infection, 2010; Enbrel/Drug Associated Infection, 2011; Tysarbi/Headache, 2012; Humira/Injection Site Reactions, 2013; Humira/Injection Site Reactions, 2014; Humira/Injection Site Reactions, 2015.
With no background data on baseline clinical characteristics of the patients experiencing the purported drug-adverse event reaction, few conclusions can be drawn from this data to net real clinical significance. This is a retrospective study, in that the data is from participants who were on the medications studied between 2004 and 2015 and experienced the drug reactions severe enough to meet the criteria for Med Watch submission. Since all of the adverse reports are not recorded, all of the adverse events in the database may not demonstrate the totality of the population. Also, the FDA has recommendations to what constitutes a serious adverse event and so the data has a penchant towards serious side effects. Consequently, underreporting makes it difficult to assess all side effects that patients experienced while on the medications. However, it should be noted that the majority of these top performers in pairings had PRR intervals well over 1, and that the most commonly reported drugs are not simply the most used but also potentially the ones most correlative to ADRs. However, we cannot definitively say that these drugs will cause an ADR. Future studies will have to continue to evaluate the relationship between these drugs and their most commonly related ADRs Figure 2.
None.
Author declares that there is no conflict of interest.

©2017 Piracha, et al. This is an open access article distributed under the terms of the, which permits unrestricted use, distribution, and build upon your work non-commercially.