eISSN: 2576-4543


Research Article Volume 4 Issue 1
1Department of Physics, Faculty of Engineering, University of Buenos Aires, Argentina
2Royal Netherlands Institute for Sea Research, Formerly SRON Laboratory for Space Research, The Netherlands
Correspondence: Silvia Duhau, Department of Physics, Faculty of Engineering, University of Buenos Aires, Argentina, Av. Paseo Colû°n 850, C1063ACV CABA, Argentina
Received: January 18, 2020 | Published: February 25, 2020
Citation: Duhau S, Jager C. Solar dynamo modes of oscillations and the long -term prediction of solar activity. Phys Astron Int J. 2020;4(1):34-58. DOI: 10.15406/paij.2020.04.00201
We verify that the values and dates of occurrence of sunspot maxima during Schwabe sunspot cycles ##19 to 24 as predicted by Derek Justin Schove in 1955 coincide with the actually observed ones with a high degree of accuracy. A question arises from this result: why is such a deterministic behavior apparent in a system, like the solar dynamo, that is in principle stochastic. We find that solar activity related data may be well represented by the addition of a constant level and eight modes of oscillation. The repetitive behavior and the relationships that appears to exist between these modes, opens the possibility for a long-term prediction of solar activity. In that line, we forecast the Gleissberg cycle for the forthcoming two centuries and data on sunspot maxima for the next century. Thus, we predict the values and dates of occurrence of sunspot maxima ##25 to 35 and find that the new Episode of solar activity that started during polar cycle #24, as a follow-up of the 20th century Grand Maximum, is of the Regular type and, as the ongoing Hallstatt oscillation will pass through zero from negative to positive around the year 2036, it will last for the remainder of the present millennium. We also find that modes of oscillations are mutually related through a forced non-linear oscillator with a persistent asymmetry. A brief discussion of the origin of this behavior on the excitation of solar dynamo motions by solar-planetary forces is presented.
Keywords: solar activity, sunspot cycles, toroidal and poloidal proxies, transition state, regular episode, grand maximum, grand minimum
SNmax, sunspot maxima; Sc55, sunspot maxima; VADM, virtual axial dipole moment; G-O, gnevyshev-oh1; HCS, heliosphere current sheet; PMC, planetary mass center
In earlier papers, we introduced a wavelet-based method for analyzing solar activity. To that end we used proxies for the solar toroidal and the polar magnetic fields: viz. the sunspot numbers at the maxima of successive Schwabe cycles and the geomagnetic index aa at the minima of these cycles. When these two proxies assume simultaneously their ‘Transition values` the Gleissberg cycle undergoes sudden increases in amplitude and duration, thus starting either a Grand Maximum or a Grand Minimum. In addition to these two types of Solar Dynamo Episodes, a third one consisting of a succession of weaker quasi-regular oscillations, the Regular Episode, is also identified. We also found that the Transition values of the proxies of the toroidal and the polar components of the Solar Dynamo magnetic field are the signatures of a well-defined Solar Dynamo state that we baptized ‘Transition State’. The above approach is further developed here with the aim to determine and forecast solar dynamo modes of oscillation. The basic material consists of the 7080 years long radiocarbon Intcal 98 time series and a 1725 years long Sunspot Maxima time series. This last was found from the recently published revised system of telescopic sunspot number counting1 extended backwards from the year 1704 till 290 by Schove’s Schove2 sunspot maxima time series. The latter is for the most part based on naked eye observations of sunspot numbers and of auroral frequencies. One of the main changes introduced on SNmax (red point on Figure 1) is to drop the conventional 0.6 Zürich scale factor that was assumed for data prior to the 19th century. Thus the scale of the entire sunspot number time series was raised to the level of modern sunspot counts. This procedure removed a persisting ambiguity caused by the systematically low early sunspot numbers, as compared with all modern sunspot counts that were made since the late part of the 19th century.
The only prediction of solar activity for considerably more than one sunspot cycle in advance is that of Schove2 who predicted values for sunspot maxima #19 to #24 (pink open squares in Figure 1). His prediction was based on ‘some regularities’ that he found in the sunspot maxima time series based on telescopic sunspot observations since 1610 and in addition on earlier visual records over the past ~1400 years and on observations of aurorae. As the Schove2 time series is based on the Zürich definition of sunspot numbers, we divided them by the factor 0.6 in order to bring their values to the level of modern sunspot counting. The same procedure was followed with our predictions for sunspot maximum #24.3,4 (Open circle on Figure 1). We see in Figure 1 that during the whole time interval for which the maximum sunspot numbers per Schwabe cycle, the SNmax data are known, the values of sunspot maxima from Sc55 (blue open squares) are very near to those inferred from SNmax (red dots), including the six that were predicted by Schove2 (Sc55; pink open squares). Also, at the end of the Maunder Minimum the Sc55 data overlap well with SNmax. Thus, the largest peaks in SNmax have similar values, in contrast to those of the traditional version of the sunspot counting system, for which those occurring during the 20th Century Maxima were about twice the previous ones. Similarly, the depth of the Maunder Minimum, that was in the traditional version twice that of the Dalton one has now, in Schove’s time series, a comparable value. This homogeneity in the behavior of peaks and valleys is kept in Schove’s time series during the last 1725 years, cf. Section 2. By comparing the observed values for sunspot maxima (the succession of blue open squares and red points in Figure 1) with the values of the envelope (red curve) at their respective dates of occurrence we found that each of them differs, on the average, by only 4% from that of the envelope (dashed black curve in Figure 1). Thus, it appears that once the sunspot maxima envelope is being predicted with enough precision, it is possible to predict the dates of occurrence of subsequent sunspot maxima with an error that is not cumulative. In addition, its values have errors that will depend mainly on those in the predicted envelope. This explains our successful prediction of sunspot maximum #24 (the open circle in Figure 1). We conclude that, in principle, it is possible to predict the dates of occurrence and the values of successive sunspot numbers from the sunspot maxima envelope once this last is known from predictions. On that basis, the two main objectives of the present investigation are
In Subsection 1.1 we apply the dates of Figure 1 to define with precision the three kinds of episodes, namely the Grand Minima, the Regular Episodes and the Grand Maxima during which solar activity evolves. Finally, in Subsection 1.3 the updated coordinates of the Transition Point are presented.
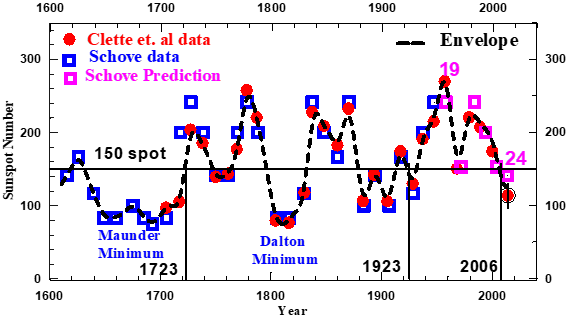
Figure 1 The red dots represent the succession of maximum sunspot numbers obtained from the revised version of the Zürich sunspot number, SNmax (1705 to 2014; Clette et al.1; source: WDCSILSO, Royal Astronomical Observatory of Belgium). The violet squares are the sunspot maxima time series determined by Schove2 from telescopic observations between 1610 and 1947 and the pink squares are his predictions of the following six successive sunspot maxima from his time series that started in 290 (Figure 4). The pink numbers are the Wolf numbers of some of these maxima. The black dashed curve is the ‘Envelope’ (definition is given in Subsection 1.1, Table 1) of the sunspot maxima time series, Rmax (Figure 4), composed by the Sc55 and SNmax data as computed by the wavelet representation introduced by us.4 The black open circle with the vertical bar is the prediction for sunspot maximum #24 by De Jager et al.3,4 The sunspot number 150 is the value of the Transition Rmax level as computed by applying the procedure introduced by Duhau et al.5 to the sunspot maxima time series.
The transition level, the Gleissberg cycle and solar dynamo episodes
By a wavelet-based method we4 found that the sunspot maxima envelope (the red curve in Figure 1) can be represented by the superposition of a constant that is baptized Transition level, and three parts, that we have called Bi-decadal and Semi-secular oscillations and the Gleissberg cycle (Figure 2). Here we demonstrate (cf. Section 4) that the Bi-decadal and the Semi-secular oscillations correspond to well defined modes of solar dynamo oscillations. Hence, from now on, we will call them ‘modes’. On the other hand, in Subsection 4.3 we will find that the Bi-decadal mode is the signature of solar activity variables of the cyclical inversion of the polar component of the solar dynamo magnetic field, a phenomenon that is called `Hale cycle’.7 From now on we will rename the Bi-decadal mode as Hale mode.
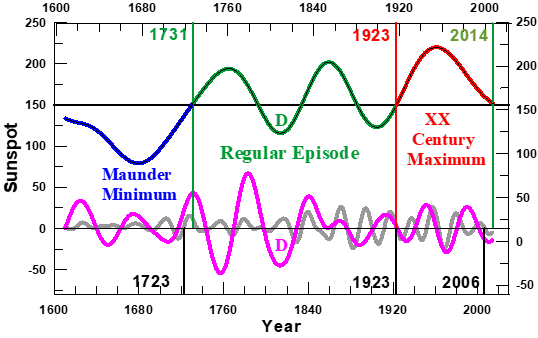
Figure 2 The three parts in which the envelope of the sunspot maxima time series (dashed black curve in Figure 1) has been decomposed.4 These are the Gleissberg cycle (the succession of blue, green and red curve), the Semi-secular (pink curve) and the Bi-decadal (grey curve) oscillations. The black numbers along the vertical lines at the bottom are the dates on which the Envelope passed through the 150 sunspot number Transition level (horizontal line in Figure 1) and after which the Gleissberg cycle appreciably changes in amplitude and duration, either in synchronicity (red numbers) or a few years later (green numbers) so leading to a ‘Phase transition’ from one Solar Dynamo Episode to the next one (the definition is summarized in Sub-section 1.2). The three kinds of Episodes that may be observed in the Figure are the Grand Minima, like the Maunder one, (blue curve), the Grand Maxima, like the XX Century one (red curve) and the Regular Episodes, like the 1723-1923 one (green curve).5 The D letter marks half of the Gleissberg (blue) and Semi-secular (pink) variations and half of the negative oscillations that leaded to the Dalton Minimum (Figure 1). In view of these properties that are found here in the Bi-decadal oscillations (cf. subsection 4.3) we will from here on refer to them as ‘Hale mode’.
In Figure 2 we observe that the two negative Gleissberg oscillations that occurred during the Regular Episode (green curve) have noticeably smaller amplitude than the two positive ones. Here we find (Subsection 4.2.2) that this feature is related to the fact that the solar dynamo system has a persistent asymmetry, such that the solar Dynamo modes are oscillating around a constant value that is 7.2 sunspot numbers above the Transition level. We observe also that the Dalton Minimum is due to the synchronicity of a negative Gleissberg oscillation of the Regular Type with a strong negative half of Semi-secular oscillations (indicated by the blue and pink letters D, respectively, on Figure 2). Note that these two halves of oscillations have both a duration that is less than a half of the single one that leaded to the Maunder Minimum. These explain why there occurred eight sunspot maxima below the Transition level during the Maunder Minimum and only three during the Dalton Minimum (Figure 1). We observe that at the three Transitions dates the Hale mode (grey curve in Figure 2) passes through zero synchronous with the passing by the Transition level of the envelope. In the light of the fact that the Hale mode is the signature of the Hale cycle (cf. Sub-section 4.3) this property is relevant for determining the nature of the Solar Dynamo system.
Summarizing: the toroidal component of the solar dynamo magnetic field occasionally undergoes sudden changes of its strength, as is seen in its proxy, viz. the sunspot number at maximum Schwabe cycle (SNmax; cf. also the successive blue open squares and red dots in Figure 1) . In Figure 2 we have illustrated that these changes are related to the sudden change in the amplitudes of the Gleissberg cycles that occurs after each Transition. As the polar component of the dynamo magnetic field is related to the toroidal one through the dynamo actions, similar changes occurs in that component too, These leads to defining the solar dynamo Transition State as a unique state to which the solar dynamo system persistently returns after which a new Episode starts5 as is summarized in the next Subsection.
The phase diagram and the transition point
A proxy for the strength of polar component is the value of the geomagnetic index aa at solar Schwabe minimum was introduced by Mayaud8 aamin.9-12 We found De Jager et al.4 that a subsequent Episode invariably occurs when the envelopes of the two parameters that characterize the two components of the solar magnetic fields, viz. SNmax (the red curve on Figure 1) and aamin pass simultaneously through the Transition Point. The latter is a fixed point in the phase diagram, in which the maximum sunspot numbers (SNmax) are plotted against the minimum aa values (aamin). Cf. Figure 3A). Regarding the Gleissberg cycle we observe in Figure 3B that only in 1923 this cycle passed through the Transition point but in 2006 only the abscissa of the Transition point was reached and the Transition ordinate is missing. In the first case the dynamo system passed from a Regular to a Grand Episode and in the second one the contrary occurs. In actual fact, from proxy data from Nagovitsyn13,14 we found that a behavior similar to that seen since 1844 in Figure 3B, has recurrently occurred since the year 1050 (Figure 6 in Duhau et al.5 Consistent with this behavior, we predicted that in 2014, that is a few year later than the 2006 Transition, a Gleissberg cycle of the Regular type will start.3,4 This prediction is confirmed from the new data included in the present investigation (cf. Sub-section 5.1).
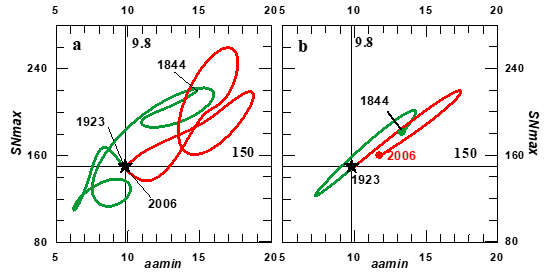
Figure 3 The phase diagram of the envelope (A) and the Gleissberg cycle (B) of the Sunspot numbers at maxima, SNmax (cf. Figure 1 black dashed curve) vs. the geomagnetic index at minima , aamin, the latter from Nevanlinna et al.15 and from Lockwood (priv. com 2009), for the periods (in years) 1844-1867 and 1868 to 2009, respectively. In both panels the numbers along the horizontal and vertical lines are the values of the two transition level components (represented, in the case of SNmax by the black horizontal line in Figure 1). Green and red colors refer to the Regular Episode and the Grand Maximum respectively (green and red lines in the Gleissberg cycle in Figure 2); the latter starting in 1923. Around 2006 a new episode started that has been described De Jager et al.4,16 and predicted by them to be of the Regular type. It is expected that this will last for the remainder of the present millennium, as will be confirmed in this paper.
Only the existence of the 1923 and 2006 Phase Transitions may be precisely determined from the 162 year long interval included in Figure 3. Hence, for determining with precision the date of the transition from the Maunder Minimum to the Regular Episode (The succession of the green and red curves in Figure 2 & 3) we have to take into account that the envelope must add to zero at the dates of the three parts into which we have split it after having subtracted the transition level. While the three parts pass simultaneously through zero during the 1923 transition, that does not happen in 2006, when the Hale mode (#1 in Table 1 passed through zero while at the same time the Semi-secular (·#2 on Table 1) oscillation and the Gleissberg Cycle (definition is given on Table 1) added to zero, Hence, similar to the 2006 case, we have selected 1723 as the year in which the transition from the Maunder Minimum to the Regular episode took place. In previous papers we have based our predictions of forthcoming solar activity on the properties of the three parts (Figure 2) in which we have split the sunspot maximum time series. By now it is clear that sunspot maximum #24 is the lowest of the past century. This was already predicted by Schove2 as early as half a century ago, by us (open circle in Figure 1) and by several other authors.6 Until now we have restricted ourselves to forecasting a sunspot maximum for no more than one Schwabe cycle ahead. To be able to predict sunspot maxima for a longer period we should know how to forecast the character of the Gleissberg cycle because it is the time variation of that cycle that is comparable to that of the sunspot maxima time variation.4 We will show that such a forecast is possible by splitting this cycle in six modes of oscillation and a constant.
|
Primary data sets (time intervals in years) |
Section |
Figure |
|||
|
SNmax, Sunspot maxima time series values as obtained from the revised version of telescopic observations of sunspot number by Clette et al.1 |
1 |
1 |
|||
|
Sc55, Sunspot maxima time series obtained by Schove2 from telescopic observation after 1610 and prior to that by naked eye observation of sunspots and aurorae (290-1948). |
|||||
|
Rmax, found here by extending SNmax from the year 1705 backward till 290 from the Sc55 data (290- 2014) |
2 |
4 |
|||
|
Intcall 98 radiocarbon age calibration17 (–5125-1950) |
2 |
5 |
|||
|
The periods of the components that, upon addition, define the various modes (as found by assuming in Eq. (3.2) (cf. Sub-section 3.1) To=2, no=3 and the value of j in the interval mentioned in the table). |
|||||
|
# |
Name |
J |
Periods |
Section |
Figure |
|
1 |
Hale |
10 to 12 |
16.5 20.8 26.0 |
1 |
2 |
|
2 |
Semi-secular |
13 to 16 |
33.1 41.6 52.5 66.1 |
1 |
2 |
|
3 |
Secular |
17 to 19 |
83.3 105.0 132.2 |
4 |
14 |
|
4 |
Suess |
20 to 22 |
166.6 209.9 264.5 |
4 |
12 |
|
5 |
2-Suess |
23 to 25 |
333.2 419.8 528.9 |
4 |
12 |
|
6 |
Eddy |
26 to 29 |
666 840 1058 1332 |
4 |
12 |
|
7 |
Hallstatt |
30 to 32 |
1679 2116 2666 |
4 |
12 |
|
8 |
2-Hallstatt |
33 to 35 |
3558 4231 5331 |
4 |
12 |
|
Notions introduced for operative purposes |
Section |
Figure |
|||
|
Noise: the addition of wavelet components obtained by introducing J=1 to 9 in Eq. (3.2) |
|
|
|||
|
Envelope: The addition of the linear trend to modes ##1 to 8 |
3 |
8 |
|||
|
Long Trend: the addition of modes ##7 and 8 to the linear trend from which the 150-sunspot Transition level is subtracted. |
4 |
13 |
|||
|
Gleissberg cycle: The addition of modes ##3 to 8 to the linear trend |
1 |
2 |
|||
Table 1 Data sets, periodicities and solar dynamo modes of oscillations as introduced in this investigation
The Table 1 gives the input data sets that are used or introduced in this study and the periods of the Morlet wavelet components that, upon addition, determine the eight modes of oscillation that we identify from these data. In the last column, we give the numbers of the Sections and Figures in which they are mentioned first. Four of the eight modes that appear in Table 1 were already identified by their signature in the Fourier spectra of solar activity related variables, especially cosmogenic isotope data. These are: the Hallstatt, the Eddy18 the De Vries19 or Suess20 cycle and the Hale one.21 Also, the band of periods that we have split in two sets: the Secular and Semi-secular ones, is usually called the Gleissberg band. However, we will find in this paper that the Gleissberg band has periods that correspond to two different modes that we will call the Secular and Semi-secular ones. In Section 2 we specify the data that are used in our study. In Section 3 we summarize the basic aspects of the mathematical method applied by us for analyzing the solar activity variables and we apply the results to the development of a procedure for defining the solar modes of oscillations from solar activity related variables. In Section 4 we show that the sunspot maxima time series may be represented by the addition of eight modes of oscillation (Table 1) and the 157.2 sunspot constant. It is based on the regularities and the mutual relationships that are presented by the eight modes. We conclude that these relationships indicate the existence of a persistent asymmetry in the Solar Dynamo System. Following these results we will predict, in Section 5, the data for the Gleissberg cycle for the next two centuries and the years of sunspot maxima for the next one. These results will be summarized in Section 6.
Telescopic observations of sunspots started in 1610, hence the series exists only for slightly more than only 4 centuries. Therefore, these data allow one only to determine with precision those modes of which the oscillations have a longest average duration that is comparable to the Suess time scale (##1 to 4 in Table 1). That situation forced us in earlier papers to split the sunspot maxima time series in at most three parts, of which two are the Hale and Semi-secular modes, and the third is the Gleissberg cycle (Figure 2). This means that in those cases in which the research is based solely on the modern SNmax data, it would only be possible to forecast a certain sunspot maximum for no more than a few years and at most one Schwabe cycle in advance. This is so because it is impossible to predict the Gleissberg cycle for a longer time interval without knowing the six modes of oscillation of which it is composed. We note, in addition that predicting the Gleissberg cycle is especially difficult in those circumstances in which a Transition has just occurred because in that situation we may meet a strong change of its main parameters, especially its amplitude. If the values of the abscise and ordinate of the Transition level are indeed constant the slope of the linear trend of solar activity variables must go to zero when the time series is long enough. As the linear trend is due to the contribution of wavelet components with periods that are much longer than the duration of the time series itself, we may at this stage wonder if, in the case that the time series is long enough, it will be possible to represent its time evolution by the sum of a constant and a finite number of modes.
Schove’s Sc55 time series of sunspot maxima overlaps well with the revised version of the Zürich sunspot number, SNmax over the more than 300 years for which this last is known with precision, including Schove’s predicted recent half century (open pink squares in Figure 1). This indicates that we may safely extend the SNmax series backward from 1705 till the year 290 with the aid of the Sc55 series. This situation allows us to introduce the time series Rmax (Figure 4), which is the 1725 years long series of sunspot data that results from this procedure. The usual practice22 is to define a Grand Minimum (or Maximum) as an episode during which solar activity stays below (or above) some low (or high) level during a significant duration. Thus the four Grand Minima (from Oort to Maunder) and the Dalton Minimum shown in Figure 4 were identified. Regarding the Grand Maxima, initially only the Medieval and XX century ones were recorded. For identifying the origin of each successive Episode we used the Gleissberg cycle, as is shown in Figure 2. This leads to the detection (Figure 16A) of a new Grand Maximum, the XV Century one; it occurred during the last millennium. We will call it the XV Century Maximum. In Figure 2 we observe that the Dalton Minimum is not seen in the Gleissberg cycle. Instead, it is a consequence of the synchronicity of half a Gleissberg oscillation with a strong semi-secular one, so we classify it as a Short Minimum. It consist of a succession of three sunspot maxima that are all below the transition level and one of them has a value that is smaller than 80 sunspot numbers. Analogously we define a Short Maximum (indicates by the red letter S in Figure 4) as a succession of three sunspot maxima that are all above the transition level while at least one of them is larger than 240. Based on the above we conclude that main changes of the qualitative behavior of the solar dynamo episodes between the year 290 and present are the following:
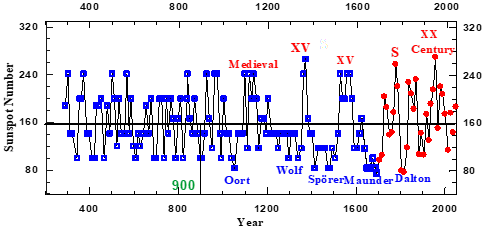
Figure 4 The Rmax time series obtained by backward extension of the revised sunspot number time series of Clette et al.1 (red points). The extension goes back to the year 290 by the addition of the open blue squares, i.e. Schove’s2 series. The black horizontal line is the abscissa of the Transition point (sunspot number 150). The names of the Grand Solar Maxima and Minima that occurred since 290 are given in red and blue characters. The red letter S indicates the occurrence of a short maximum (red colors). The green number is the date on which the ongoing Hallstatt oscillation passed through zero from positive to negative values, as found here (cf. Figure 12D and Figure13B).
In Section 4 we will prove that the above change follows the change of sign from positive to negative of the Hallstatt oscillation that started in 900 (cf. the vertical bar in Figure 4). Evidence that Grand Minima occur only when the Hallstatt oscillation has negative values was found by Steinhilber et al.23,24 from a study of cosmogenic10 Be radionuclide data for the past 9300 years, a period that includes four Hallstatt oscillations. We also refer to Figure 10 in Versteegh25 where that property can be seen too. De Jager et al.4 have found that the last Hallstatt oscillation passed from negative to positive, hence through its zero point, virtually at the time of the recent Transition. They thus concluded that the Episode that started after the present Transition will be of the Regular type and will last for the remainder of the present millennium. The dependence of the nature of solar dynamo episodes on the sign (positive or negative) of the Hallstatt oscillations gives evidence that the shape of the modes of oscillation is related to this sign too. This is confirmed ln Section 4 where the eight modes of Table 1 are presented.
The slope of the linear trend as computed from the SNmax and Rmax time series (in sunspot numbers per century; cf. Figure 1 & 4 respectively) changes from 1.2 to –0.05. This drastic reduction of two order of magnitude of the modulus of the slope of the linear trend, while at the same time the length of the time series increases from three centuries to about two millennia, indicates that the sunspot maxima oscillate around a constant level. In fact, in Section 4 we will show that the amplitude of the oscillation of modes ##6 to 8 are systematically decreasing with increasing periods. The 2-Hallstatt oscillations as obtained from Rmax have amplitudes whose values are barely above the uncertainty of the data (no more than one sunspot number). From this we infer that once the eight modes of oscillations of Table 1 are accurately determined, the slope of the linear trend will becomes negligibly small. Hence, the linear trend will reduce to a constant that we will find (cf. Subsection 4.2.2) to be 157.2 sunspot numbers. This level differs from that of the transition level by only a small constant value, namely 7.2 sunspot numbers. The origin and explanation of this small but significant constant is delayed to a later investigation. There occurred less than one half of a 2-Halsltatt oscillation and less that a full Hallstatt one during the entire Rmax time series of Figure 4. So, for determining the relationship between shorter period modes and the Hallstatt and 2-Hallstatt modes we turn to the cosmogenic isotope data of Figure 5. In the next Section we develop the mathematical technique for determining the solar dynamo modes of oscillation as seen in their proxies; these being Rmax and the Intcal 98 times series presented in Figure 4 & 5, respectively.
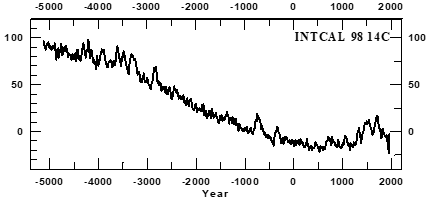
Figure 5 The INTCAL9814 C cosmogenic isotope data.17 Source: University of Oxford, Radiocarbon Web-Info, at: https://c14.arch.ox.ac.uk/intcal98.14c. This calibration series is based on a mix of mid-latitude northern hemisphere records (Germany, Ireland, and those from the states of Washington, Oregon and California in the U.S.A.).
Until now solar physicist have been able to forecast the properties of sunspot cycle #24 within a few years, approximately only one Schwabe cycle, in advance. Many attempts have been made of long-term forecasting of solar activity based on the most conspicuous peaks in the spectra of the related variables, viz. those of about 88, 200 and 2300 years, the Gleissberg, Suess and Hallstatt ‘cycles’, respectively.21 Although they are called ‘cycles’, their physical origin has not yet been determined. Moreover, the Fourier periods in their spectra change with time.21 For example, the so called Gleissberg ‘cycle’ covers a wide band with a well detectable double structure: one of 50 to 80 years and the other of 90 to 140 years. These are called the lower and the upper Gleissberg bands, respectively.26 Of course, it is necessary to examine if these two bands are the signatures of the same physical phenomenon. That may be far from obvious: merely observing the peaks in the spectra does not allow one to determine if two period bands in the spectra with neighboring periods are due to changes in a unique solar dynamo mode of oscillation, or that they are due to two well differentiated physical modes. The only way to explain the physics behind the peaks in the spectra is by advancing a signal processing technique that can describe its signature in the time domain. In our context, such a technique can be described as the process of decomposing a signal into a linear combination of basic functions. The aim of this decomposition is to properly isolate the phenomena that contribute to the behavior of the signal. Several properties of the basic functions are required to be able to handle this decomposition.
For instance, usually one function is used as a generator for obtaining the other basic functions by applying a combination of mathematic operations like translations, modulations, and dilatations. This constitutes a reasonable mathematic framework that efficiently yields the information needed to re-generate or to synthesize the original signal. Furthermore, the generated set of basic functions is usually required to constitute what is called an orthogonal base of a suitable functional space. This, basically, means that the decompositions are stable (meaning that the order of the factors in the decomposition does not affect the results), and that the basic functions in the decomposition do not overlap or interfere with each other. There are many other properties, depending on the technique that is applied. In Fourier analysis, the generating function is just a harmonic function which provides a representation that has very poor localization in time in its decomposition, while the present problem is extremely time-localized. Hence, we would not be able to obtain compact decomposition with the Fourier technique. Also, the underlying - incorrect - assumption is that the original signal is periodic, which makes it impossible to decompose it for obtaining even a small extrapolation of the original data.
Contrary to what happens with harmonic oscillations, which are stationary, the oscillations that compose the sunspot maxima time series undergo strong time-dependent changes in amplitude. This fact is clear from Figure 2, but it is also obvious in Figure 1,3 & 4. On the other hand in wavelet analyses, the generating function is the so-called mother wavelet, whose limited spatial support implies that the behavior of the function at infinity does not play a role.27 The orthogonal basis is generated by translating and scaling the mother wavelet, meaning that the decomposition is well time-localized and that it has different levels of resolution. Thus, it allows one to isolate the underlying physical phenomena in their various levels of resolution. To summarize, a signal processing technique based on wavelets opens the way for representing in the time domain the variables related to nonstationary phenomena, such as those that appear in solar activity.
Summarizing and anticipating: The method for determining the solar modes of oscillation that, after addition to the transition level, allows one to represent solar activity variables, is developed in the next two subsections. In Subsection 3.1 we select the suitable mother function and we derive its essential parameters. Based on that selection we develop in Subsection 3.2 a method for selecting the periods (Table 1) of the wavelet components that, after addition, determine the various solar dynamo modes. And in Subsection 3.3 we demonstrate that the remarkable time-dependent ‘double structure’ in the spectra of the variables related to solar activity are a consequence of the time-dependent evolution of the periods and amplitudes of the oscillations for each of the solar dynamo modes of oscillation. Thereafter, we determine in Subsection 3.4 the dependence of the total number of wavelet components on the duration of time series and we introduce the concept of ‘edge error’.
Selection of the mother function
Any signal processing technique is based on a set of functions, derived from a unique mother function. The selected mother function must be similar to the input fluctuation.28 We describe the essential aspects of this ‘similarity’. The occurrence of several conspicuous peaks in the Fourier spectra of the sunspot number time series indicates the presence of oscillations with well-defined periods. These peaks have values that range from years to thousands of years. The wavelets that we need for this purpose should be suitable for acting as a mother function for which the spectrum.29 consists of one unique symmetrical peak, like the succession of peaks that constitute the spectra of the sunspot time series. The suitable wavelet that we5 selected for this purpose is the Morlet function (ÞÀ)30,31
(1)
where C and D are constants and τ= t/s. Here t is the time variable and s the wavelet scale.
We define T as:
(2)
Hence,
Therefore, relates to T by eq. (2.1), and hence we may write eq. (1) as:
(3)
This leads to the conclusion that (ÞÀ) is a harmonic function of period T that has a Gaussian envelope with a variance The latter is related to T by
(3.1)
Once that the mother function has been chosen it is necessary to determine its basic characteristics by selecting the values of its defining parameters. The value of D is chosen equal to 6 in order to satisfy the admissibility condition.27 For the set of scales, we may use any arbitrary number. It is convenient to write the scales (to which the periods are related by Eq. (2.1)) as fractional powers of 2.28 So, we may write the set of periods as
, with j = 0, 1,…J, (3.2)
where j and J are integers. J is the total number of components. Further
(3.3)
where is the distance between two successive data points; it must be a constant. Once this parameter is determined, the value of is fixed by Eq. (3.3), and hence, only the parameter remain to be fixed for determining the values of the successive periods of the components. We have found that a precise representation of solar activity variables is obtained when no ≥3 and so we have applied the set of components that follows after fixing no=3 for representing those time series.6 This procedure allows one to obtain a precise representation of solar activity related variables that are at the same time the most compact.
Summarizing, when once the values of are known, the parameters that remains to be determined for computing the periods of the basic functions from Eqs. (3.1) and (3.2), are and J. The latter’s value J (see Eq. (3.2)) increases with increasing Hence28 we could, at least in principle, introduce a large value for no to warrant the most complete picture. However, the spectra of the time series related to solar activity contain well defined peaks21 and so we found4 that the low value of no=3 suffices for this purpose. In Subsection 3.2 this issue will be further discussed in the framework of the application of our wavelet-based method to the Rmax time series (Figure 4). The total number of components, J, that is needed for accurately representing a given time series depends on the length of the time series. This issue is discussed in Subsection 3.4. Once the basic functions having been selected by fixing the values of To, J and the signal to be analyzed may be represented by summing up the transforms of these functions. For brevity, we will call them ‘components'. They are defined as the convolution of the signals with each of the basic function.27
Determining solar dynamo modes of oscillations from the selected mother function
In this Subsection, we introduce the methods for determining the components of the basic function (cf. Subsection 3.1) that, after addition, allows one to represent each of the eight solar dynamo modes of oscillations listed in Table 1. We also discuss their general properties that allow one to describe them as a ‘succession of Wave Bursts’. In the previous Subsection, we have selected the Morlet wavelet as a suitable mother function for representing solar activity variables. The next step is to determine the set of components that, when added, lead to a significant signal. With this purpose, we need to define the periods and the total number of components that are needed for this purpose. An essential aspect is that, for computing the various components, the data points must be evenly spaced. As the time series of Figure 4 is irregularly spaced we have added annual data points by linearly interpolating between successive data points. Hence δt =2 yr and so, from Eq. (3.2), To=2 yr. The total number of wavelet components, J depends on the value that we assign to no in Eq. (4.3). For making our representation more compact we have selected a minimum value of this parameter such that it still allows for an accurate representation of the time series. We thus fixed no=3.
Once, having selected δt=2 yr and no=3, the periods of the components are found from Eq. (3.2). In order that these correctly describe the solar dynamo modes of oscillation we must determine first the set of components that, after addition, leads to signals that have a regular and repetitive behavior. We found that this set follows from selecting those components with neighboring periods that are in phase during their strongest oscillations, while they gradually lose phase as the amplitude of the oscillations decreases. As an example of this procedure and of the basic properties of the modes found by applying it, we show in Figure 6 the Semi-secular mode (#2 on Table 1) and its four components as derived from the sunspot number time series of Figure 4 in the interval 1483-2014 (top and bottom panel in Figure 6, respectively). Figure 6A shows that the amplitudes of successive Semi-secular oscillations first increase till they reach a maximum value after which they decrease, and that happens in such a way that periodically an oscillation with a relative minimum amplitude occurs and passes through zero synchronously with the passing through zero of a 2-Suess oscillation. This last one is shifted ahead by 37 years. This allows one to differentiating unambiguously between the three sets of oscillations. In view of its bursting shape we baptize them ‘wave bursts’.
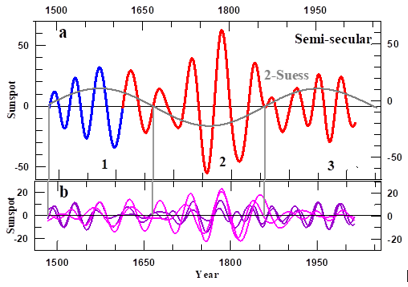
Figure 6 A) The Semi-secular mode of oscillation in the interval 1483-2014 prior to (blue) and after 1705 (red) and the 2-Suess mode shifted forward by 37 years. The black numbers, 1 to 3, identify three successive wave bursts (definition is given below). B) The four wavelet components that conform the Semi-secular mode, where those with the longer periods (52.5 and 66.1 year) are differentiated from those with the shorter periods (41.6 and 33.1 year) by their pink and violet colors, respectively. The three vertical lines in the two panels mark the dates on which a Semi-secular oscillation, that has the smaller relative amplitude as compared with the surrounding ones, changes sign.
These changes of the average periodicity and of the amplitude of the of the oscillation from one wave burst to the next one is seen in the spectra as two different peaks. Many attempts have been made21 of long term forecasting, based on the most conspicuous peaks in the spectra of solar activity variables, viz. those of about 88, 200 and 2400 years, the Gleissberg, Suess and Hallstatt ‘cycles’, respectively. Although they are called ‘cycles’, their physical origin has not yet been determined. In this connection, we refer to Hoyt et al.30 who gave the name ‘cycle mania’ to the practice of labelling ‘cycle’ to any peak that appears in the spectra. Moreover, it is known that the Fourier periods in their spectra change with time.19 For example, the so called Gleissberg ‘cycle’ covers a wide band with a well detectable double structure: one of 50 to 80 years and the other of 90 to 140 years. These are called the lower and the upper Gleissberg bands, respectively.26 Of course, it is necessary to examine if these two bands are the signatures of the same mode of oscillation, as in the Semi-secular case or instead, if they come from two different modes of oscillation. This objective is a topic of the next Sub-section.
The origin of the double structure in the spectra of solar activity variables
Summarizing: in this Subsection, we study the remarkable double structure in the power spectra of the sunspot number time series. This is done by analyzing the evolution of the wavelet spectra of the two successive Semi-secular wave bursts that were lasting from 1483 to 1858 (numbered 1 and 2 in Figure 5). We find that the two Gleissberg bands are the signatures of two different modes. We also find that a substantial change of the period from one wave burst to the subsequent one occurs not only in the semi-secular band of periods but also within the Hale and the secular bands. For computing the wavelet power spectra we use here Eq. 8 by Liu et al.33 instead of Eq. (18) of Torrence et al.28 that is usually applied, because the spectra computed by this last one are distorted or biased in favor of larger periods, a feature that leads to the problem of determining the ‘confidence interval’. In other words, for a time series comprising two sine waves of the same amplitude but of distinct periods, the Torrence and Compo expression yields two spectral peaks of different magnitudes, the one with the larger period being the strongest. This feature hampers a comparison of the peaks over the time range, a problem that is solved by the modified expression developed by Liu et al.33 It follows from Eq. (3.1) that the number of components increases with increasing value of the parameter no. By fixing an extreme value, for which we have chosen no=24, the spectra appear as a continuous curve within the resolution of Figure 7 (the blue, red and grey curves in that diagram). In relation to the above we note that when interpreting the value of the period at the peaks of the time series spectra we must consider that, when that peak is not strong enough as compared with the two surrounding ones, the value of the period at that peak is distorted in the direction of the neighboring peak that has the strongest power of the two surrounding ones.
Figure 7 shows that an appreciable change of the average period, as well as an strong reduction of the maximum amplitude of their oscillations occur between the Semi-secular Wave Bursts #2 to #3 (Figure 6). These changes are seen in their respective spectra (blue and red curves in Figure 7) as a reduction of the values of the power or the year and of the periods at the corresponding peaks (indicated by the blue and red rhombuses in Figure 7). The change in the average period at the Semi-secular peaks is also seen in the Hale one (blue and red stars). The same does not happen in the spectra that include the two successive Semi-Secular wave bursts (grey curve) for which only one of the respective pairs are clearly discernable. This is so because the weaker ones are masked by the stronger ones, and so their signatures appear in the spectrum only as a couple of inflection points. Based on only 200 years of available observations, Gleissberg (1944, 1958)34,35 found a cycle of 88 years in the amplitude variation of sunspot numbers. Later-on, two bands of periods, one extending from 50 to 80 years and the other from 90 to 140 years21 appeared to be part of the Gleissberg cycle. However, in Section 4 we will show that these two bands (indicated by rhombuses and triangles, respectively, in Figure 5) originate from two different modes of oscillation, viz. the Semi-secular and the Secular ones (modes # 2 and #3 in Table 1). Consistently with this finding, we6 have, in previous papers included components with periods in the lower Gleissberg band in the Semi-secular mode while those from the Upper Gleissberg band were included in the Gleissberg cycle. Finally, we emphasize that we have discovered a substantial change of the period of the Hale and the Semi-secular oscillations from their respective shapes as seen in the time domain, which allows one to determine the temporal extension of each of the successive wave bursts and hence to compute the spectra for the appropriate time span, as shown in Figure 6. Summarizing this Sub-section: the substantial changes in maximum amplitude and period of the oscillations from one wave burst to the next one, during the time of a given solar dynamo mode, prohibits us to forecast the period and amplitude of future oscillation just from analyzing them by their spectra. But that happens to be one of the common practices36–40 Instead, we need to clarify the evolution of the periods and amplitudes of all of them in the time domain.
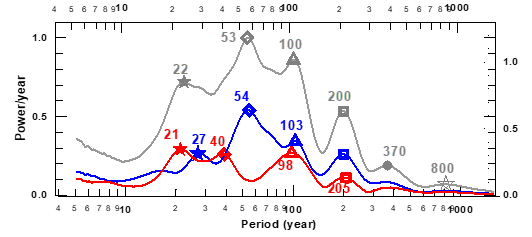
Figure 7 Wavelet spectra for the two successive wave burst numbered 1 and 2 in Figure 6(A) (blue and red curves, respectively), and for the time interval that includes the two wave burst (grey). The stars, rhombuses, triangles and squares are at the Hale, Semi-secular, and secular Suess peaks, where the grey dot and the open star are at the 2-Suess and Eddy peaks, respectively. The spectra have been computed from equation (8) of Liu et al.33 and normalized to unity at the 53 sunspot number peak (grey rhombus).
The dependence of the total number of wavelet components in the time series and the ‘edge error’
In Subsection 2, we have determined the minimum number of wavelet components that, when added, allows one to represent each mode. The next step is to determine the total number of components, J (cf. Eq. (3.2)) that, after addition to the linear trend, lead to a precise representation of the time series that is being analyzed. In the present Subsection we study this issue. We find that there is a distortion of the single oscillation that occurs at each of the two edges of the time series. We baptize this phenomenon ‘edge error’. In order to demonstrate the way by which we determine the number of components that, when added to the linear trend, allows one to represent the envelope, we isolate from the Rmax time series the interval 1664-1863 and compare the shape of the modes that are obtained from this 200-year interval, that we will call from now on R200, with those found from the whole 1725 year interval time series, Rmax. The longest modes that are discernable from these two time series are the Suess and the Hallstatt ones. Hence, in the R200 case, for computing the envelope we must add the linear trend to modes ##1 to 4. But for computing the envelope from Rmax we must add four additional modes, ##5 to 8 (definitions are given in Table 1).
In Figure 8 we compare the four modes that, when added to the linear trend, allow one to determine the envelope as found from R200 with the corresponding signals as computed from Rmax (dashed and full curves, respectively in a to d). We observe that there is a discrepancy between the values of the curves that represent each of the four modes as computed from R200, when compared with the corresponding signal as computed from Rmax (dashed and full curves in Figure 8(A–C). It appears during a single half oscillation at the two edges of the 200 years interval. As a consequence, since the periods of the Suess modes are of the order of 200 years their values, as computed from R200, differ from those computed from Rmax during the whole time interval considered. Moreover, the discrepancy is largest in the linear trend as much as its slope is reduced by two orders of magnitude (compare the full and dashed lines on Figure 8C). On the other hand the values of the four modes shown in Figure 8A to 8c are precisely determined from Rmax, because the 200 year interval considered is far from the two edges of this time series considered in more than half of a Suess oscillation and so the four modes in Figure 8 are precisely determined from Rmax in the 200 year interval. We call the discrepancy of a given mode as computed from R200 as compared with its precise value the ‘edge error’ , and conclude that for each mode this error extends over the two edges of the time series considered during half of their respective oscillations. In the next two subsections we introduce the methodology by with we will amend the edge error in the eight modes of oscillation and predict them by a time interval that depends on the particular characteristic of the given modes.
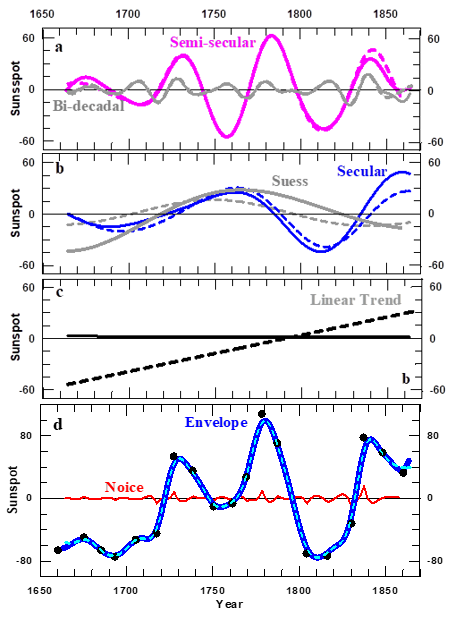
Figure 8 The four modes that may be computed from the 200 year duration R200 time series (A and B), the linear trend (C) and the envelope (D). In D) the red curve is the noise, while the full curve and the dots represent the envelope as computed from the 1725 years lasting Rmax data and from the R200, time series, respectively.
Defining the long trend for amending the edge errors in the Hallstatt and 2-Hallstatt modes
In spite of the strong reduction of the linear trend in Rmax as compared with that in the R200 series (dashed and full lines on Figure 8C), once that the four and the eight modes that constitute each of the two time series are added to their respective linear trends, the envelopes of these two time series that are thus found (full and dashed blue curves on Figure 8D), coincide. This indicates that the linear trend of R200 is the signature of modes #5 to #8. In fact, we find that the addition of the linear trend and modes # 3 and 4 as computed from R200, by one side (dashed curve) and of the linear trend to modes ## 3 to 8 as computed form Rmax by the other side (full curve) differs only in a few spots at the two edges of the 200 year time interval (Figure 9). The result shown on Figure 9 indicates that once the two largest period modes that may be computed from a time series of a given length is added the signal that result after adding to those modes the corresponding linear trend differs from the same signal precisely determined on only a few spots at the borders of the time interval considered, that in the case of Figure 9 is 200 years. Based on this property and taking into account that the two largest period modes that may be computed from the 1725 years long time are the Hallstatt and 2-Hallstatt ones we define, for operative purposes, the Long Trend in the 1725 year long Rmax as the addition of the linear trend, to which the 150 spot transition level has been subtracted, to the Hallstatt and 2-Hallstatt modes. After assuming that the slope of the linear trend become disregardable once the edge error is amended in the Hallstatt and2-Hallstat modes, in subsection 4.2.2 we apply the Long Trend to amending the edge error in those two modes as computed from Rmax.
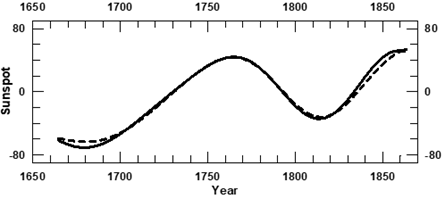
Figure 9 The additions to linear trend to the secular and the Suess modes as computed from R200 and that of the linear trend to the secular, Suess, 2-Suess, Eddy, Hallstatt and 2-Hallstatt modes as computed from Rmax (full curve).
The functions that are applied in correcting the edge errors in order to predict the various modes of oscillation
For predicting Rmax we must be able to take into account the edge errors and to predict each of the eight modes of Table I that, upon addition to the linear trend, allow one to determine its envelope. With this purpose we introduce the function, F(t):
(4)
(4.1)
(4.2)
The suffixes 1 and 2 refer to the values of T, A and TA prior to and after to respectively.
The values of the nine parameters that, once introduced in Eq. 4, allow one to simulate a given wave burst are found as follow:
to is determined from one of the two data sets:
Once to is determined φ is fixed by the shape of the oscillation to which it is included.
The values of the remaining seven parameters that together with to and φ allow one to simulate a given wave burst with the use of Eq. (4). These parameters are determined from the following general properties that are valid for each of the wave bursts:
The procedure by which we apply the above general properties for determining the seven parameters in Eq. (4) that together with to and φ allows one to simulate a given wave burst is explained below by applying that procedure to the Semi-secular wave burst shown in Figure 10 ( the succession of blue and red curves). This case is the only one for which we know virtually a full wave burst during the time interval for which telescopic observations of solar activity are available. Note that the duration of the Semi secular wave burst (Figure 10A) is equal to the duration of a half a Suess oscillation shifted forward by 37 years (Figure 10B). After selecting to=1770, φ=0 from the shape of the given wave burst we introduces a iterative procedure that consists of two steps:
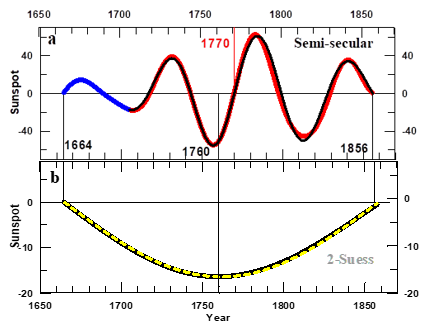
Figure 10 A) A Semi-secular wave burst (#2 In Table 1) (blue and red colored curves prior to and after 1705, respectively, where the red number marks the date on which the strongest oscillation of the whole wave burst passes through zero (to in Eq. 4), and the black curve is its simulation by Eq. 4 with b=0.03 year/century, φ=0, A1,2=54.7, 59.0, T1,2=54, 56 TA1,2=40, 62. B) An isolated half of a 2-Suess oscillation shifted forward by 37 years, where the dashed yellow curve is their simulations by a harmonic function ( cf. Eq. 5) with to =1664, φ=3/2??, T=388 and A=16.4. The black vertical lines in the two panels are at the successive dates on which the 2-Suess oscillation passes through zero, reach their maximum values, to pass thereafter through zero again.
We notice that during these wave burst the dates on which the observed and simulated curves pass through zero differ at most by one year and, after 1705 when the observations became more precise,1 the values of the simulated oscillations differ by at most one sunspot number from the actual ones. We cannot apply Eq. (4) for simulating the ongoing half oscillation of modes #7 and #8 because their respective periods are larger than the duration of Rmax. So we have simulated them by harmonic functions.
(5)
where A and T are the amplitude and period of the harmonic function; to is the date on which the given half of oscillation started and φ depends on the sign of the considered half oscillation. In Figure 10B we exemplify the accuracy by which Eq. (5) allows one to simulate the considered half of the oscillation by applying it to one half of the 2-Suess function. This is the mode with the largest periodicity for which we know half of the oscillation that occurs during the time interval for which telescopic observations of sunspots are available. We find that the simulated curve (yellow dashed curve) differs from the actual one (grey curve) by at most 0.05 sunspot number. This small difference between the two curves is indistinguishable in the Figure. In the next subsection we present the eight modes of oscillation that are derived from Rmax by the methodology introduced in Subsections 3.1 to 3.3. Thereafter, based on their properties and mutual relationships, we select the respective sets of parameters that, once being introduced in Eq.( 4) or Eq. (5), allow one to correct their respective edge errors and to predict them. The results are summarized in Table 2.
|
Mode |
Parameters of Eq. 4 |
Interval |
|||||
|
T |
TA |
A |
φ |
to |
b |
||
|
2-Hallstatt |
4600 |
------ |
2.5 |
3Þ/2 |
410 |
---- |
410-2710 |
|
Hallstatt |
2272 |
------ |
5 |
3Þ/2 |
900 |
---- |
900-2036 |
|
Eddy |
1000 |
600 |
12 |
Þ |
1518 |
3 |
410-2710 |
|
2-Suess |
400 |
460 |
16.3 |
3Þ/2 |
1627 |
3 |
1722-2210 |
|
336 |
------ |
5 |
0 |
2210 |
--- |
2210-2376 |
|
|
Suess |
210 |
330 |
42.1 |
0 |
1512 |
3 |
1930-2036 |
|
210 |
----- |
9 |
---- |
2036 |
---- |
2036-2236 |
|
|
Secular |
114 |
110 |
50 |
Þ |
1857 |
-3 |
1990-2046 |
|
93 |
130 |
30 |
0 |
2240 |
-3 |
2046-2352 |
|
|
47 |
76 |
20 |
0 |
1968 |
3 |
1968-2050 |
|
|
55 |
70 |
40 |
0 |
||||
|
Semi-secular |
2150 |
3 |
2050-2230 |
||||
|
67 |
70 |
37 |
0 |
||||
|
27 |
------ |
7 |
0 |
2006 |
2006-2020 |
||
|
Hale |
22.2 |
40 |
19 |
0 |
|||
|
22.2 |
40 |
19 |
0 |
2070 |
0 |
2020-2130 |
|
Table 2 The values of the parameters that, once introduced in F(t) (cf. Eq. 4), allows one to apply them to correct the edge error and to predict a given mode together with the time interval, in years, during which each of the sets are applied. Ti , TA and to are given in years, Ao in sunspot numbers and b in years /century . In the cases in which only half of an oscillation is predicted the corresponding simulation is made by applying Eq. (5), and then the values of TA and b are not necessary. The results are shown in Figure 13 & 14 in Section 4.2.
The properties of the eight modes of oscillation that constitute solar activity and their prediction
Summarizing: In this Section we apply the methodology introduced in Section 3 for determining the modes of Solar Dynamo oscillations as observed in the data of Section 2. Based on the results described therein we predict them for an appropriately selected time interval. We start in Subsection 4.1 by summarizing the physical nature of the Intcal 98, the SNmax data and Schoves’s data. In subsection 4.2, the relationships between modes ##5 to 8 as observed from the Intcal 98 data are determined. In Subsection 4.3 we correct for the respective edge errors and predict the eight modes of oscillation from their observed shapes. It is also found that once the edge error is determined in the linear trend, it appear to be well represented by a constant, having the value of sunspot number 157.2. Finally, in Subsection 4.3 we predict the Hale mode and the Noise from a relationship that we found between them.
On the physical meaning of the data
Usoskin et al.41 have shown that the cosmogenic isotope 14C data are driven by the solar signal on timescales from about 100 years up to 1000 years and occasionally even on multi-millennial scales. The cosmogenic particle flux is modulated by the solar wind, of which the intensity depends on the dipolar component of the polar magnetic field and so the Intcal 98 data (Figure 5) are a proxy for the strength of this component, as is aamin. On the other hand SNmax (red point on Fig. 4) is a proxy for the strength of the toroidal component, while prior to 1610, Schove’s (1955)2 time series (blue points in Figure 4) is based not only on bare eye observations of sunspots but also on aurorae. The latter are driven by solar storms. A proxy for these is the Sudden Commencement index introduced by Mayaud8 It was found42 that the Gleissberg cycle as determined from aamin and from the Mayaud index time series are qualitatively the same.
In Figure 11 we compare the spectra of the Intcal 98 and the Rmax time series. Five of the six modes that compose the Gleissberg cycle are not only apparent in the Rmax spectrum (red stars) but also in the Intcal 98 one (black points). Moreover, the Suess, 2-Suess and Eddy peaks have the same periods in the two spectra. The origin of the difference between the periods of the 2-Hallstatt and Hallstatt peaks is basically due to the different time span covered by each of the involved time series, as will be demonstrated in Section 4. So the Intcal98 time series allows one to determine with precision the evolution of the periodicity of the five modes with the largest periodicity that compose the solar activity related time series. We note that the power of the spectrum of the Rmax time series decreases fast for periods above the Suess one. The same does not happen with the Intcal 98 time series, because the relative strength of the modes as computed from Rmax on one side and Intcal 98 on the other are not the same. They are strongly amplified in Intcal 98, contrary to Rmax. Based on the above results we use in the next subsection the Intcal 98 data for a qualitative study of the mutual relationship between modes ##5 to 8, while for modes ## 1to 4 these relationships are found from the Rmax data.
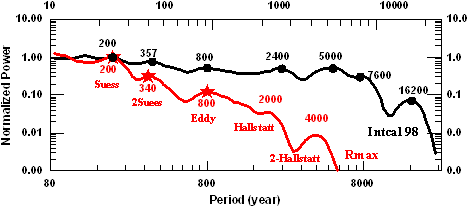
Figure 11 The spectra of the Intcal 98 (black) and the Rmax (red) time series normalized to unity at the Suess peak, where the black points and red stars mark the years of their respective peaks and the numbers of the same colors near these peaks are the values of the corresponding periods.
Prediction of the eight modes of oscillation that constitute solar activity
Summarizing: In Subsection 4.2.1 we will use the Intcal 98 time series for determining the relationship between the 2-Hallstatt, Hallstatt, Eddy, 2-Suess and Sues modes. Based on these results we determine in Subsection 4.2.2 the edge errors in the 2-Hallstatt and Hallstatt oscillations and in the linear trend as found from Rmax. In Subsection 4.2.3 the Eddy, the 2-Suess, the Suess the Secular, the Semi-secular and the Hale modes are determined from the Rmax time series. Data on their shapes and mutual relationships allow one to predict each of them. As may be expected, in view of the physical origin of the applied data, we find that the irregularity in the shapes of the modes prior to 1610 increases with decreasing periods of the relevant modes. Fortunately, the Eddy and the 2-Suess and Suess modes have a regular behavior during the whole 1725 year interval covered by the Rmax time series; and the time elapsed since telescopic observation of sunspots started, appears to be sufficient for determining the shapes of the Suess, Secular, Semi secular and Hale modes. Finally from a relationship that we find to exist between the Hale mode and the Noise, this last is predicted all this assures an accurate prediction of the eight modes of oscillation and the Noise to which the earlier defined constant value of 157.2 should be added, for a safe prediction of the sunspot maxima envelope.
The relationship between the 2-Halsltatt, Hallstatt, Eddy, 2-Suess and Suess modes
In Figure 12 we present modes ## 4 to 8 as determined from the Intcal 98 time series. Next to the open magnetic flux of the Sun, cosmogenic isotope rays are also shielded by the geomagnetic field41 so, in order to determine to what extend this field has impacted on the Intcal 98 time series we have to resort to the observations of the virtual axial dipole moment (VADM) of the geomagnetic field (the violet curve in Figure 12A) We note that at the starting and ending dates of the Intcal 98 time series VADM has the same value which proves that the increases of the amplitude of the 2-Hallstatt and Hallstatt oscillations (cf. green and brown curves in Figure 12) is a real fact during the last seven millennia. We observe that the duration of the two full Hallstatt oscillations, of which the starting and ending dates are indicated by the vertical green bars in Figure 12B, has decreased with time in 240 years. Hence, if this behavior would continue till ~2220 during the duration of the Hallstatt oscillation that started in 900, we may predict that the duration of the half Hallstatt oscillation that started in 900 will be ~1110 years. On the other hand, each of half of the 2-Hallstatt oscillations is successively passing through zero and reaches its maximum synchronously with each successive half of a Hallstatt oscillation, and so the period of the 2-Hallstatt oscillation is equal to twice the Hallstatt period. From the above we conclude that the 2-Halsstatt mode is the first subharmonic of the Hallstatt one, of which the respective oscillations have periods that decrease with increasing amplitude. And so, as the amplitude of both modes has steadily increased during the last seven millennia, the periods have been steadily decreasing synchronously.
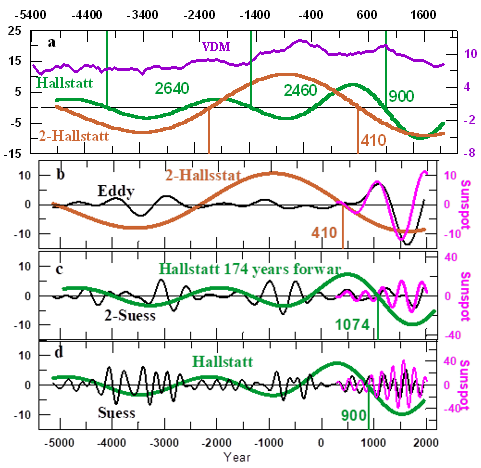
Figure 12 The VADM (violet curve) (from Table 1 in Genevey et al43 and the 2-Hallstatt and Hallstatt oscillation (A). The other panels show the relationship between the Eddy Wave-burst with each half of 2-Hallstatt oscillations (B) and of the 2-Suess (C) and Suess (D) wave-bursts with each half of successive Hallstatt oscillations. The numbers along the vertical bars are the starting dates of the corresponding 2-Halsltatt oscillations (brown numbers in a and b) and of the Hallstatt oscillations (green numbers in a and D). This last one has been shifted forward by 174 years (green numbers in C).
Consequently the amplitudes of the ongoing 2-Halsltatt and Hallstatt oscillations are the strongest of the last seven millennia. The fact that that the amplitudes of the successive half Hallstatt oscillations as well as of the 2-Hallstatt modes have increased during the last 7 millennia indicates that, as it happen with the Semi-secular mode (cf. upper panel on Figure 6), these two modes have also a wave-bursting nature. The duration of each Eddy wave-burst (black curve in b) is related to that of each half of the corresponding 2-Hallstatt oscillation (brown curve in b), while the maximum amplitude of each of its successive wave-bursts is noticeably stronger when the sign of the 2-Hallstatt oscillation is negative than when it is positive. A similar relationship is found between the shapes of each Suess Wave-burst and each half of the Hallstatt oscillation (d), and also between this last one, shifted forward by 174 years, and each 2-Suess wave-burst (c). We also see that the starting dates, viz. 410 and 900 of the ongoing 2-Hallstatt and Hallstatt oscillations as determined by the Intcal 98 data (green and brown b and d), coincide with a high level of precision with the starting dates of the ongoing Eddy and Suess wave-packets as seen in Rmax (in panels b and d) . This allows one to predict with some precision the 2-Halsltatt and Hallstatt ongoing oscillation on one side and the Eddy, 2-Suess and Suess modes on the other. These matters will be discussed in Subsections 4.2.2 and 4.2.3, respectively.
The Long trend and the prediction of the ongoing 2-Hallstatt and Hallstatt oscillations
The ongoing 2-Hallstatt and Hallstatt oscillations, as computed from the 1725 years long Rmax time series, may be severely distorted by the edge error because their periods are longer than the duration of the time series itself. To solve that problem we compute the Long trend defined as the addition of the 2-Hallstatt and Hallstatt oscillations to the linear trend (Table 1). The method by which we simulate the Long Trend and predict it is presented below. The results are shown in Figure 13. The starting assumption is that once the edge errors on the Long Trend are determined, the slope of the linear trend reduces to zero. In addition, each single half of the oscillation of a given mode is known to be well represented by a harmonic function (Figure 10B). As a consequence we may simulate the Long Trend by the addition of a constant, C to two harmonic functions. With this purpose we need (cf. Eq. 5) to know the values of the parameters φ, to, T and, A (Table 2) that are essential for the respective ongoing half oscillations. The values of φ and to are known from the results shown in Figure12A; the respective periods are equal to twice the duration of the Eddy and Suess ongoing wave bursts (Figure 14A &14C in subsection 4.2.3) and, finally, the amplitudes of the two harmonic function and the constant C are found by selecting those that leads to the best fitting of the simulated curve to the one obtained from the Rmax time series (full and dashed curves in Figure 13, respectively).
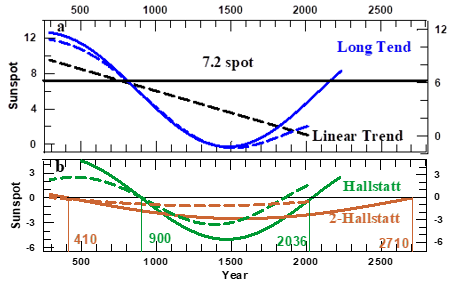
Figure 13 A) The Long and the linear trends and (B) the Hallstatt and 2-Hallstatt oscillations as computed from Rmax, prior to and after having corrected them for their respective edge errors (dashed and solid curves, respectively). The latter have been predicted by the procedure outlined above. In (B) the numbers at the vertical bars are the dates on which the 2-Hallstatt (brown) and Hallstatt (green) oscillations passed through zero and were predicted to be passing through zero again, respectively.
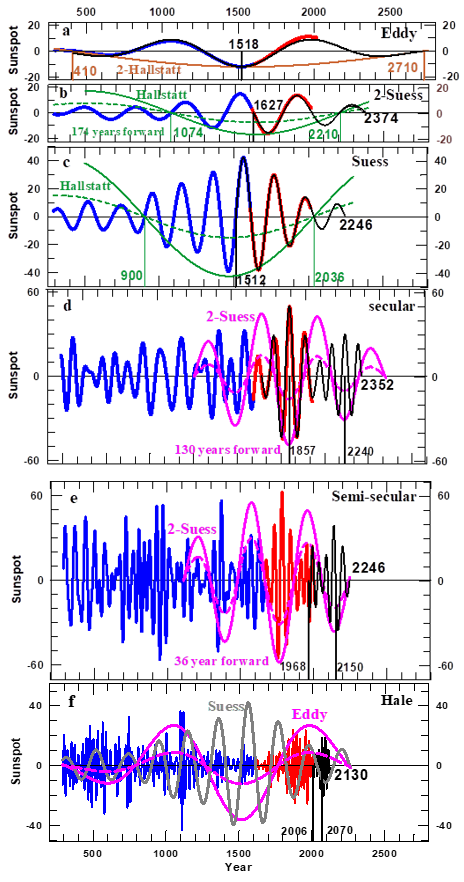
Figure 14 The Eddy, the 2-Suess, the Suess, the Secular, the Semi-secular and the Hale modes as determined from Rmax, where the blue, red and black colors differentiate between the values of the respective modes of Rmax (Figure 4) before and after 1610, and between those computed either by Eqs. (4) or (5) with the parameters of Table 2. The numbers attached to the vertical bars in (A), (C) and (B) are the years in which the half of the ongoing 2-Hallstattt and Hallstatt oscillations (the last one shifted forward by 174 years) respectively passed through zero or are predicted to pass through zero again. In panels (D) and (E) the 2-Suess Wave-bursts are shifted forward by 130 and 37 years, respectively. In panels (D) to (F) the numbers at the right indicate the ending dates of the respective predictions. In panels (B) to (F) the dashed and solid curves of the same colors and these curves from there onward are the corresponding signals multiplied by the amplification factor (Table 3). This is done differently, depending on the sign of the succeeding half of the oscillation.
Note that the edge errors of the Long Trend (blue curve in Figure 13A) and in half of the ongoing 2-Hallstatt and Hallstatt oscillations (brown and green curves in Figure 13B) occur at the two edges of the respective signals, covering a time interval of the order of half an Eddy oscillation, as it must be according to our analyzes of the edge errors presented in Subsection 4.3. As estimated from the Intcal98 time series the Hallstatt oscillation that started in the year 900 will have a duration of 1100 years, a value that differs by only 0.2%. From the predicted 1136 year duration as found from the Rmax data. As regards the predicted duration of half of the 2-Hallstatt oscillation, this being 2300 year, this value allows one to estimate its period to be ~4600 years. This value is very near to twice that of the Hallstatt oscillation, as it must be because we know from the Intcal98 time series that the 2-Hallstatt oscillation is the first sub-harmonic of the Hallstatt one. All this give support to the methodology that is applied on Subsection 4.2.3 Figure 14 (A,B) for predicting the durations of the Suess and Eddy wave bursts that are synchronic with half of the ongoing 2-Hallstatt and Hallstatt oscillations.
A prediction of the Eddy, 2-suess, suess, secular, semi-secular and hale modes
In Figure 14 we present the six modes that, when added to the 2-Hallstat and Hallstatt ones (Figure 13B) together with the 157 sunspot number constant allows for a determination of the sunspot maxima envelope. We observe that, with the exception of the Hale mode, the duration and maximum amplitude reached by the oscillations during each of the successive wave bursts Figure 14(A–D) is related to each half of an oscillation with a longer period. With regard to the Hale mode (Figure 13C) the duration of each successive wave burst is related to the duration of each successive half of a Suess oscillation, but the maximum amplitude reached for each of them is instead related to the amplitude and sign of the Eddy oscillations, respectively. Hence, in the above relationships that exist between the eight modes there is sufficient information to straightforwardly determine the parameters of Eq. (4) (Table 2). This enables one to simulate the durations of the Eddy (a), the 2-Suess (b), Suess (c), the Secular, (d) and Semi-secular (e) wave bursts. The ongoing Suess and 2-Suess wave bursts are expected to end in 2036 and 2210, respectively. Hence, to obtain values for these predictions for a longer time span we add one and a half oscillation to it. These are represented by two harmonic functions with periods and amplitudes that are equal to the respective averages as seen in the oscillations that were going on during the previous positive phase of the 2-Hallstatt and Hallstatt oscillations, respectively. The results are summarized in Table 3.
The six modes listed in Table 3, are those for which we have enough information to enable their determination from the number of oscillations during each wave burst as a function of the sign of half the oscillation. We found that this number is larger when the sign is positive than when it is negative. Hence, the average period of the successive oscillations during a given wave burst changes from one wave burst to the next, being smaller when this sign is positive that when it is negative, as is exemplified in Figure 6 & 7.
|
Wave burst |
Half of oscillation |
Number of oscillations |
Amplification |
||
|
Negative |
Positive |
Negative |
Positive |
||
|
Eddy |
2-Hallstatt |
2.5 |
3 |
3 |
---- |
|
2-Suess |
Hallstatt |
3 |
3.5 |
3.4 |
1.5 |
|
Suess |
Hallstatt |
5.5 |
6.5 |
8.5 |
3 |
|
Secular |
2-Suess |
1.75 |
1.75 |
3 |
1 |
|
Semi secular |
2-Suess |
3 |
4 |
3.7 |
2 |
|
Hale |
Suess |
4.5 |
5 |
1.0 (Eddy) |
3.0 ( Eddy) |
Table 3 The properties on which the predictions of the Eddy, 2-Suess, Suess, Secular and Semi secular wave- bursts are based. Here, the Amplification factor is defined as the quotient between the maximum amplitude reached during each wave burst and the amplitude of half the oscillation that determines the number of oscillations in each of them. In the Hale case the maximum amplitude reached by the oscillations is not determined by half of the Suess oscillation that determines its duration, but by the Eddy oscillation, as indicated to the right side of the respective amplification factors.
The properties of the Hale mode
As summarized by Mursula et al44 an empirical Gnevyshev-Oh1 (G-O) rule45 demands that sunspot cycles occur in odd-even pairs so that the intensity of the odd cycle of a pair exceeds that of the preceding even cycle. However, the G-O rule in the Wolf sunspot series is only valid since solar cycle #10 and fails for cycle pairs ##4-5 and ##8-9.45–47 In Figure 15 we have plotted the SNmax Hale mode and the addition to it of the Noise full and dashed curves). For predicting the Noise (black dashed curve) we have taken into account that its value at the date of occurrence of each Sunspot Maximum is at most equal to 50% of the value of the Hale oscillations at their successive relative maxima and minima. Notoriously, since sunspot maximum #10 the dates on which successive Sunspot Maxima occur (points on Figure 1) coincide with those (points on Figure 15) on which each half of a successive Hale oscillation reaches its maximum amplitude , apart from the case of sunspot maximum #9 which is at an inflection point. As a result the G-O rule leads to pairs of relative maxima and minima of the Hale oscillations occurring in synchronicity of each sunspot maximum odd- even pair ; this being a rule that is violated by the pairs ##4-5 and ##8-9. This proves that the odd-even rule is determined by the shape of the Hale mode, and so this mode is the signature of the sunspot maxima time series of the Hale cycle.
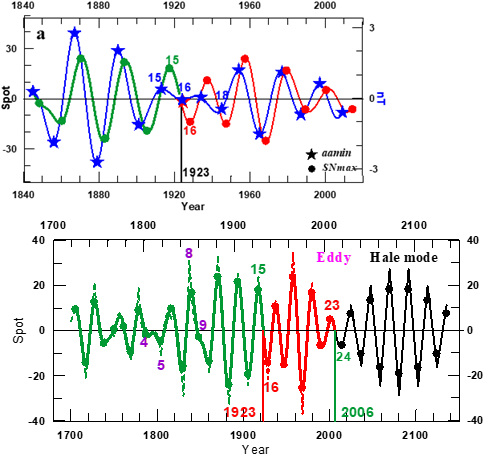
Figure 15 The Hale mode in the interval 1705 to 2014 (the succession of green and red curves as in Figure 2) and its prediction till 2130 (black curve). The dashed curves result from the addition of the Noise to the Hale mode. The succession of green, red and black points are at the dates on which each successive sunspot maximum occurs. The red and the green numbers at the vertical bars indicate the dates of occurrence of the last two transitions (Figure 2). The violet numbers are at the dates on which some of the odd-even sunspot maxima pairs violated the G-O rule prior to sunspot maximum #10 and the green -red and red-green pairs indicates those that occurred around the 1923 and 2006 transitions (Figure 2).
As stated by Nagovitsyn et al.48 the G-O rule has been found to hold not only for statistical indices of solar activity but also in the context of the physical parameters of the solar magnetic field: the sunspot magnetic flux and the open magnetic flux. We have established that the hypothesis of Usoskin et al.49 about the ‘loss’ of one cycle at the end of the 18th century allows the Gnevyshev-Ohl rule, which regulates the behavior of physical parameters of the solar magnetic field, to have a broader context, being valid without any exception during the last 400 years. Thus, in actual fact, we can talk about the Gnevyshev-Ohl law of the long-term dynamics of the solar magnetic field, this being a law that holds for both normal and extreme levels of solar activity. Indeed, the last 400 years interval contains the earlier described three kind of possible Episodes that may be due to the solar dynamo in the course of time. Hence we conclude that the G-O rule is due to some intrinsic feature on the solar dynamo system.
To continue the understanding the evolution of the Hale mode in Figure 16 we show this mode in aamin and in SNmax as functions of time during the interval when aamin is known, (Figure 16A), its phase diagram (Figure 16B), and together with it the sunspot maxima in the neighborhood of the 1923 Transition (Figure 16C). Similarly to what happens with the SNmax mode for which, after sunspot maximum #10, each half of Hale oscillation reaches its maximum value in synchronicity with each sunspot maximum (the succession of green and red points in Figure 15 & 16A) and a similar behavior is followed by the Hale mode on aamin. We observe that, when approaching the 1923 Transition date, the path in the Phase diagram of the Hale mode (Figure 17B) changed suddenly its direction, to become nearly vertical around this date, This indicates that the appreciable change that is seen in the path of the Grand XX century Maximum (red curve) as compared with that during the previous Regular Episode (green curve) is due to some particular phenomena that is occurring during the Hale cycle that separates these two Episodes. It is highly relevant that the odd-even rule is fulfilled at the pair #15-16 by SNmax , but violated by the aamin one (Figure 16C). This is due to the fact that the amplitude of the Hale full oscillation of aamin that was relevant around 1923 appears to have no relation to that of SNmax, which has a substantial amplitude. From this we infer that there is some component of the polar field that is not detected by the Earth’s magnetosphere but is strong enough around the 1923 Transition to lead by itself to the G-O rule to be fulfilled in the toroidal one. From all the above we speculate that the Earth’s magnetosphere is sufficiently far from the Sun to ensure that only the dipolar component of the polar field is leading to geomagnetic activity. At the same time there must be other components of the solar dynamo polar field that are contributing to the polar component, such that they are quite relevant for the fulfillment of the G-O rule in the polar field.
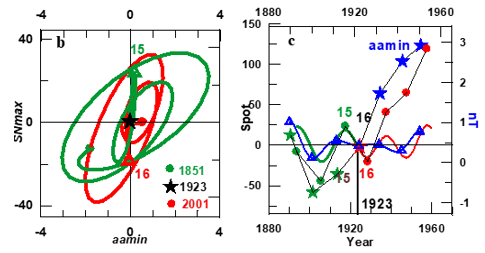
Figure 16 A) The SNmax and aamin Hale modes (the succession of green and red curves, and the blue curve, respectively); B) their phase diagram and C) SNmax and aamin after having subtracted their respective 9.8 nT and 1500 sunspot numbers. Transition level values (circles and stars, respectively) apply to the interval 1890-1958, together with the Hale mode of these two variables. In A) the points and stars mark the values of the two signals at the dates of occurrence of the successive maximum amplitudes. In the three panels the numbers refer to the odd-even pairs that occurred round the 1923 Transition.
The above assumption finds support in the observations of heliospheric observations at 2.5 solar radii, where spacecraft observations during the sunspot minimum #20 (1965-1966) indicate that there is a north south asymmetric in the heliospheric magnetic field and that the heliosphere current sheet (HCS) is inclined with respect to the solar equator. This suggests the existence of a quadrupole component on the solar magnetic field.50 Moreover according to Mursula et al.44 a multipole expansion of the HCS reveals a strong quadrupole term which is oppositely directed to the dipole term, which implies that the Sun has a symmetric quadrupole dynamo mode that oscillates in phase with the dominant dipole mode. Based on all the above we conclude that the evolution of solar activity is affected by the development of the relative phase between the dipolar component of the polar field with respect to the remaining components of the polar field , and also by its relative strength. Heliospheric observations of the solar magnetic flux are very relevant for disentangling this possible relationship.
The long term prediction of Solar Activity
Summarizing: In subsection 5.1 we will study the origin of the relationship that exists between the signs of each half of the Hallstatt oscillations and the nature of the corresponding solar dynamo episodes as well the origin of Short Minima and Maxima. From the results thus found we will make a qualitative prediction of solar activity till ~2200, which is the year in which the Hallstatt cycle is predicted to pass from negative to positive values. In subsection 5.2 we predict the date of occurrence and the values of sunspot maxima ##25 to 35. Finally, in subsection 5.3 we discuss how the Hallstatt oscillation, to which all the other modes are directly or indirectly related, may be excited by planetary motions, as was suggested first by Charvátova51 (for a review and more recent advances of the subject see Scafetta, 2016).52
A prediction of the nature of solar dynamo Episodes till the end of the third Millennium
Long term prediction of solar activity is only possible if the properties of solar modes of oscillation continue in the course of time and when their behavior during each of their respective Wave-Burst is regular. The results of Sections 4.1 and 4.2 (Figure 12 & 14) show that such is the case for modes whose periods are at and above the Suess one. The same happens with the Secular mode (Figure 14D) for data since 1610, this being the date after which Rmax is based solely on telescopic observation of sunspots. As Rmax data prior to 1610 are mainly based on auroral frequencies and visual observations of large sunspots the apparent irregular behavior of the Secular mode is due to the discrepancy of the same mode as seen in each of the two variables from which Rmax is built up. 0n basis of the above, a long term prediction of the Gleissberg mode is, at least in principle, possible. However, from the two time series on which our study is based (Figure 4 & 5), we don’t have enough information on the amplitude of half the Hallstatt oscillation that is expected to start in 2036 (cf. full green cure on Figure 13B). Consequently, as the behavior of all the modes ultimately depends on that of the Hallstatt mode, our prediction of the Gleissberg cycle can only be precise till 2036. After that it is only qualitative.
As summarized by Usoskin22 Grand minima tend to appear in clusters with roughly 2400 years separation (the Hallstatt cycle, see e.g., Damon et al.53 Within the clusters, the Grand minima appear with roughly a 210-year quasi-periodicity.19,20 We know (Figure 2) that Grand Maxima (or Minima) appear in the Gleissberg cycle as a strong and negative (or positive) oscillation with a duration that is nearly twice the one that corresponds to that of the Regular Episodes ( the sequence of blue, green and red curves in Figure 1). The origin of this behavior, illustrated in Figure 17, is explained below. From the six modes that constitute the Gleissberg cycle, the Suess one (red curve in Figure 17B) is the one of which its period, this being about two centuries, has a value that is in the range of the duration of Grand Minima and Grand Maxima. This indicates that a necessary condition for these Episodes to occur is that the Suess oscillation is strong enough. We know (Table 3) that the maximum amplitude that is reached by the Suess oscillation during each wave burst depends on the sign of the Hallstatt oscillation, this being nearly 3 times larger when this last one is negative instead of positive. This property is in accordance with the fact that Grand Maxima and Grand Minima occur only when the sign of the Hallstatt oscillation is negative.
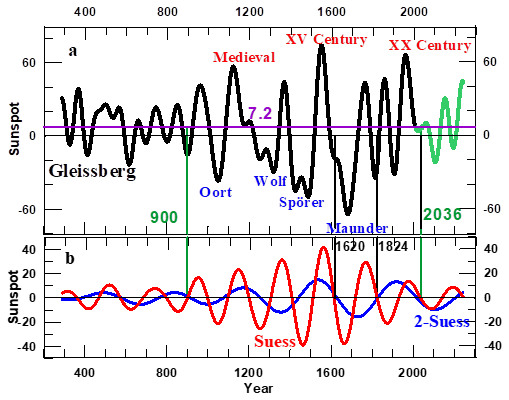
Figure 17 A) The Gleissberg cycle, where the black and green curves differentiate between the periods prior to and after 2006, respectively. B) The 2-Suess and Suess modes (blue and red curves, respectively). In the two panels the green bars are on the dates on which the Hallstatt oscillation successively changed from positive to negative values and back again to positive values. The black bars indicate the dates on which two successive strong Suess oscillations pass through zero, which happens synchronously with two of the strongest 2-Suess oscillations of the whole period.
However, not only the Suess but also the 2-Suess oscillation (blue curve in Figure 17B) plays a central role in determining the nature of the successive episodes. For instance, in 1620 a Suess and a 2-Suess oscillation were passing synchronously from positive to negative values, thus leading to the strongest Maxima and Minima of the last 1725 years. This is contrary to what happened around the year 1842 (green line) when a Suess oscillation was passing from negative to positive values while at the same time a Regular Episode occurred. On the other hand the ripples that may be seen in some of the Grand Episodes are due to the contribution of the secular modes. From the shape of the Gleissberg cycle, as predicted till 2238, we confirm (for a review see De Jager and Duhau, 2016) that the Solar Dynamo Episode that started after the 2006 Transition will be of the Regular type (green curve in Figure 17A). In 2036 the Hallstatt oscillation will change sign from negative to positive and so the amplitude of the Suess oscillation will be strongly reduced as compared with those prevailing prior to that date. As a consequence the Regular Episode that has just started will last for the rest of the present millennium. It is noticeable that in 2036, the year in which the Hallstatt oscillation is predicted to pass through zero, the Gleissberg cycle is expected to be passing over the 7.2 sunspot level while undergoing at the same time a short full oscillation with amplitude that is of the order of the data error. As a next step we determine the origin of Short Minima, like the Dalton one, and also of the Short Maxima (indicated by the blue and red S respectively in Figure 4 & 18). We find that the necessary conditions for the occurrence of these Episodes is the synchronicity of a semi- secular oscillation that is strong ‘enough’, with half an oscillation of the Gleissberg cycle of the Regular type (green curve) while both are negative (or positive) in the case of Short Minima (or Maxima).
Prediction of sunspot maxima ##25 to 35
The addition of the envelope and the Noise as found from SNmax (black curve in Figure 18) at each of its peaks , valley or inflection points appears to yield a difference from the observed values (the sequence of blue, green and red points in Figure 19) by less than 0.5 sunspot numbers. This is so in all cases; hence these small differences are not observable in the Figure. This property allows for a straightforward prediction of the dates of occurrence and the values of the forthcoming 11 sunspot (Schwabe) maxima. As the predicted values of the Gleissberg cycle are quantitatively precise only till 2036 while the behaviors of the Semi-secular and the Hale modes (Figure 3) are somehow irregular even after 1705, the year in which SN max started , we have fairly accurate estimates of the errors of our predictions only for sunspot maxima ##25-26. Based on this consideration we summarize our prediction as follows: the pair of sunspot maxima ##25-26 will occur in 2025±1 and 2036±1 and it will have values of 160±8 and 150±8 sunspot numbers, respectively. After that, sunspot maxima #27 to #31 will be oscillating around the 157.2 sunspot level, thus fulfilling the odd-even rule with a variable amplitude that will be at most 40 sunspot numbers. Finally, at sunspot maximum #31 occurring in 2081±2 a Short Minimum, similar to the Dalton one will start , during which the odd-even rule may be violated by the ##33-34 Schwabe pair. Also, solar activity will emerge from this Short Minimum at sunspot maximum #35 which will occur in 2130±2.
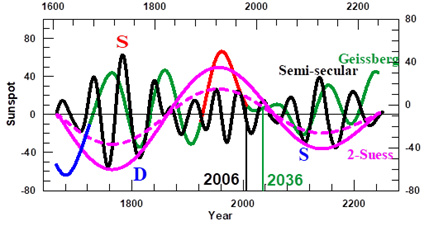
Figure 18 The Semi-secular mode (black curve), the Gleissberg cycle (the succession of blue green, red, and green again that indicates the kinds of Episodes as in Figure 2); and the 2-Suess oscillation shifted forward and multiplied by 3.4 and 1.5 (full and dashed pink curves as in Figure 14E). The letter D indicates the Dalton Minimum and the red and blue letters S the Short Maximum that preceded to the Dalton Minimum and the Short Minimum that is predicted to occur around 2130 (cf. Figure 19 in Subsection 5.2) . The black and green vertical bars are at the date of the last transition and the date on which the Hallstatt oscillation is foreseen to be passing from negative to positive.
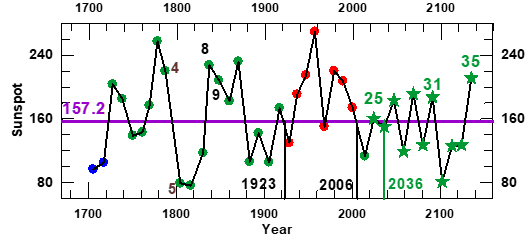
Figure 19 Sunspot maxima as fond by adding the 157.2 spot constant to modes ##1 to 8 and the Noise (definitions are given in Table I; black curve) and the values of the successive observed (points) and predicted (stars) sunspot maxima. The colors in the interval 1705-2014 are as in Figure 1 and the black numbers at the green points indicate the two pairs of sunspot maxima that violate the O-D rule. The black numbers at the vertical bars mark the date of occurrence of the last two transitions (Figure 2) and the green one marks the date on which the Hallstatt oscillation is predicted to be passing through zero form negative to positive (as in Figure13B and Figure 17A).
A preliminary discussion of the origin of the behavior of solar dynamo modes of oscillation
In Section 4 we found that, the solar dynamo system contains eight modes of oscillation that exhibit well defined and persistent mutual relationships. These are on one side the Eddy mode, and the 2-Suess and Sues modes on the other. They are related to the Hallstatt modes. In turn the Secular and Semi secular modes are related to the 2-Suess one and the Hale mode to the Suess and Eddy modes. Finally the 2-Hallstatt mode is related to the Hallstatt one with a time delay that has a value equal to a fourth part of the previous Hallstatt oscillation. From all of this we conclude that all the modes of oscillations are ultimately related to the Hallstatt one. Charvátova54 found that he Jupiter/heliocenter/ barycenter alignment has a periodicity of 2402.2 which made her advancing the hypothesis that the Hallstatt ‘cycle’ is excited in the solar dynamo by inertial solar motions. More precise computations were performed by Scafetta et al.52 They included in their computations the four Jovian planets: Jupiter, Saturn. Uranus and Neptune, and they found that the orbit of the planetary mass center (PMC) relative to the Sun is varying. Thus they arrived at virtually the same value: a 2318 years periodicity.
On the other hand the time that is estimated for the four Jovian planets to come back to the same position, except for a rotation of 30° is 179.8 years,55 (Figure 4) which leads to the conclusion that the four satellites return to the same position with a period of 12 x179.8=2146 years, which is also in the range of the Hallstatt periodicity. Notoriously there are 12 Suess oscillations during each Hallstatt one (Table 2). So it appear that the each Suess oscillation is related to the 179. 8 periodicity of the planetary motions. In turn, as summarized by Fairbridge et al.55 the progression of the inertial orientation parameter is controlled by the Jupiter Saturn 900 year ‘Great Inequality’ while the processional rotation parameter is linked with the 179 year cycle of the solar inertial motion identified by Jose56 On the other hand, Somerville57 found that the Jupiter- Saturn inequality reached its maximum value in the year 1560 and the mean motion of the two planets approached their true motions, and became equal to them in 1790. In that context it is highly noticeable that the Eddy mode reached it maximum negative value in 1518 and passed through zero in 1748, dates that have both the same time delay of 42 years, with respect to the progression of the Great Inequality of Jupiter and Saturn. These observation do strongly support the hypothesis that the Eddy mode is the signature on solar dynamo motions by the Jupiter Saturn Great inequality.
Some other periodicities has been found in planetary motions and the solar orbital motion52 When comparing these periodicities with those in solar dynamo modes of oscillations we must take into account that when computing the functions associated to solar-planetary motions , the Sun and planets are assumed to be rigid spheres. However, as stated by Fairbridge et al.55 to fully understand the interaction between the solar dynamo and planetary forces the physical interaction inside the solar body must also be considered. This may explain why, as has been stated by Charvoneau58 Given the amount of effort having gone into building detailed dynamo models of the solar cycle, it is quite sobering to reflect upon the fact that the physical mechanism responsible for the regeneration of the poloidal component of the solar magnetic field has not yet been identified with confidence.
In previous research we have represented solar activity related variables as the addition of two signals that we named bi-decadal and semi-secular oscillations modes. To these we added the Gleissberg cycle. As this last one undergoes sudden changes in amplitude and duration in the course of time this methodology allows one to predict with some degree of accuracy one sunspot cycle maximum in advance, but no more than that. A new methodology based on the Wavelet base functions is introduced (cf. Section 3) that allows one to detect meaningful signals from a longer time series related to solar activity. By applying it to a 7080 years series of cosmogenic isotope data and to a 1725 years sunspot maxima time series, both being presented in Section 2, we find (Section 4) that the sunspot maxima time series can be represented by the addition of a constant value of 157.2 sunspot numbers to eight ‘modes of oscillation’ to which we added a curve representing the Noise. The eight modes are the Hale one, that we renamed the bi-decadal one in view of its properties, the Semi-secular, and six additional modes, viz. the Secular, Suess, 2-Suess, Eddy, Hallstatt and 2-Hallstatt, that added to a 157.2 spotnumber level allows for an accurate representation of the Gleissberg cycle. We find that the so found eight modes have a repetitive behavior and well defined mutual relationships. These latter are based on the development of a method for predicting the eight modes of oscillation and by evaluating the Noise. By this method we were able to predict the Gleissberg cycle for the next two centuries and the dates of occurrence as well as the values of sunspot maxima ##25 to 32 (cf. Section 5). We found that the shapes of all modes, apart from that of the Hallstatt one, are directly or indirectly related to the shapes of each half of a Hallstatt successive oscillations, as follows:
Besides allowing thus for the above described long term predictions of solar activity, hence by clarifying the origin of the persistent and well- defined relationship between the eight modes of oscillations, our forecasts have relevance for the knowledge of the nature of the solar dynamo system and of its motions. In that framework the main questions that arise from the above are:
As regards question #1, such a regular behavior of the solar dynamo modes of oscillations indicates that solar dynamo motions are ultimately forced by a fairly well defined deterministic system, as is the solar-planetary one, as was suggested first by Jose56 (for a review and recent advances on that subject Scafetta52 Some new evidence about the existence of this phenomenon is presented in Subsection 5.3. However, the involved forces appear not to be strong enough to produce solar dynamo motions of the observed magnitude.60 On the other hand, as has been claimed by Fairbridge et al.55 for an accurate estimation of the interaction between the solar dynamo and the solar-planetary system we must include in the computations all the relevant physical interaction, of which the most relevant is the complicated system of physical interactions within the Solar body. Only after including this interaction and removing some other approximations it may be possible to answer questions ##2 to 6. This is a task for later investigations.
The authors are grateful to Eduardo Romero from CONAE Argentina for his helpful comments on wavelet analysis.
The author declares there is no conflict of interest.
None.

©2020 Duhau, et al. This is an open access article distributed under the terms of the, which permits unrestricted use, distribution, and build upon your work non-commercially.