Open Access Journal of
eISSN: 2575-9086


Research Article Volume 7 Issue 1
1nstitute of Exact and Natural Sciences of Pontal, Federal University of Uberlândia, Ituiutaba, MG, Brazil
2Departments of Pharmacology, Institute of Biological Science, Federal University of Minas Gerais, MG, Brazil
Correspondence: Luciana Karen Calábria, Institute of Exact and Natural Sciences of Pontal, Federal University of Uberlândia, Rua 20, 1600, Tupã, Ituiutaba, MG, Brazil, Tel 55-34-32715252
Received: June 30, 2024 | Published: August 22, 2024
Citation: Santos PVS, Faria SNSA, Castor RGM, et al. Glibenclamide alters the brain protein profile and morphometry of hippocampal regions in mice fed with a high-refined carbohydrate diet. Open Access J Sci. 2024;7(1):160-167. DOI: 10.15406/oajs.2024.07.00229
A high-refined carbohydrate diet (HC diet) has shown impacts not only on metabolic disorders, but also on cognitive and behavioral functions. However, its effects at the protein and morphological level in the brain are not known. In order to investigate the differential expression of proteins in the brain of Balb/c mice fed with a HC diet and treated or not with glibenclamide, biochemical and histological assays were performed. The brains of animals fed for eight weeks with a standard rodent diet or HC diet, and treated or not with glibenclamide for four weeks were homogenized and the supernatant was subjected to 12.5% SDS-PAGE. The brains were also blocked and 3 μm sections were stained with Hematoxylin-Eosin and analyzed using light microscopy. The electrophoretic profile of samples from untreated animals revealed protein expression without significant differences, while the group treated with glibenclamide revealed protein bands with differential expression (44.8, 42.2 and 39.8 KDa). The proteins were predicted using a bioinformatic tool and it is suggested that, for the most part, they are related to the energy metabolism of the brain. Histological analysis of the hippocampus demonstrated similarities between animals fed with a standard diet and HC diet, but with differences in the number of neurons in the CA2 and CA3 regions, and a tendency to cell death in the dentate gyrus of animals group HC diet. These results revealed one of the regions of the brain affected by excess carbohydrates, as well as candidate proteins for proteomic analysis to further investigate the effects of dietary sugars on molecular mechanisms and neurogenesis in the hippocampus.
Keywords: refined carbohydrates diet, sulfonylurea, hippocampus, SDS-PAGE, bioinformatics
The composition of the diet directly influences human physical and mental health, and it is estimated that around 11 million premature deaths could have been avoided by improving dietary quality.1,2 The presence of carbohydrates in the human diet is essential for nutrition, however, high consumption of sugars is associated with a high risk for the development of metabolic disorders and inflammatory processes in the brain.3–5 Excessive intake of sugars leads to an increase in blood glucose, which contributes to the manifestation of metabolic changes, such as obesity and diabetes mellitus.6
The brain is highly susceptible to the effects of a diet rich in sugar, and this can induce compulsive behavior through an increase in pro-inflammatory cytokines, which also appear to have their expression increased in the hippocampus due to hyperglycemia caused by a diet rich in fructose.3,7 Likewise, neurogenesis in the hippocampus appears to be affected by fructose consumption as this structure is very sensitive to the effects of this sugar. Furthermore, metabolic disorders such as diabetes mellitus can impact the production of insulin, a hormone that promotes improvement in cognitive functions and the growth of neurons in the hippocampus, and the impairment of its receptors in this area is associated with problems in learning and memory.8
Diabetes mellitus presents a risk to cognitive functions and may also be associated with the insulin resistance in patients with Alzheimer's disease, affecting cognition through inflammatory mechanisms.9,10 Furthermore, Esmaeili et al.10 revealed that the administration of glibenclamide attenuated the cognitive deficits caused by Alzheimer's disease, mainly by reducing hippocampal neuroinflammation, while increasing serum insulin levels.
The treatment of diabetes mellitus depends on a pharmacological approach and there are different drugs that can be used, including glibenclamide. This sulfonylurea stands out for stimulating insulin secretion and for its pleiotropic effects on lesions in the central nervous system and reducing neuroinflammation, especially in the hippocampus, despite having side effects like any other drug, one of which is the exhaustion of pancreatic β-cell.11,12
The effects of treatment with glibenclamide, regardless of the condition sustained in the animal, have already been investigated in different tissues and organs.13–18 However, despite the numerous benefits of using glibenclamide for the brain and the effects confirmed of the high-refined carbohydrate diet (HC diet), little is known about the metabolic pathways and morphological structures that are affected by the action of the drug, and the molecular mechanisms involved in the changes caused by the diet. Therefore, the purpose of this work was to investigate the molecular and morphological effects of HC diet treated or not with glibenclamide in Balb/c mice brains.
Animals and experimental design
All experimental procedures were approved by the Ethics Committee on Animal Research of the Federal University of Minas Gerais (UFMG) (protocol n◦ 389/2016) and are in accordance with the Guidelines of the National Council for the Control of Animal Experimentation.19 Male Balb/c mice (6 weeks old) were obtained from the Centre for Laboratory Animal Facilities and collectively housed under controlled temperature (25 ± 2◦C), humidity (40-60 %), and a 12 h light/dark cycle (06-18 h). Animals were allowed ad libitum access to food and tap water.
The animals were divided into four groups (Figure 1) and were fed with a standard laboratory chow (Nuvilab® Cr-1; Nuvital) or the HC diet during eight weeks. The HC diet contained 45 % chow diet, 45 % condensed milk, and 10 % refined sugar. Two groups were treated daily by gavage with 20 mg/kg of glibenclamide20 administered as an aqueous suspension containing 1 % carboxymethylcellulose, during the last four weeks of the experiment. The groups not treated with glibenclamide experienced the same stress with gavage, but only with the administration of the vehicle.
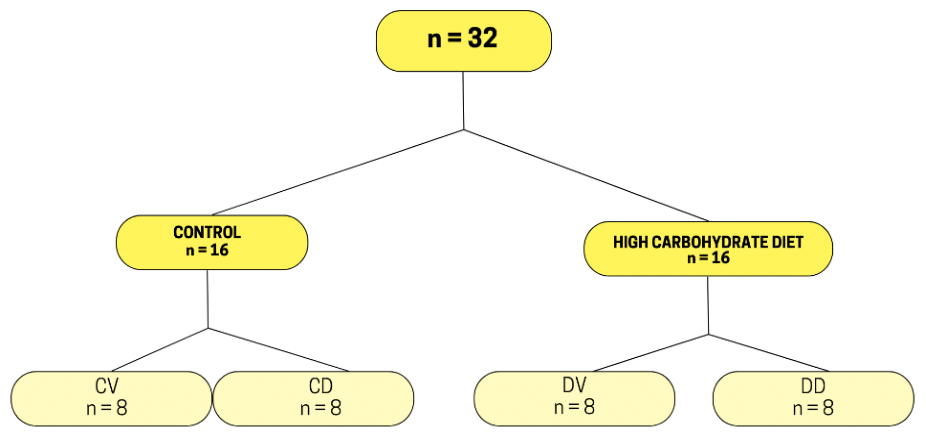
Figure 1 Groups of animals treated with standard diet + vehicle (CV), standard diet + glibenclamide (CD), HC diet + vehicle (DV) and HC diet + glibenclamide (DD).
The weight of the animals was monitored weekly. To assess adiposity, the mesenteric, epididymal and retroperitoneal adipose depots were removed and weighed to assess the adiposity index, using the formula: adiposity index % = (sum of the weights of the adipose depots/animal weight) x 100.21
The brains were dissected after the animals were euthanized after general anesthesia with ketamine (80 mg/kg) and xylazine (10 mg/kg). Part of the brains were frozen in a freezer at -30 oC until biochemical analysis were processed (n = 4, per group), while another part was fixed in 10% formalin for histological processing (n = 4, per group).
Tissue preparation and SDS-PAGE
Brains were individually homogenized on ice in homogenization buffer (25 mM TrisHCl, pH 7.5, 2 mM dithiothreitol, 10 mM EDTA, 1 mM benzamidine and 0.5 mM). The homogenates were centrifuged at 4,500 ×g for 10 min, and total protein concentration in the supernatant samples was measured following the Bradford assay.22 Aliquots of supernatant samples were solubilized in a small volume of electrophoresis sample buffer containing an additional 100 mM Tris-HCl, pH 8.0, and 25 % glycerol. Supernatant samples containing 20 μg of protein were analyzed by SDS-PAGE with a 12.5 % acrylamide-bisacrylamide. The Rf measurement of the bands of each gel lane was made using a relative molecular mass standard. The intensity of the protein bands was analyzed and compared using Scion Image software, version Alpha 4.0.3.2 (Scion Corporation) and results were expressed as percentage of total protein content.
In silico
Using as reference data from Lubec, Krapfenbauer and Fountoulakis,23 Taga,24 Medvedev et al.25 and Souza et al.26 the highlighted bands had their proteins predicted. The inclusion criterion was a variation of ± 0.5 kDa. To identify the function, the UniProtKB database (https://www.uniprot.org) was consulted, restricting the search to the organism Mus musculus and considering only revised deposits.
Morphometric analysis
The brains were fixed with 10 % formaldehyde, dehydrated in ethanol, rinsed in xylene and embedded in paraffin. Semi-serial cross-sections (3 µm) obtained on a microtome, were submitted to Hematoxylin-Eosin (H.E.) staining to evaluate the morphology and morphometry. The sections were photographed using a 40 x objective with a 10 x eyepiece and the images were digitized. ImageJ software was used to study the morphometry of neuronal cells in the dentate gyrus and the CA1, CA2 and CA3 subregions of the hippocampus. The total number of intact cells was considered and counted manually in a random manner.
Statistical analysis
Descriptive statistical analysis was performed using mean and deviation or standard error, depending on the analysis. Weight and adiposity index values were analyzed by unpaired t-test, one- or two-way analysis of variance (ANOVA), as necessary, considering a p-value < 0.05 as significant. Inferential statistics of band intensity were conducted using the Student´s t-test evaluating the two related samples using the BioEstat 5.0 software and p < 0.05 was considered significant. The morphometric data analyzed in the Jamovi software were subjected to the Student´s t-test for independent samples and the Mann-Whitney test, considering a p-value < 0.05 as significant.
The electrophoretic profile of brain supernatant samples in the CV and DV groups revealed intense expression of proteins with a molecular mass estimated at 91.6 kDa, 86.3 kDa, 74.3 kDa, 65.9 kDa, 56.8 kDa, 46.1 kDa, 40.9 kDa, 36.3 kDa and 27.8 kDa. These proteins were identified from B1 to B9 in Figure 2A. However, the electrophoretic profile from CD and DD groups revealed ten visibly expressed protein bands. The molecular mass of the most apparent bands was estimated in 91.4 kDa, 86.2 kDa, 72.1 kDa, 58.6 kDa, 53.6 kDa, 44.8 kDa, 42.2 kDa, 39.8 kDa, 27.1 kDa and 18.9 kDa (Figure 2B).
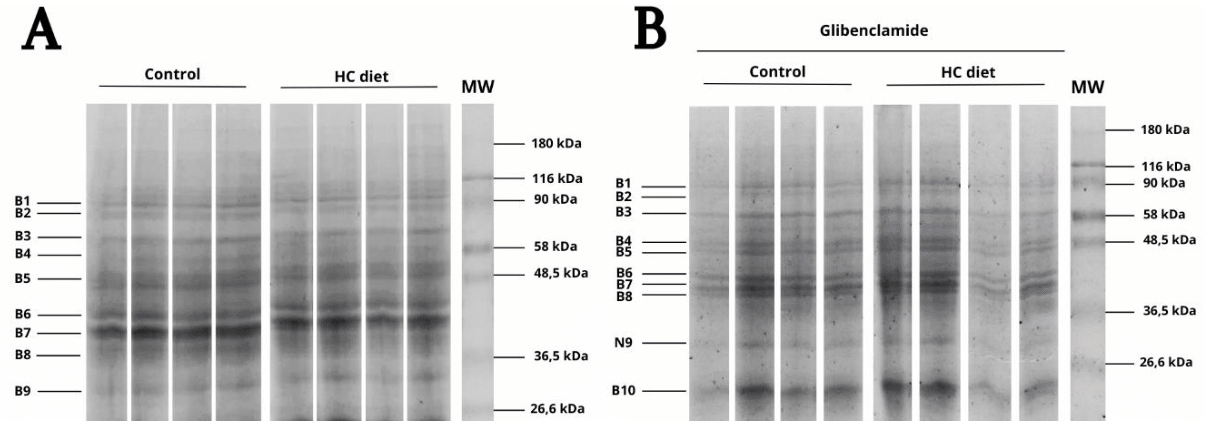
Figure 2 Electrophoretic profile of brain supernatant samples from mice fed with different diets and treated with glibenclamide.
Statistical analysis of the mean optical densitometry of the CV and DV groups (Figure 3A) did not reveal significant difference, although high-sugar diet induces the overproduction of pro-inflammatory cytokines and neuroinflammatory response.27 This diet is associated with disorders in the brain, such as anxiety, depression, neurogenesis and changes in molecular and neurochemical expression.28 Excess sucrose in the diet can also cause accumulation of advanced glycation end products in microglia, which express less of the enzyme lactoylglutathione lyase (GLO1), responsible for catalyzing the reaction of glutanione formation from methylglyoxal and subsequently into S-lactoyl-glutathione, preventing glycation reactions.29 This accumulation can result in decreased glucose uptake in the brain due to the accumulation of fibrin and vascular damage, as well as presenting a risk for the development of behavioral phenotypes related to psychiatric illnesses, such as schizophrenia and bipolar disorder.29
One hypothesis that justifies the lack of differential expression between the groups is the time of exposure to the HC diet. Although the role of sugar in the genesis of arterial hypertension30 and the association of obesity and the development of cardiomyopathy is recognized, the same animals showed morphofunctional damage to the heart, but without changes in blood pressure, blood glucose fasting and increased visceral fat.15 Thus, the animals did not present intolerant to glucose, or classic changes observed in experimental models of diabetes, or even some cardiac damage.
However, the association between diet and cardiac dysfunction does not appear to involve greater adiposity or obesity.15,21,31 There was no difference in final body weight between the four groups, but the HC diet increased the adiposity index of both groups submitted to the diet (Figure 3), indicating that glibenclamide does not alter the gain in visceral fat induced by the HC diet.

Figure 3 Effects of glibenclamide on biometric parameters, body weight (A) and adiposity index (B). Two-way ANOVA, followed by Bonferroni test. *p < 0.05 vs control; p > 0.05 (n.s.).
Furthermore, the expression of proteins from the CD and DD groups treated with glibenclamide was compared and revealed proteins with 44.8 kDa (p < 0.05), 42.2 kDa (p < 0.05) and 39.8 KDa (p < 0.01) more significantly expressed in the brain of individuals fed with HC diet (Figure 4 A, B).
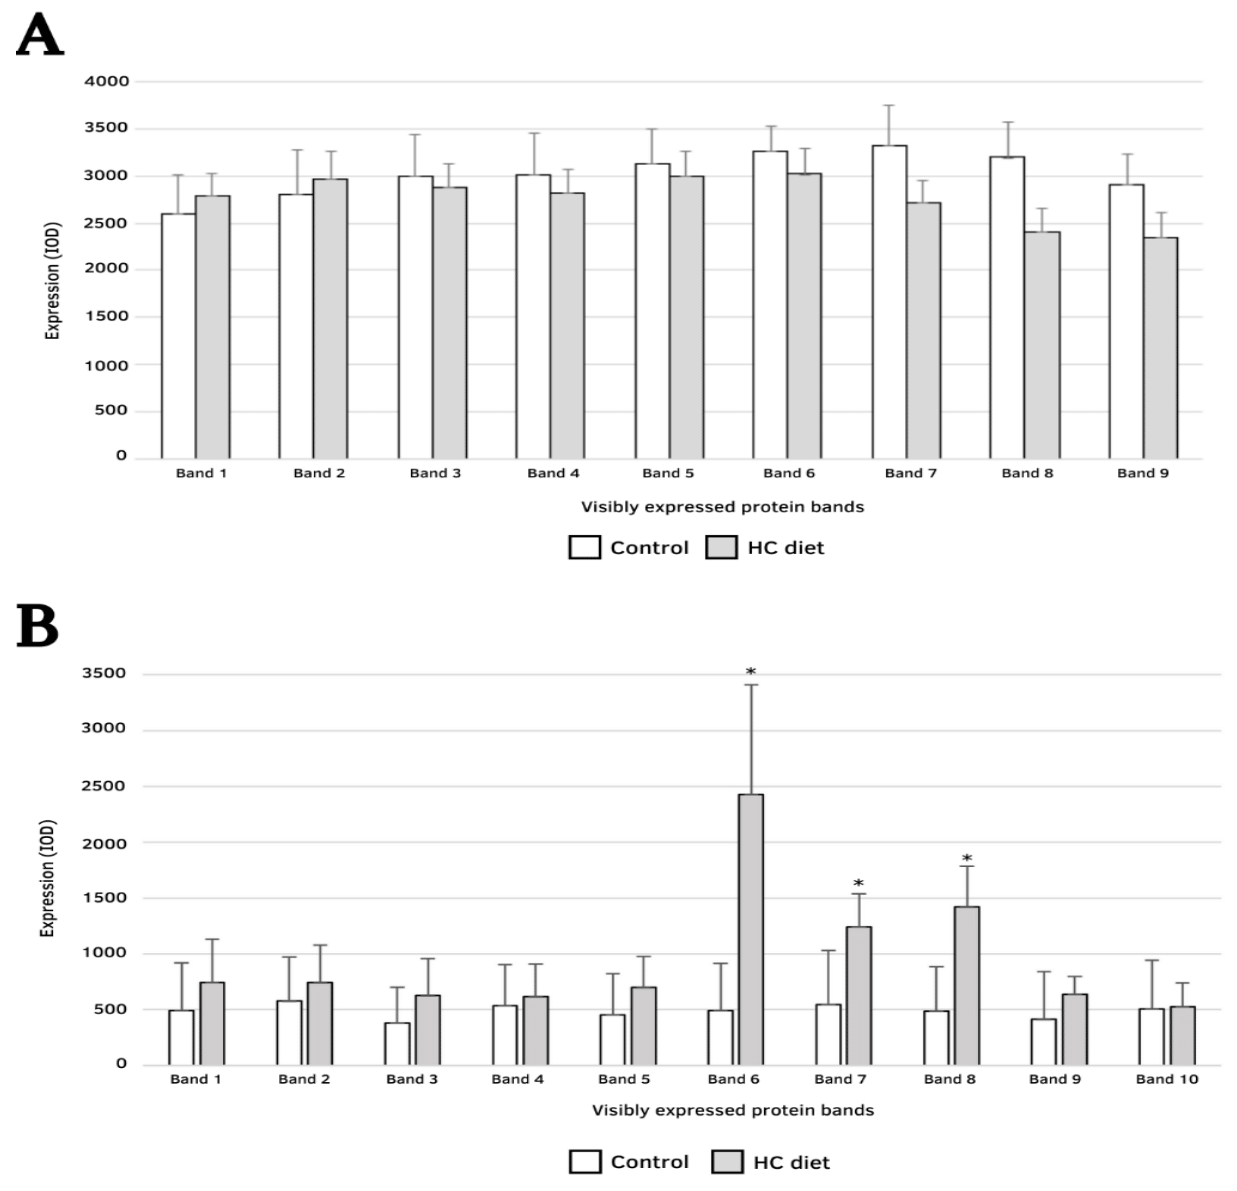
Figure 4 Optical densitometry index (average), standard error (y-axis) and estimated molecular mass (x-axis) identified in mice brain samples from groups CV and DV (A) and CD and DD (B), *p < 0.05.
Using literature review and validation by bioinformatics, the proteins highlighted in the samples analyzed in SDS-PAGE were predicted with their function in biological systems (Table 1). However, although more than 1,500 proteins have already been identified in the human brain,32 few proteomic studies have been carried out in this tissue that could serve as a basis for predicting differentially expressed proteins, restricting the list, considering the reference and estimated molecular mass criteria (± 0,5 kDa).
|
UniProt ID |
Protein Name |
Function |
MW (kDa) |
References |
|
|
Estimated |
Reference |
||||
|
P08113 |
Endoplasmin |
Chaperone that functions in the processing and transport of secreted proteins |
91,6 |
92,713 |
Medvedev et al.25 |
|
Q62108 |
Disks large homolog 4 |
Postsynaptic clustering of proteins |
86,3 |
85,605 |
Lubec et al.23 |
|
Q99KI0 |
Aconitate hydratase |
Catalyzes the isomerization of citrate to isocitrate |
86,2 |
86,34 |
Lubec et al.23 |
|
Q8K2B3 |
Succinate dehydrogenase (ubiquinone) |
Transference of electrons from succinate to ubiquinone in mitochondrial complex II |
74,3 |
73,671 |
Lubec et al.23 |
|
Q9CQN1 |
Heat shock protein 75 |
Maintenance of mitochondrial function and polarization |
74,199 |
||
|
P20029 |
Endoplasmic reticulum chaperone |
Protein folding and quality control in the endoplasmic reticulum lumen |
72,1 |
72,18 |
Lubec et al.23 |
|
P04104 |
Keratin, type II cytoskeletal 1 |
Regulation the activity of kinases |
65,9 |
66,018 |
Lubec et al.23 |
|
Q3TTY5 |
Keratin, type II cytoskeletal 2 epidermal |
Activation, proliferation and keratinization of keratinocyte |
66,11 |
||
|
Q99MN9 |
Propionyl-CoA carboxylase beta chain |
Catalyzes the carboxylation of propionyl-CoA/propanoyl-CoA to D-methylmalonyl-CoA/(S)-methylmalonyl-CoA |
58,6 |
58,795 |
Lubec et al.23 |
|
P47739 |
Aldehyde dehydrogenase |
NAD+-dependent oxidation of aldehyde substrates |
56,8 |
56,772 |
Lubec et al.23 |
|
56,453 |
Medvedev et al.25 |
||||
|
Q91ZJ5 |
UTP-glucose-1-phosphate uridylyltransferase |
Conversion of glucose-1-phosphate into UDP-glucose |
56,953 |
Lubec et al.23 |
|
|
P62814 |
V-type proton ATPase subunit B, brain isoform |
Non-catalytic subunit of V-ATPase, responsible for acidifying and maintaining the pH of intracellular compartments, and acidifying the extracellular environment |
56,823 |
||
|
P52480 |
Pyruvate kinase |
Mediation of the transfer of a phosphoryl group from phosphoenolpyruvate to ADP |
57,781 |
Medvedev et al.25 |
|
|
P56480 |
ATP synthase subunit beta, mitochondrial |
Forms the F1 catalytic core of ATP synthase |
56,318 |
||
|
Q9EQ20 |
Methylmalonate-semialdehyde dehydrogenase |
Binds to fatty acyl-CoA and acts on valine and pyrimidine metabolism |
57,771 |
||
|
P54869 |
Hydroxymethylglutaryl-CoA synthase |
Catalyzes the first irreversible step in ketogenesis |
56,9 |
||
|
P31930 |
Cytochrome b-c1 complex subunit 1, mitochondrial |
Drive to oxidative phosphorylation in the electron transport chain |
56,3 |
56,26 |
Lubec et al.23 |
|
P05201 |
Aspartate aminotransferase |
Biosynthesis of L-glutamate from L-aspartate or L-cysteine |
46,334 |
Lubec et al.23 |
|
|
46,1 |
46,400 |
Medvedev et al.25 |
|||
|
O88544 |
COP9 signalosome complex subunit 4 |
Component of the COP9 signalosome complex, a complex involved in various cellular and developmental processes |
46,453 |
Lubec et al.23 |
|
|
P10630 |
Eukaryotic initiation factor 4A-II |
ATP-dependent RNA helicase |
46,4 |
||
|
P17182 |
α-Enolase |
Convert 2-phosphoglycerate into phosphoenolpyruvate, activate plasminogen on the cell surface and stimulate the synthesis of immunoglobulins |
47,098 |
Medvedev et al.25 |
|
|
P16460 |
Argininosuccinate synthase |
Catalyzes the formation of arginosuccinate from aspartate |
46,467 |
||
|
P46096 |
Synaptotagmin-1 |
Regulation of synaptic vesicle trafficking |
47,369 |
||
|
P09041 |
Phosphoglycerate kinase |
Participates in glycolysis and gluconeogenesis |
44,8 |
44,91 |
Souza et al.26 |
|
P21279 |
Guanine nucleotide-binding protein G(q) subunit alpha |
Modulator or transducer in various transmembrane signaling systems |
42,2 |
42,38 |
Lubec et al.23 |
|
Q91V12 |
Cytosolic acyl coenzyme A thioester hydrolase |
Catalyzes the hydrolysis of acyl-CoAs into free fatty acids and coenzyme A |
40,9 |
41,149 |
Lubec et al.23 |
|
Q99LC3 |
NADH dehydrogenase (ubiquinone) 1 alpha subcomplex subunit 10, mitochondrial |
Mitochondrial complex I subunit |
40,5 |
Taga24 |
|
|
P60710 |
Actin, cytoplasmic 1 |
Protein that produces filaments that form cross-linked networks in the cytoplasm of cells, and plays a role in cell motility and contraction |
41,710 |
Medvedev et al.25 |
|
|
Q91Y97 |
Fructose-bisphosphate aldolase B |
Catalyzes reactions in glycolysis, gluconeogenesis and fructolysis |
39,593 |
||
|
P11725 |
Ornithine transcarbamylase |
Catalyzes the second step of the urea cycle |
39,861 |
||
|
G5E8V9 |
Arfaptin-1 |
Plays a role in controlling biogenesis of secretory granules at the trans-Golgi network |
40,754 |
||
|
P05064 |
Fructose-bisphosphate aldolase A |
Participates in glycolysis and gluconeogenesis |
39,72 |
Lubec et al.23 |
|
|
P45376 |
Aldo-keto reductase family 1 member B1 |
Catalyzes the NADPH-dependent reduction of a wide variety of carbonyl-containing compounds to their corresponding alcohols |
36,098 |
Lubec et al.23 |
|
|
36,3 |
|||||
|
P16858 |
Glyceraldehyde-3-phosphate dehydrogenase |
Plays a role in glycolysis and nuclear functions |
36,07 |
Lubec et al.23 |
|
|
35,9 |
Taga24 |
||||
|
P14152 |
Malate dehydrogenase, cytoplasmic |
Catalyzes the reduction of aromatic alpha-keto acids in the presence of NADH |
36,5 |
||
|
P63330 |
Serine/threonine-protein phosphatase 2A catalytic subunit alpha isoform |
Major phosphatase for microtubule-associated proteins |
36,141 |
Lubec et al.23 |
|
|
P97429 |
Annexin A4 |
Promotes membrane fusion and is involved in exocytosis |
35,957 |
||
|
P06151 |
L-lactate dehydrogenase A chain |
Interconverts simultaneously and stereospecifically pyruvate and lactate with concomitant interconversion of NADH and NAD+ |
36,4 |
Taga24 |
|
|
P00329 |
Alcohol dehydrogenase 1 |
Conversion of unbranched primary alcohols to their corresponding aldehydes |
36,8 |
||
|
Q9CQ62 |
2,4-dienoyl-CoA reductase |
Auxiliary enzyme of beta-oxidation |
36,110 |
Medvedev et al.25 |
|
|
Q9DCW4 |
Electron transfer flavoprotein subunit beta |
Accepts electrons from several mitochondrial dehydrogenases |
27,8 |
28,054 |
Lubec et al.23 |
|
27,670 |
Medvedev et al.25 |
||||
|
P17751 |
Triosephosphate isomerase |
Interconversion between dihydroxyacetone phosphate and D-glyceraldehyde-3-phosphate |
27,35 |
Souza et al.26 |
|
|
P28663 |
Beta-soluble NSF attachment protein |
Required for vesicular transport between the endoplasmic reticulum and the Golgi apparatus |
28,122 |
Lubec et al.23 |
|
|
P16546 |
Spectrin alpha chain, non-erythrocytic 1 |
Calcium-dependent movement of the cytoskeleton at the membrane |
28,5 |
Taga24 |
|
|
P61982 |
14-3-3 protein gamma |
Regulation of a large spectrum of both general and specialized signaling pathways |
28,324 |
Lubec et al.23 |
|
|
Q9CQV8 |
14-3-3 protein beta/alpha |
28,047 |
Lubec et al.23 |
||
|
28 |
Taga24 |
||||
|
P63101 |
14-3-3 protein zeta/delta |
27,898 |
Lubec et al.23 |
||
|
P68510 |
14-3-3 protein eta |
28,2 |
Taga24 |
||
|
P68254 |
14-3-3 protein theta |
27,8 |
|||
|
P20108 |
Thioredoxin-dependent peroxide reductase |
Catalyzes the reduction of hydrogen peroxide and organic hydroperoxides |
28,277 |
Medvedev et al.25 |
|
|
P97493 |
Thioredoxin, mitochondrial |
Control of mitochondrial reactive oxygen species homeostasis, apoptosis regulation and cell viability |
18,9 |
18,2 |
Medvedev et al.25 |
Table 1 Prediction of proteins highlighted in the electrophoretic profile of the mice brain fed with a HC diet (or not) and treated with glibenclamide (or not)
Based on the prediction, there is an indication that the mice brains analyzed present proteins that express different functions, including energy metabolism for all macromolecules, such as carbohydrates, lipids and amino acids. Furthermore, we have proteins associated with mitochondrial reactions that involve the citric acid cycle and the synthesis of ATP by the electron transport chain, as well as proteins with regulatory and structural functions, with different roles. In neurons and astrocytes, glucose is the initial source of substrates for the citric acid cycle and obtaining chemical energy,5 justifying that most predicted proteins are related to brain energy function.
The glucose is one of the main sources of energy, but when in excess, can be harmful to health, with its plasma levels regulated hormonally by insulin.33 Glibenclamide acts as an insulin secretagogue, and despite its relevance, the sulfonylurea receptor 1 (SUR1; +/- 43.56 kDa; Q61743),34 which plays a fundamental role in several forms of damage to the central nervous system and has its function altered by the action of glibenclamide, is not in the list of proteins predicted and differentially expressed in the mice brain.35
Glibenclamide acts via the SUR subunit composition of ATP-sensitive potassium channels expressed in the receptor on pancreatic β-cells, function as an insulin secretagogue by inducing its closure.35 In ATP depletion, the efflux of potassium ions causes hyperpolarization of the cell. Glibenclamide inhibits the hyperpolarization of pancreatic β-cells, resulting in an increase in intracellular calcium concentration and insulin release. SUR channels (Sur1-Trpm4) form in the central nervous system after pathological conditions and, when they open, the influx of Na+ causes membrane depolarization. In the absence of ATP to close the channel, the unregulated influx of Na+ causes cytotoxic edema, however, glibenclamide inhibits the opening of this channel.36,37 Even though it is an insulin secretagogue, the tested dose of glibenclamide did not interfere the glucose homeostasis of the mice, based on the insulin resistance and fasting blood glucose test carried out by Castor.15
The brains of individuals in the CD and DD groups showed differential expression for proteins corresponding to molecular masses 44.8 kDa, 42.2 kDa and 39.8 KDa, predicted as phosphoglycerate kinase, α-subunit of the guanine nucleotide-binding Gs protein and fructose bisphosphate aldolase, respectively.
Phosphoglycerate kinase and fructose bisphosphate aldolase are reversible enzymes, without allosteric regulation in the glycolytic pathway. Therefore, its levels are not altered through gene expression. Treatment with glibenclamide effectively protects against glial activation, memory dysfunction and chronic cognitive sequelae,38 as well as being associated with hippocampal angiogenesis and neurogenesis in the cortex and hippocampus, linked to a better behavioral outcome.39
Furthermore, the guanine nucleotide-binding protein G(q) subunit alpha was predicted and its higher expression was revealed in the brain of mice treated with glibenclamide. The study by Wada et al.40 revealed a new vision of the mechanism of regulation of the SUR channel by G proteins, corroborating the results obtained in this study.
Regarding learning, Patel et al.41 showed that treatment with glibenclamide generates better performance in the Morris Maze, but performance inversely correlated for degenerated neurons in the hilus, concluding that the drug may have long-term protective effects in the hippocampus after mild to moderate traumatic brain injury. Furthermore, Esmaeili, Hosseini and Rastak42 confirmed the positive effect of glibenclamide on memory and learning, blocking K+-ATP channels or sensitizing insulin in the brain, improving learning and memory storage in a dose-dependent manner. Furthermore, a significant effect was demonstrated in the reduction of inflammatory cytokines, such as IL-6 and TNF-α, in the hippocampus of diabetic rats treated with glibenclamide, which is relevant considering that the increase in these markers can lead to insulin resistance in the central nervous system, impairing cognitive functions.10
In rat brain, Costa et al.18 showed an increase in α-CaMKII protein levels when treated with glibenclamide, despite its distribution being uniform in different brain regions. CaMKII is an important enzyme in the regulation of glutamatergic synapses43 and is essential for insulin synthesis.44 Furthermore, an increase in the activity of the enzyme glutathione peroxidase and a reduction in the activity of superoxide dismutase, both markers of oxidative stress, were also detected. By altering insulin secretion, oxidative stress is likely to be reduced, reducing the hyperglycemic state, and improving the levels of proteins associated with the traffic and anchoring of synaptic vesicles.18
Another fact to be discussed is the direct result of treatment with glibenclamide, which, despite being an insulin secretagogue, did not interfere with glucose homeostasis parameters,15 confirming that its action is not justified by its hypoglycemic effect in this work, but possibly regulating, through insulin, several allosteric enzymes of glucose and lipid metabolism through gene expression.45
It is important to highlight that most metabolic pathways in an individual are regulated by gene expression by insulin and are dependent on the plasma glucose level, including carbohydrate and lipid synthesis and degradation pathways.46 Insulin modulates the activity of neurons in the arcuate nucleus of the hypothalamus, since its release stimulates glutamatergic neurons and the secretion of other hormones, causing a reduction in food intake.47
Histological analysis demonstrated similarities between the brain tissues of mice fed with a standard diet and HC diet. The hippocampus, formed by two regions known as Ammon's Horn (CA1, CA2 and CA3) and the dentate gyrus, has two main cell types, the granule cells of the dentate gyrus and the pyramidal cells of the Ammon's Horn.
Particularly in the CA1 region (Figure 5), pyramidal neurons were observed relatively close to each other and in a very distinct laminar organization, with extracellular matrix markedly homogeneous, finely granular and pink color. The nuclei appear voluminous, globose, with decondensed chromatin and an evident nucleolus. Glial cells were evidenced by their smaller size in relation to neurons, appearing apparently normal.
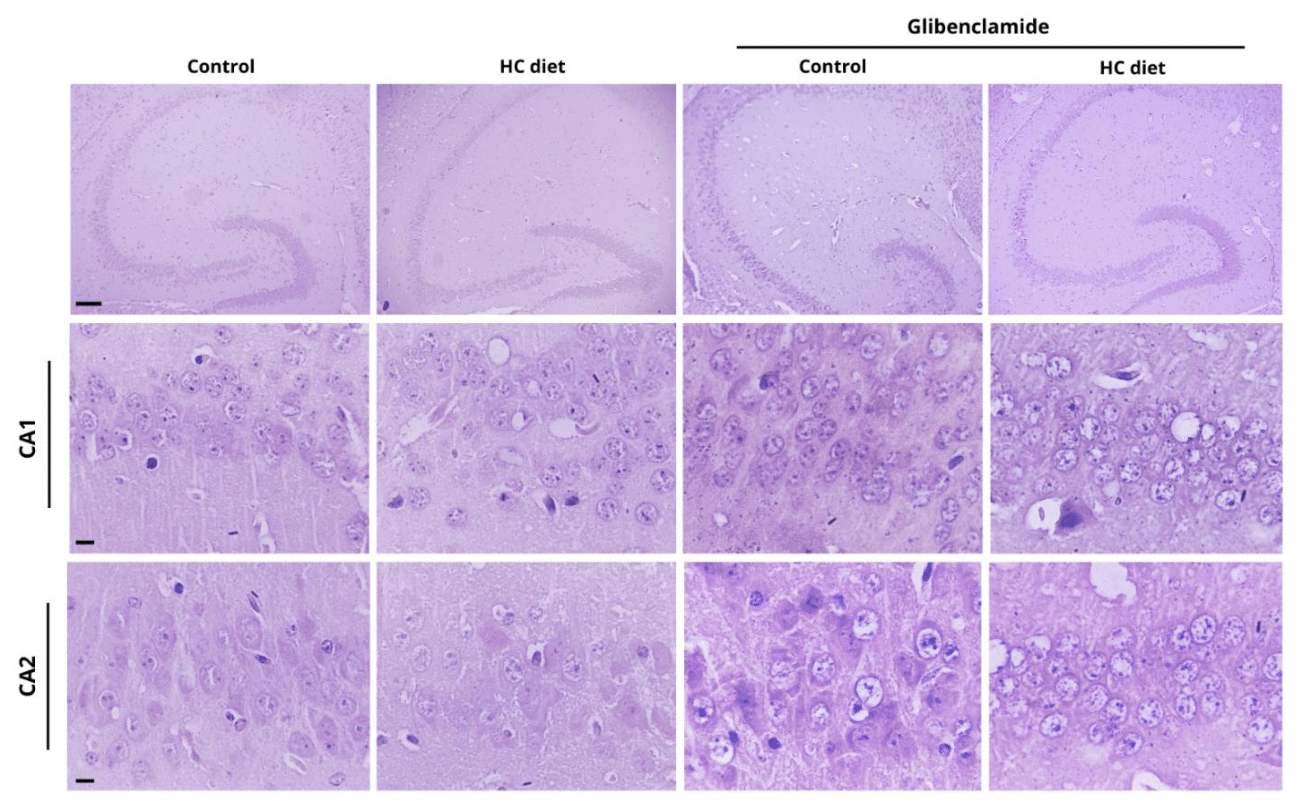
Figure 5 Hippocampal CA1 and CA2 regions in mice brain treated with different diets and in the presence or absence of glibenclamide. Scale bars equal 600 μm (hippocampus); 200 μm (CA1 and CA2).
The CA2 region (Figure 5) is characterized by a large amount of extracellular matrix, resulting in more spaced cells, with the same characteristics described for the cells present in CA1. Statistical analysis revealed a significant difference in the number of neurons present in this region comparing mice fed with standard and HC diets (Figure 7, p < 0.05). The increase in the number of cells in the CA2 region can be better investigated through new studies in the brain after HC diet using different methodological strategies, to analyze the differential expression of target proteins and mRNA that may justify (or not) the results found.
The CA3 region (Figure 6) presents cells with smaller nuclei and is characterized by a parabolic arc that is related to CA2, with more evident cytoplasm compared to the other areas. Statistical analysis revealed a difference in the number of neurons present in the CA3 region comparing mice treated with glibenclamide (Figure 7, p < 0.05).
The last layer of the hippocampus, the dentate gyrus, has a vast number of cells in a parabolic arc and a low amount of extracellular matrix (Figure 6). In animals submitted to the HC diet, a tendency towards cell death was observed and confirmed by statistical analysis comparing mice treated with glibenclamide (Figure 7, p = 0.057).
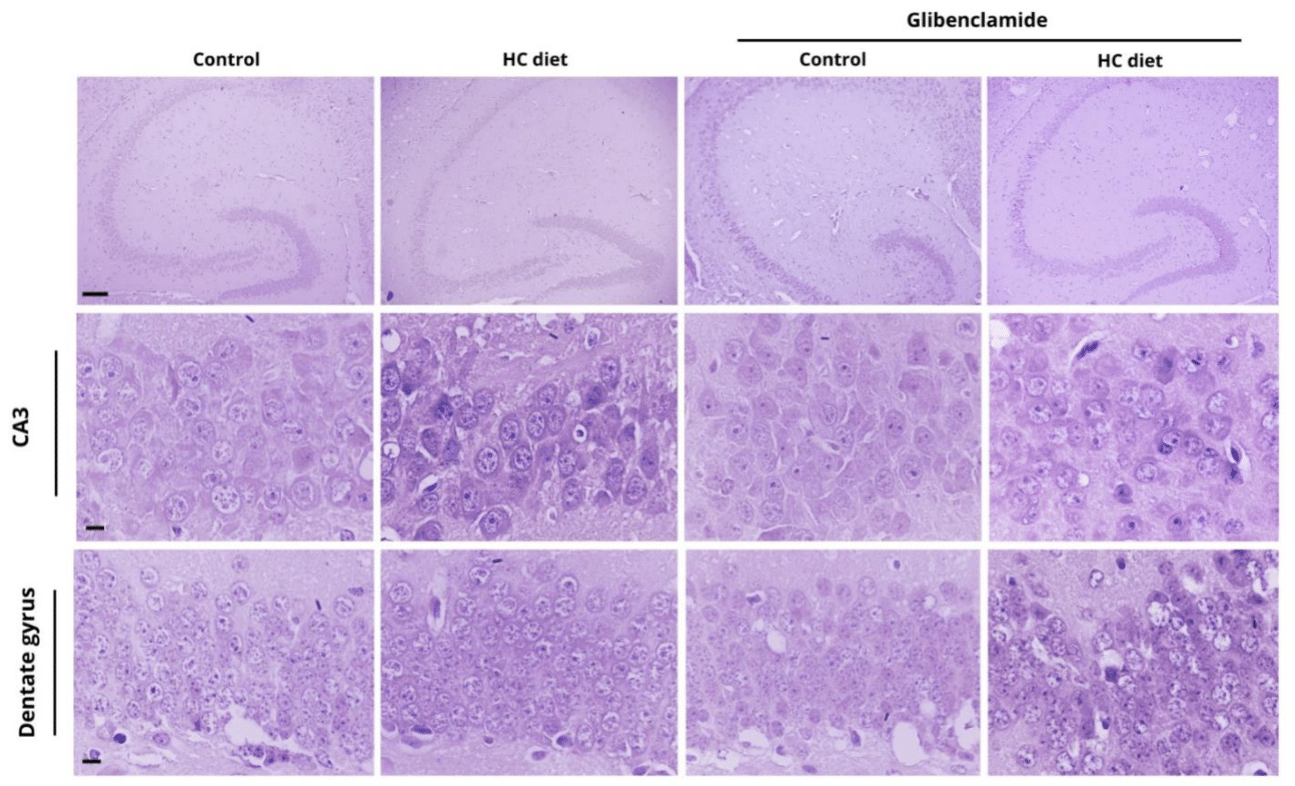
Figure 6 Hippocampal CA3 and dentate gyrus regions in mice brain treated with different diets and in the presence or absence of glibenclamide. Scale bars equal 600 μm (hippocampus); 200 μm (CA1 and CA2).
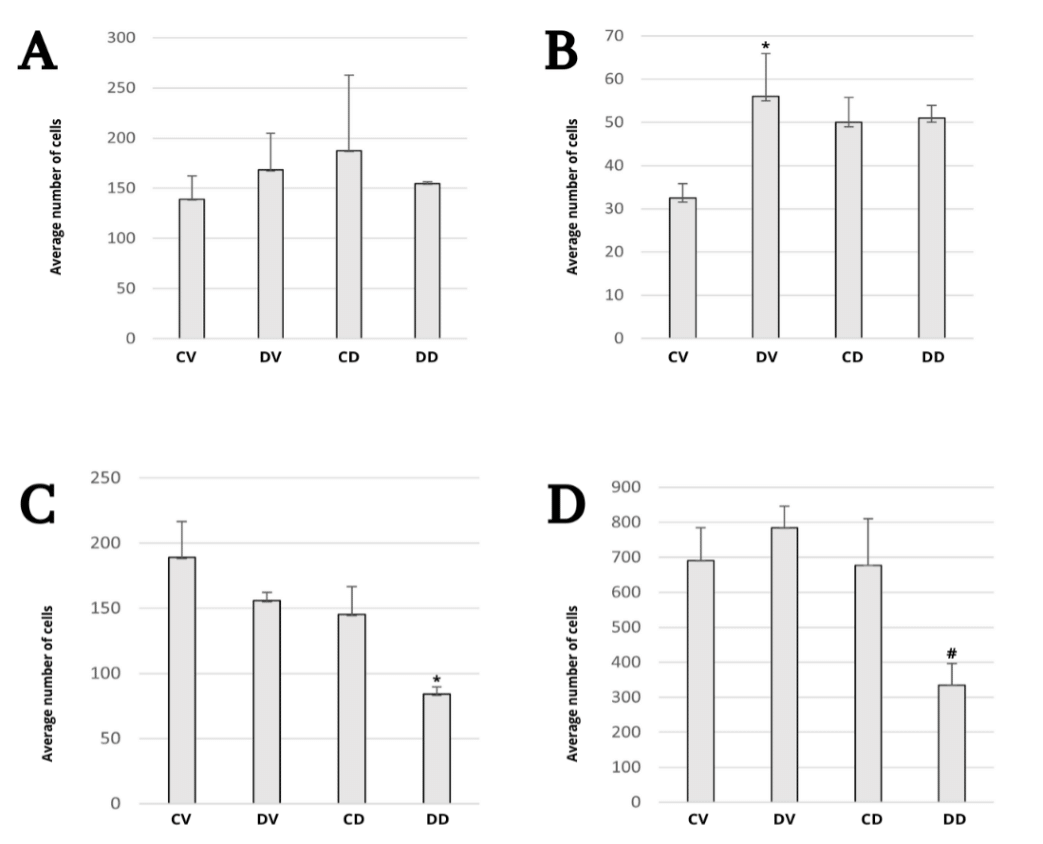
Figure 7 Morphometry of neuronal cells in the hippocampal regions CA1 (A), CA2 (B), CA3 (C) and dentate gyrus (D) of the mice brain in each group, *p < 0.05 and #p = 0.057.
A more basophilic appearance in the neurons of animals submitted to the HC diet and treated with glibenclamide was also observed, in contrast to a more subtle appearance in animals without treatment. This change may be related to the accumulation of lipofuscin, a granular pigment associated with oxidative stress and cell death, mitochondrial damage, in addition to changes in the expression of specific proteins that can affect the coloring of cells with the histological staining technique used in this study.
Considering that the histological structure of the brain was significantly preserved in ischemic stroke after treatment with glibenclamide when compared with decompression alone,48 it is hypothesized that the protein overexpression observed in animals receiving HC diet and glibenclamide may be the result of an increase in the population of neurons. However, as mentioned previously, the morphometric analysis of the CA1 region did not show a significant change in the number of cells, while the CA3 region and the dentate gyrus showed a decrease in the number and a tendency to cell death, respectively, in animals that received the HC diet and treatment with glibenclamide. This result may indicate interference from excess sugar in the process of hippocampal neurogenesis, one of the brain structures in which the formation of new neurons persists throughout life, especially in the dentate gyrus.49,50
Our results corroborate previous studies that suggest a reduction in neurogenesis in the dentate gyrus of rats through the induction of apoptosis through the consumption of sucrose and fructose. This may result in an increase in the serum concentration of TNF-α, due to a deficiency in the receptor gene for these cytokines in rats with elevated hippocampal neurogenesis.51 Moreover, evidence has shown that a diet rich in fructose suppresses neurogenesis in the dorsal region of the hippocampus, impairing learning and memory processes.49
Furthermore, Beecher et al.52 showed that rats with chronic and unrestricted sucrose consumption had a lower density of proliferative cells in the dentate gyrus, which may be a consequence of decreased neurogenesis in its initial stages, suggesting that in the long term, excessive sugar consumption may contribute to an increased risk of developing neurocognitive deficits in adulthood. Thus, despite its neuroprotective effect and neurogenesis after cerebral ischemia,39 glibenclamide appears not to have exerted neuroprotection in animals submitted to the HC diet.
In the present study, there was no difference in protein expression in the brain of mice of the groups fed with standard diet and HC diet. The short time of exposure of the animals to the diet may justify the absence of changes. On the other hand, glibenclamide treatment in the group fed with a HC diet resulted in the differential expression of three protein bands. These proteins are candidates for proteomic analysis and future prediction.
From the proteomic characterization of the brain, it is possible to understand the structure and function of this highly specialized, organized and complex organ. Furthermore, many neurodegenerative diseases affect specific regions of the brain and understanding their proteomics opens up perspectives for more targeted diagnoses and treatments, in addition to being the basis for future clinical and applied studies.
Morphometric analysis of the hippocampal regions demonstrated similarity between mice fed with a standard diet and HC diet, but with a difference in the number of neurons in the CA2 and CA3 regions, with a tendency to cell death in the dentate gyrus of animals fed with the HC diet. The decrease in the number of cells and tendency to cell death may indicate a reduction in the neurogenesis process in the hippocampus through the induction of apoptosis.
It is important to expand research on a diet rich in sugar, especially on its long-term consumption. Thus, investigate the effects of glucose resistance and changes in insulin levels caused by diet on the molecular mechanisms of nervous tissue, to identify the modulated pathways and macromolecules of interest in the described metabolic disorders and in the process of neurogenesis.
This study was financed, in part, by the Coordenação de Aperfeiçoamento de Pessoal de Nível Superior (CAPES), by Fundação de Amparo à Pesquisa do Estado de Minas Gerais (FAPEMIG APQ-02768-17) for the scholarship granted to RGMC, by Federal University of Minas Gerais, and by Federal University of Uberlândia for the scholarship granted to PVSS (DIREN/PET 346/2022) and SNSF (DIREN/PET 346/2022) in the Tutorial Education Program (PET Bio Pontal). The authors would like recognize Patrícia das Dores Lopes by dissecting the brains, Michael Douglas Canedo Santos and Julio Cesar Inacio de Carvalho by histological processing, and Victor Antonio Ferreira Freire by statistical analysis.
The authors have declared that no conflicts of interest exist.

©2024 Santos, et al. This is an open access article distributed under the terms of the, which permits unrestricted use, distribution, and build upon your work non-commercially.