Open Access Journal of
eISSN: 2575-9086


Short Communication Volume 9 Issue 1
 Valerie Cousineau,2 Brahian Cano Urrego3
1Roche Molecular Systems, Inc., Pleasanton, California, USA
2Ventana Medical Systems, Inc., Tucson, Arizona, USA
3IT Engagement Inc. Bridgewater, New Jersey, USA
Correspondence: Jesse Albert Canchola, 4300 Hacienda Drive, Pleasanton, CA 94544, USA
Received: June 30, 2026 | Published: July 15, 2026
Citation: Canchola JA, Cousineau V, Cano Urrego B. Borderline regions in tissue diagnostics and cutoffs in molecular diagnostics: distinguishing reader uncertainty from analytical threshold uncertainty. Open Access J Sci. 2026;9(1):354-361. DOI: 10.15406/oajs.2026.09.00319
Background: In tissue diagnostics, borderline or equivocal regions often arise because specimens near a histopathologic or biomarker scoring threshold are difficult for pathologists to classify reproducibly. In molecular diagnostics, cutoff analysis commonly addresses analytical signal behavior near a cycle threshold (Ct), limit of detection (LoD), or positivity rule. Although both scenarios involve uncertainty near a decision boundary, they represent different sources of diagnostic variability.
Objective: To distinguish the statistical and regulatory implications of a borderline tissue diagnostic reader region from a molecular cutoff-analysis problem in method comparison against a comparator assay, with emphasis on comparator-relative discordance that can occur when investigational Ct values are higher than comparator Ct values and when different Ct cutoff rules are applied.
Methods: We developed a conceptual framework and illustrative in-silico simulations. For tissue diagnostics, a latent continuous tissue score was classified using a 10% positivity threshold and interpreted by three simulated pathologist readers. The baseline study contained 300 specimens, followed by a 20% enrichment scenario in which 60 additional specimens were sampled from the 5% to 15% borderline region. For molecular diagnostics, 500 simulated specimens were tested by a comparator assay and an investigational assay. The investigational assay was modeled with a mean Ct of 0.8 higher than the comparator, random analytical variation, late nonspecific amplification in a small fraction of target-absent specimens, and candidate Ct cutoffs from 36 to 40 cycles. Positive percent agreement (PPA), negative percent agreement (NPA), overall percent agreement (OPA), and stratum-specific disagreement patterns were calculated.
Results: In the tissue simulation, overall majority-reader PPA/NPA in the baseline study were 97.3% and 98.0%, respectively; after stratification, borderline-region PPA/NPA were lower at 86.7% and 90.0%, with complete three-reader agreement of 61.7% in the borderline region versus 100.0% in clear positive or clear negative cases. After adding 20% more borderline specimens, the enriched dataset better characterized the difficult region: borderline-region PPA/NPA were 90.0% and 88.3%, with complete three-reader agreement of 63.3%. In the molecular simulation, raising the investigational Ct cutoff from 36 to 40 increased PPA from 74.6% to 99.6% but decreased NPA from 100.0% to 95.8%. At a Ct cutoff of 38, 16 of 17 apparent false negatives occurred among comparator-positive specimens with comparator Ct >36 to ≤38, indicating that higher investigational Ct values primarily affected low-target, late-amplifying specimens.
Conclusions: A borderline tissue diagnostic region is primarily a reader reproducibility and specimen-spectrum problem, whereas a molecular Ct cutoff is primarily an analytical detection and decision-rule problem. Enriching borderline tissue cases can be appropriate to stress-test pathologist reproducibility, while molecular cutoff analysis should focus on LoD, precision near cutoff, Ct-shift bias, repeatability, comparator limitations, and transparent discordance characterization. Treating these scenarios as interchangeable risks either understating reader variability in tissue diagnostics or misclassifying expected analytical variation near molecular detection limits as categorical assay failure.
Keywords: tissue diagnostics, molecular diagnostics, equivocal zone, cutoff analysis, cycle threshold, method comparison, pathologist reader study, PPA, NPA, OPA, limit of detection, diagnostic validation
Diagnostic assays are intended to provide clinically useful results. In many qualitative and semi-quantitative diagnostic settings, this requires translating an underlying continuous, ordinal, or semi-quantitative measurement signal into a clinically interpretable categorical result. For example, a histopathology assay may translate staining percentage, staining intensity, morphologic pattern, or a composite score into a positive, negative, or equivocal result. A molecular assay may translate fluorescence amplification into a detected, not detected, invalid, or indeterminate result according to cycle thresholds (Ct) and target-detection rules. Although the underlying evidence may be continuous or semi-quantitative, the reported result is often categorical. Such qualitative results should be evaluated with appropriate performance measures, including sensitivity/specificity when compared with a reference standard or positive percent agreement (PPA)/negative percent agreement (NPA) when compared with a non-reference comparator, and should be reported with confidence intervals as recommended in public diagnostic-test guidance.1,2
The similarity between tissue diagnostic borderline zones and molecular Ct cutoff zones is superficial. Both occur near a decision boundary, but the uncertainty arises from different mechanisms. In tissue diagnostics, reader uncertainty may occur near an explicit scoring threshold, but challenging cases can also arise in assays without a formal borderline region. For example, assays such as mismatch repair (MMR) immunohistochemistry or anaplastic lymphoma kinase (ALK) immunohistochemistry may present interpretive challenges because of weak or focal staining, heterogeneous staining, artifact, internal-control ambiguity, or pattern-recognition complexity rather than proximity to a numeric cutoff. The present examples focus on the near-cutoff scenario because it most directly parallels molecular cutoff analysis. More broadly, the tissue-diagnostic principle is that validation and reproducibility studies should include cases expected to stress reader interpretation, whether those cases are borderline by cutoff, visually challenging, heterogeneous, or otherwise difficult to classify. When such cases are sparse, a study may produce high overall agreement while failing to characterize performance where disagreement is most likely. This concern aligns with the general concept of spectrum bias: omitting intermediate or difficult cases may produce an overly optimistic estimate of diagnostic performance.1,3–5
In molecular diagnostics, cutoff uncertainty usually concerns analytical detection behavior. Ct values are influenced by target concentration, extraction efficiency, reagent and instrument performance, sample quality, amplification efficiency, and the algorithm used to call a signal positive. A higher Ct value in an investigational assay relative to a comparator may represent reduced analytical sensitivity, systematic Ct bias, matrix effects, target-region differences, stochastic sampling near limit of detection (LoD), or ordinary imprecision around a low target concentration. Conversely, late amplification in a comparator-negative specimen may represent true low-level target, nonspecific amplification, contamination, or comparator insensitivity. Thus, molecular cutoff analysis is not primarily a reader problem; it is a measurement, detection-probability, and decision-rule problem.6–11,19 This distinction matters in regulatory study design. For a tissue assay, a request to add approximately 20% more samples concentrated in an equivocal or borderline region may be interpreted as a request to better evaluate pathologist-reader performance under the most challenging conditions. For a molecular method comparison, however, adding more borderline specimens is not sufficient unless those specimens are analytically meaningful, well characterized, and distributed around the LoD or clinical decision point. The molecular question is not whether a pathologist can consistently classify borderline tissue, but whether the assay’s positivity rule remains clinically and analytically robust in the presence of an investigational Ct value higher than the comparator's Ct, stochastic low-copy detection, and comparator uncertainty.1,3,6–8,12
The objective of this article is to provide a conceptual and statistical framework for distinguishing these scenarios. We first define the relevant sources of uncertainty, then present in-silico examples that illustrate how overall agreement can obscure reader variability in tissue diagnostics and how molecular Ct cutoff selection can trade apparent false negatives against apparent false positives in method comparison.
Conceptual framework
We considered two diagnostic-development settings: a tissue diagnostic assay interpreted by pathologists and a molecular diagnostic assay evaluated by method comparison.
The first setting was a tissue diagnostic assay interpreted by three pathologists. The underlying signal was modeled as a continuous tissue score, such as percentage of tumor cells staining positive, percentage of membrane staining, or another biomarker score. A clinical cutoff converted this score into a positive or negative result. A borderline region was defined around the cutoff, reflecting specimens for which scoring uncertainty, staining heterogeneity, or reader interpretation could plausibly change the final classification. This setting corresponds to a reader reproducibility and specimen-spectrum problem.3–5
The second setting was a molecular diagnostic assay evaluated by method comparison against a non-reference comparator assay. The underlying signal was modeled as cycle threshold (Ct). Lower Ct values corresponded to higher target abundance; higher Ct values corresponded to lower target abundance or later amplification. A Ct cutoff converted the continuous amplification signal into a qualitative result. This setting corresponds to an analytical cutoff, detection capability, and method-comparison problem.6–9
Performance measures and terminology
Throughout this article, the primary performance measures are positive percent agreement (PPA), negative percent agreement (NPA), and overall percent agreement (OPA). These terms are used because the examples are designed to evaluate agreement with an analysis anchor, such as a non-reference comparator assay or a simulated latent reference classification, rather than to estimate clinical diagnostic accuracy against an unequivocal reference standard.1,3
Let A denote specimens positive by both the new test and the analysis anchor; B denote specimens positive by the new test and negative by the analysis anchor; C denote specimens negative by the new test and positive by the analysis anchor; and D denote specimens negative by both the new test and the analysis anchor (Table 1).
|
Test |
Analysis Anchor |
|||
|
Positive |
Negative |
Total |
||
|
New Test |
Positive |
Concordant positive |
Positive discordance |
New-test positive |
|
A |
B |
A + B |
||
|
Negative |
Negative discordance |
Concordant negative |
New-test negative |
|
|
C |
D |
C + D |
||
|
Total |
Anchor positive |
Anchor negative |
Total |
|
|
A + C |
B + D |
A+B+C+D |
||
Table 1 Agreement matrix for new test results versus an analysis anchor
NOTE: If the analysis anchor is a true reference standard, A/B/C/D may be interpreted as true positive, false positive, false negative, and true negative, respectively. For a non-reference comparator, B and C are comparator-relative discordances, often described as apparent false-positive and apparent false-negative results, respectively.
Then define the agreement metrics, PPA, NPA, and OPA as follows:
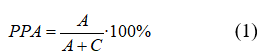


Two-sided 95% confidence intervals for these metrics may be calculated using the Clopper-Pearson binomial method or the Wilson score method.13,14
When the analysis anchor is a reference standard that establishes condition status, these same mathematical quantities may be interpreted as sensitivity, specificity, and accuracy, respectively. When the analysis anchor is a non-reference comparator assay, predicate assay, adjudicated classification, or simulated reference classification, the terms PPA, NPA, and OPA are preferred. In that setting, discordant results should be described as comparator-discordant results or apparent false-positive and apparent false-negative results relative to the comparator, rather than as definitive biological false positives or false negatives.1
Simulated examples
Technical details on how the simulations were conducted can be found in the accompanying code: https://doi.org/10.5281/zenodo.20857803.
Tissue diagnostic simulation
The “latent reference classification” variable was the latent tissue score relative to the cutoff, and majority-reader call was used to summarize the three pathologist readers. A tissue assay with a positivity cutoff of 10% was simulated. The baseline dataset contained 300 specimens:
Three pathologist readers independently assigned observed tissue scores. The observed score for reader r and case i was modeled as:

Reader biases were set at −0.3%, 0.0%, and +0.4%. Random error was modeled as heteroscedastic, with greater variability near the 10% cutoff than far from the cutoff. Next, each reader classified a specimen as positive if the observed score was ≥10%. The primary binary call was the majority call across three readers. Complete reader agreement was defined as all three readers assigning the same binary result.
A 20% sample-enrichment scenario was then simulated by adding 60 specimens to the baseline set, all from the borderline 5% to 15% region. The enriched dataset therefore contained 360 specimens, including 120 borderline specimens. This scenario was designed to illustrate why additional borderline cases may be useful in a tissue-reader study.3,5
In this simulation, the borderline region was defined numerically as the 5% to 15% interval around a 10% positivity cutoff. This was done to create a simple threshold-based example that parallels molecular Ct cutoff analysis. In real tissue-diagnostic studies, however, the challenge set may be defined not only by distance from a numeric cutoff but also by pre-specified interpretive features such as weak staining, focal staining, heterogeneous staining, artifact, control ambiguity, or difficult morphology. Therefore, “borderline” should be understood here as one example of a broader reader-challenge region.
Molecular diagnostic simulation
For molecular simulations, the non-reference comparator assay result was used as the method-comparison benchmark. The simulation study contained 500 specimens: 250 target-present and 250 target-absent. Comparator Ct values for target-present specimens were sampled from three target-concentration regions: strong positives, moderate positives, and late positives. The comparator positivity threshold was Ct ≤38. The investigational assay was modeled as having a mean Ct delay of 0.8 cycles higher than the comparator assay and additional random analytical error. A small proportion of target-absent specimens had late nonspecific amplification, producing apparent false-positive calls depending on the chosen Ct cutoff.6–12
The investigational assay was evaluated at candidate Ct cutoffs of 36, 37, 38, 39, and 40. For each cutoff, PPA, NPA, OPA, apparent false positives versus comparator, and apparent false negatives versus comparator were calculated. Comparator-positive specimens were further stratified by comparator Ct:
This stratification was used to determine whether apparent false negatives were concentrated near the comparator’s late-amplification region.1,8
Example 1: Overall tissue agreement can mask borderline reader variability
In the baseline tissue-reader simulation, overall majority-reader performance appeared strong. Across all 300 specimens, PPA was 146/150, or 97.3%, and NPA was 147/150, or 98.0%. Complete three-reader agreement was 92.3%. However, when the same data were stratified by specimen difficulty, nearly all disagreement was concentrated near the cutoff. In the 60 borderline specimens, PPA was 26/30, or 86.7%, and NPA was 27/30, or 90.0%. Complete three-reader agreement was only 61.7%. In contrast, among clear positive and clear negative specimens, PPA and NPA were each 100%, and complete reader agreement was 100% (Table 2).
|
Group |
# of samples |
Latent reference positive (A+C) |
Latent reference negative (B+D) |
PPA % [A/(A+C)] |
NPA % [D/(B+D)] |
Complete three-reader agreement % |
|
All |
300 |
150 |
150 |
97.3% (146/150) |
98.0% (147/150) |
92.3% |
|
Borderline |
60 |
30 |
30 |
86.7% (26/30) |
90.0% (27/30) |
61.7% |
|
Clear |
240 |
120 |
120 |
100.0% (120/120) |
100.0% (120/120) |
100.0% |
Table 2 Baseline tissue-reader simulation: overall versus borderline performance
PPA=Positive Percent Agreement, NPA=Negative Percent Agreement. A, B, C, D as defined in Table 1.
This example shows why a regulatory reviewer or study statistician may be concerned if a tissue-reader study contains mostly obvious positive and obvious negative cases. The overall estimate may be accurate for the sampled population but insufficiently informative for the clinically difficult region.1,3–5
Example 2: Adding 20% more borderline tissue cases better characterizes the equivocal region
In the enrichment scenario, 60 additional borderline specimens were added to the original 300-case dataset, yielding 360 total specimens. These 60 additional specimens represented a 20% increase in specimen collection and were concentrated in the 5% to 15% region.
After enrichment, the overall PPA was 174/180, or 96.7%, and the overall NPA was 173/180, or 96.1%. Overall complete reader agreement decreased from 92.3% to 87.8% because the enriched study intentionally included more challenging cases. This decline should not be interpreted as worse assay performance; rather, it reflects a more stringent specimen spectrum.
In the enlarged borderline subset, PPA was 54/60, or 90.0%, and NPA was 53/60, or 88.3%. Complete reader agreement was 63.3% (Table 3). The enriched dataset therefore provided a more stable description of the zone in which pathologist disagreement is most likely.
|
Group |
# of samples |
Latent reference positive (A+C) |
Latent reference negative (B+D) |
PPA % [A/(A+C)] |
NPA % [D/(B+D)] |
Complete three-reader agreement % |
|
All |
360 |
180 |
180 |
96.7% (174/180) |
96.1% (173/180) |
87.8% |
|
Borderline |
120 |
60 |
60 |
90.0% (54/60) |
88.3% (53/60) |
63.3% |
|
Clear |
240 |
120 |
120 |
100.0% (120/120) |
100.0% (120/120) |
100.0% |
Table 3 Tissue-reader simulation after 20% borderline enrichment
PPA=Positive Percent Agreement, NPA=Negative Percent Agreement. A, B, C, D as defined in Table 1.
This illustrates the logic of borderline enrichment in tissue diagnostics. The purpose is not simply to increase total sample size but to increase information density where reader variability is expected to be highest.3–5
Example 3: Molecular Ct cutoff selection trades apparent false negatives against apparent false positives
In the molecular simulation, the non-reference comparator assay used Ct ≤38 as positive. The investigational assay had a mean Ct of 0.8 higher than the comparator. Integer-valued Ct cutoffs from 36 to 40 were evaluated.
As the investigational cutoff increased, PPA improved because more late-amplifying comparator-positive specimens were classified as positive by the investigational assay. However, NPA declined because more comparator-negative specimens with late nonspecific amplification were classified as positive (Table 4).
|
Investigational Ct cutoff |
PPA % [A/(A+C)] |
NPA % [D/(B+D)] |
Apparent FP vs comparator (B) |
Apparent FN vs comparator (C) |
OPA |
|
36 |
74.6% (179/240) |
100.0% (260/260) |
0 |
61 |
87.8% |
|
37 |
84.6% (203/240) |
100.0% (260/260) |
0 |
37 |
92.6% |
|
38 |
92.9% (223/240) |
98.8% (257/260) |
3 |
17 |
96.0% |
|
39 |
97.1% (233/240) |
96.5% (251/260) |
9 |
7 |
96.8% |
|
40 |
99.6% (239/240) |
95.8% (249/260) |
11 |
1 |
97.6% |
Table 4 Molecular method-comparison simulation across investigational Ct cutoffs
Ct=Cycle Threshold, PPA=Positive Percent Agreement, NPA=Negative Percent Agreement, FP=False Positive, FN=False Negative, OPA=Overall Percent Agreement. A, B, C, D as defined in Table 1.
This example illustrates why molecular cutoff selection is not equivalent to tissue borderline enrichment. A higher Ct cutoff may rescue low-level positives but may also permit more late nonspecific signals. Conversely, a stricter cutoff may preserve NPA but increase apparent false negatives among low-target specimens.6–12
Example 4: Higher investigational Ct values produce false negatives primarily in late comparator-positive specimens
At an investigational cutoff of Ct ≤38, apparent false negatives were highly concentrated in the late comparator-positive region. Among specimens with comparator Ct ≤33, the investigational assay detected all comparator-positive cases. Among specimens with comparator Ct >33 to ≤36, the investigational assay detected 45/46 cases. Among specimens with comparator Ct >36 to ≤38, the investigational assay detected only 32/48 cases, producing 16 apparent false negatives (Table 5).
|
Comparator stratum |
# of samples |
Investigational positives |
Apparent FN vs comparator |
Apparent FP vs comparator |
Stratum-specific PPA |
Stratum-specific NPA |
|
Comparator Ct ≤33 |
146 |
146 |
0 |
— |
100.0% |
— |
|
Comparator Ct >33 to ≤36 |
46 |
45 |
1 |
— |
97.8% |
— |
|
Comparator Ct >36 to ≤38 |
48 |
32 |
16 |
— |
66.7% |
— |
|
Comparator negative or Ct >38 |
260 |
— |
— |
3 |
— |
98.8% |
Table 5 Molecular simulation at investigational Ct cutoff 38, stratified by comparator Ct
Ct=Cycle Threshold, FN=False Negative, FP=False Positive, PPA=Positive Percent Agreement.
The apparent false-negative pattern is consistent with a molecular cutoff phenomenon: when the comparator is already near its positivity threshold, a modest positive Ct shift in the investigational assay can push the signal beyond the investigational positivity rule. This does not automatically prove that the investigational assay is clinically unacceptable. It does identify where analytical sensitivity, LoD, precision, and decision-rule justification must be carefully examined.6–12
This article distinguishes two superficially similar but scientifically different diagnostic validation problems. In tissue diagnostics, an equivocal or borderline region around a clinical cutoff is often a problem of reader reproducibility, tissue heterogeneity, and specimen-spectrum adequacy. In molecular diagnostics, a cutoff region around Ct or LoD is primarily a problem of analytical detection probability, measurement imprecision, target concentration, and decision-rule selection.3–12
Tissue borderline regions are reader-challenge regions
A tissue diagnostic borderline region asks whether trained readers can apply the scoring algorithm consistently when cases are close to the clinical threshold. However, reader-challenge regions are not limited to assays with a formal numeric borderline zone. In some tissue assays, the most difficult cases may be those with weak or focal staining, heterogeneous signal, artifact, internal-control ambiguity, or complex staining patterns. Thus, the broader design principle is to ensure that reproducibility studies include cases expected to stress reader interpretation. If a study includes mostly clear negatives and clear positives, high overall agreement may mask disagreement in the subset that is most clinically and statistically informative. This illustrates the importance of stratifying analyses by clear versus borderline or otherwise challenging specimens. This is why enriching the study with difficult cases can be useful. The goal is not merely to inflate sample size; it is to reduce uncertainty around reader performance in the region most vulnerable to disagreement.3–5
In the simulation, complete three-reader agreement was 100% in clear cases but approximately 62% to 63% in borderline cases. Without stratification, the overall results appeared excellent. With stratification, the reader challenge was obvious. This pattern is typical of threshold-based interpretation problems: the closer the specimen lies to the decision boundary, the more likely small differences in visual interpretation, region selection, or scoring convention will change the final result.
A 20% borderline enrichment scenario should therefore be interpreted as a design feature. It increases the number of difficult cases and improves the ability to estimate performance in the zone most relevant to equivocal interpretation. However, it should be pre-specified. The protocol should define the borderline region, the reason for enrichment, whether enriched results will be pooled or reported separately, and how equivocal results will be handled in the final analysis.1,3–5
Molecular cutoff analysis is an analytical threshold problem
Molecular cutoff analysis is different. A molecular assay does not have a pathologist interpreting morphology. Instead, it has a signal-generation process, signal-detection algorithm, Ct threshold, and target-detection rule. A higher investigational Ct value can convert a comparator-positive specimen into an investigational-negative specimen, especially when the comparator-positive signal is already late. This is a predictable consequence of analytical variation near the LoD.6–12
The molecular simulation demonstrated this phenomenon. At Ct cutoff 38, nearly all apparent false negatives occurred among specimens with comparator Ct >36 to ≤38. A one-cycle positive Ct shift mattered little for strong positives but was decisive for late positives. This is not a reader reproducibility problem. Adding more “borderline” specimens may help only if those specimens are analytically characterized and used to evaluate LoD, repeatability, cutoff robustness, and detection probability.6–12
Molecular cutoff selection also involves tradeoffs. Raising the cutoff from 36 to 40 improved PPA but reduced NPA. In practice, the optimal cutoff cannot be selected by maximizing OPA alone. The appropriate cutoff depends on intended use, disease prevalence, consequences of false positives and false negatives, analytical sensitivity requirements, contamination controls, invalid/retest rules, and whether late signals are clinically meaningful.1,8,16
Comparator assay limitations must be explicit
A central issue in method comparison is that the comparator assay is not necessarily a reference standard. Therefore, “false positive” and “false negative” terminology should be used carefully. When the comparator is a legally marketed predicate or clinically accepted assay but not a true reference standard, PPA and NPA describe agreement with that comparator, not absolute clinical truth.1,8,17,18
This is important especially near molecular detection limits. A comparator-negative/investigational-positive late Ct result could represent a true low-level positive missed by comparator. Conversely, it could represent nonspecific amplification. Similarly, a comparator-positive/investigational-negative result could represent investigational lack of sensitivity or comparator late nonspecific amplification. Without an independent reference method, replicate testing, sequencing, clinical adjudication, or well-characterized contrived material, categorical truth may remain unresolved.1,6–12
The FDA statistical guidance discourages eliminating or ignoring equivocal results and warns that discrepant-resolution approaches can bias performance estimates.1 This principle applies conceptually to both tissue and molecular settings. In tissue diagnostics, removing equivocal cases can make reader performance look artificially better. In molecular diagnostics, resolving only discordant specimens can create biased estimates if the resolution method is not applied systematically and independently.1,8
Implications for study design
For tissue diagnostics, protocols should define:
For molecular diagnostics, protocols should define:
The study-design response to uncertainty should match the uncertainty mechanism. Borderline enrichment is logical when the problem is reader interpretation near a tissue cutoff. Cutoff verification, LoD characterization, and Ct-bias analysis are logical when the problem is molecular analytical detection.1,3–8,12,15
Limitations
We acknowledge some limitations. First, the examples are simulated and are not intended to represent any specific assay, regulatory submission, product type, disease state, or FDA requirement. The 20% tissue enrichment scenario is illustrative and should not be interpreted as a universal regulatory rule.
Second, the tissue simulation simplified pathologist behavior. Real reader studies may include training effects, washout periods, intra-reader reproducibility, adjudication, multiple specimen types, multiple sites, multiple instruments, ordinal scores, digital image review, and multi-reader multi-case statistical models.14,15 Reader performance may also be affected by human factors such as fatigue, time-on-task, case order, workload, visual strain, and reader drift over the course of a reading session. These factors can be mitigated through pre-specified reader training, randomized case order, adequate washout periods, reading-session limits, breaks, monitoring of reader/session effects, and clear procedures for handling difficult or equivocal cases. In addition, our simulation used three readers, so majority vote could not result in a tie; for studies with an even number of readers, tie-handling rules should be pre-specified.
Third, the molecular simulation simplified PCR behavior. Real molecular assays may involve multiple targets, internal controls, extraction controls, inhibition, target dropout, sequence variation, multiplex competition, replicate rules, platform-specific fluorescence algorithms, and pre-analytical specimen variability.6–12 Fourth, the comparator assay was treated as the method-comparison benchmark rather than a true reference standard. This reflects common IVD method-comparison practice but limits the interpretation of apparent false positives and false negatives.1,8,17,18
Fifth, the article does not provide a definitive sample-size formula. Actual study sizing should be based on intended use, prespecified acceptance criteria, anticipated performance, desired confidence interval width, prevalence or case mix, reader design, and regulatory context.1,3,15
Equivocal or borderline regions in tissue diagnostics and Ct cutoff regions in molecular diagnostics both involve decision uncertainty, but they should not be treated as the same problem. In tissue diagnostics, the key question is whether pathologists can reproducibly classify specimens near a clinical scoring threshold. Adding approximately 20% more borderline specimens can be a rational enrichment strategy when the goal is to stress-test reader reproducibility and characterize the difficult interpretive region. In molecular diagnostics, the key question is whether the assay’s analytical detection process and positivity rule are robust near the cutoff or LoD. Two trends were observed when evaluating investigational Ct cutoffs against the fixed comparator Ct cutoff. Investigational cutoff values below the comparator cutoff produced more apparent false negatives, especially among late comparator-positive specimens. Investigational cutoff values above the comparator cutoff reduced those apparent false negatives but increased apparent false positives by allowing late nonspecific amplification in comparator-negative specimens to be classified as positive. Molecular cutoff analysis should therefore emphasize LoD, precision, Ct bias, target concentration, repeatability, and transparent comparator-discordance analysis. The practical distinction is simple: tissue borderline enrichment asks, “Can readers make the same call near the clinical threshold?” Molecular cutoff analysis asks, “Does the assay make a stable and clinically justified call when the analytical signal is near the detection threshold?” Correctly distinguishing these questions can improve diagnostic study design, statistical analysis, regulatory communication, and clinical interpretation.
JAC contributed to conceptualization, methodology, simulation, writing, original draft, and supervision. VC contributed to writing, review and editing. BCU contributed to writing, review and editing, project administration, and supervision.
Software code and data availability
All generated data and in-silico simulations and statistical analyses were performed using SAS v9.4, Python 3.10, R version 4.2.2. To ensure full computational reproducibility, the complete codebase used to generate the baseline and enriched tissue-reader datasets, as well as the molecular Ct cutoff scenarios, has been made publicly available. The scripts detailing the simulation parameters, can be accessed via Zenodo at https://doi.org/10.5281/zenodo.20857803. No patient-level or proprietary data were used.
Publication costs were provided by StatCon Statistical Consulting, Hayward, California, USA. StatCon Statistical Consulting had no role in the conception or design of the manuscript, development of the simulations, analysis or interpretation of results, preparation or revision of the manuscript, decision to submit the manuscript for publication, or approval of the final content. The authors are solely responsible for the content and conclusions of this article.
JAC is an employee of Roche Molecular Systems, Inc., Pleasanton, California USA and owns Roche stock. VC is an employee of Ventana Medical Systems, Inc., Tucson Arizona, USA. BCU is an employee of IT Engagement Inc. Bridgewater, New Jersey, USA.

©2026 Canchola, et al. This is an open access article distributed under the terms of the, which permits unrestricted use, distribution, and build upon your work non-commercially.