eISSN: 2574-9927


Research Article Volume 1 Issue 4
1Institute of Fundamental Technological Research, Polish Academy of Sciences, Polish Academy of Sciences, Poland
2Wroclaw University of Technology, Poland
3Institute of Materials and Machine Mechanics, Slovak Academy of Sciences, Slovakia
Correspondence: Zbigniew Ranachowski, Institute of Fundamental Technological Research, Polish Academy of Sciences, Poland
Received: December 04, 2017 | Published: December 18, 2017
Citation: Ranachowski Z, Schabowicz K, Gorzelanczyk T, et al. Visualization of fibers and voids inside industrial fiber concrete boards. Material Sci & Eng Int J. 2017;1(4):138-140. DOI: 10.15406/mseij.2017.01.00022
Fiber cement boards (FCB) microstructure and methods of fabrication are described. The method of X-ray microtomography in application for investigating of FCB microstructure is presented. The cellulose fibers constituting the remarkable reinforcement of the FCB are colorless and too small to be seen applying the standard optical methods. The X-ray microtomography method however enabled the authors to realize three goals within the investigation of the properties of FCB. The length and shape of the fibers could be assessed on specimens’ cross-sections. Applying the pseudo 3D visualization it was possible to visualize the cracked regions inside the specimen volume. The case of non-uniform fibers distribution in respect to the board thickness which was impossible to recognize applying the standard visual inspection, was also performed by merging the multiple cross-section images into a single graph.
Fiber cement boards (FCB) replaced wide spread but now banned by law and harmful asbestos building products. Despite the complexity of FCB fabrication process the material is widely implemented. They are used in building construction, as siding, ceilings, floors, roofs and tile backer boards. The cellulose fiber cement siding is commonly used as a replacement for wood siding, as it is less expensive and more durable, and has lower maintenance costs.1 The FCB also referred to as precast fabrication, are becoming more and more important in the entire construction sector.
The final properties of cellulose fiber cement composites depend, aside from the fiber and the matrix components, on the manufacturing process. The majority of the fabrication methods for cement composites reinforced with fibres in the pulp form are based on the Hatschek process, patented by L. Hatschek in 1900. It is a semi-continuous process comprised of three steps: sheet formation, board formation, and curing,2 other newer methods are extrusion of pulp cement mixtures and laminates with long fibers or sheet-like structures. Extrusion allows the alignment of the pulp fibers in the machine direction and the lamination methods allow reinforcement with semi-finished products, such as unidirectional long fibers, to ensure a higher level of enforcement in the desired direction.3 Common applied fibers are of 2.5 to 3mm of length and of 30-50μm in diameter. In some FCB of lower quality short fibres derived from recycled cellulose of ca. 1mm long are used. The mechanical properties, durability and microstructure of the fibre cement composites are described in.4,5
X-ray microtomography (micro-CT) has the ability to create a 3D imaging of specimen internal microstructure with a resolution of ca. 1-5μm per voxel (volumetric pixel). The inventors of medical Computed Tomography were in 1979 Allan MacLeod Cormack and Godfrwey Newbold Hounsfield.6 The early study of pore size distribution and of pore connectivity in concrete samples using this method was performed by Lu et al. in 2005 and presented in.7
Several papers concern the application of micro-CT technique in testing the properties of concrete. Garboczi8 reconstructed the aggregate shapes in concrete with voxel resolution of 0.4mm3. This enabled the author to approximate the real shapes by its mathematical models to build the stereological model of entire population of aggregates. Lanzón et al.9 used the micro-CT method to test the specimens made of concrete with low-density additions: expanded perlite, expanded glass and cenospheres (hollow microspheres). Stock et al.10 analysed the progression of sulfate attack within the cement paste by examining the microtomograms. It was found that recognized damage levels in specimens exposed to a Na2SO4 solution in different conditions varied from 0 (no damage) to 4 (extreme damage).
The equipment for insight into specimen’s microstructure with micro-CT technique is produced at present by a few firms and these apparatus are capable to perform tests on the small specimens of few millimetres size or on large elements of a few meters. They include the microfocal source of X-ray radiation, the movable table to place a specimen and the flat panel with a radiation detector, which resolution usually equals 2000x2000 pixels. The microstructure of is visualized on the cross-sections (tomograms) of the investigated specimen using grey scale convention related directly to the amount of local radiation absorption of the material. The grey scale covers several tens of grey levels and is ordered from white related to maximum of absorption to black related to the minimum, respectively. Unhydrated cement particles and aggregate grains are objects of the greatest absorption. The hydratation products that cover major part of the cement matrix present slightly lower absorption ability. The next in the line are hydrated calcinates and at the end of the scale are the organic fibres (if present) and the regions of high porosity. The image resolution of microtomograms usually varies from 1 to 10µm per voxel. The advantage of micro-CT technique is a possibility of reconstruction of 3-dimensional image of investigated objects and to determine the volumetric part of the material occupied by bulk matrix, aggregates, voids, cracks, fibres etc. In the paper the examples of the microstructure visualisation of the four FCB specimens differing with their fiber content and size as well as the occurrence of cracks, are presented below.
The authors analysed four specimens made of four different FCB compositions. According to the determined micro-CT scanning procedure, i.e. 100 X magnification, cylindrical cores 7mm in diameter and 7mm in height were cut from the boards by drilling. The specimens were extracted from the fibre cement panels 10mm thick supplied by the manufacturer. Prior to analysis, the panels were tested using standard procedures to evaluate their performance. Material ‘A’ was characterized by low moisture absorbability nw (8-10%) and the bending strength of panels was 11-13MPa. Based on the data provided by the manufacturer, the concentration of fibres by weight in that material was 6% for good quality 2.5mm long cellulose fibres. Material ‘B’ was made using the same technology as material ‘A’, but contained 6% (wt.) recycled cellulose short fibres ca. 1mm long and thus the bending strength of panels was lower: 8, 5-10 MPa. Specimen ‘C’ was of the same type of ‘A’ but the distinct crack was detected in its volume after the drilling procedure. Material ‘D’ was obtained by the accelerated production technology applying autoclaving. The research presented below have revealed non-uniform, (torn) distribution of fibers in it.
The specimens were tested using Nanotom 30 microtomograph by General Electric at the Institute of Materials and Machine Mechanics in Bratislava. The following parameters were set: lamp voltage -115kV, lamp current -95 micro amps, shot exposition time -750ms. The equipment was capable of producing the data sets defining the microstructure of the specimen in the form of:
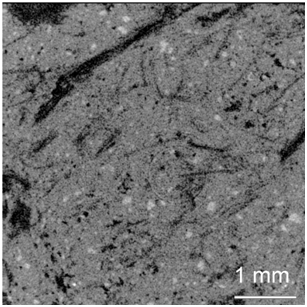
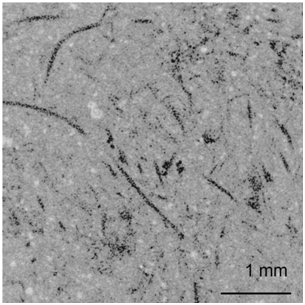
The spatial resolution of the reconstructed microstructure was 4.3µm3 per voxel. The final result of micro-CT scanning performed by the authors was a set of tomograms (specimen cross-sections), performed every 5µm of the specimen height. This set of tomograms consisted of 1200 cross-sections, 1200x1200 pixels each. Figure 1 & 2 shows the example specimen cross-sections illustrating material microstructure with clearly visible difference in fibre shape. The black coloured fibres in the image of specimen coded ‘B’ are shorter and thinner than those shown in the image of specimen coded ‘A’.


The recorded data allows presenting a greater number of cross-sections within the single graph using a quasi 3D projection. However, the total number of bytes related to the consecutive voxels in such a dataset would be 1.5x109 bytes, and would require additional lengthy processing. Therefore, a specific subset was taken from the entire dataset, preferably cube-shaped for further processing. The resulting subset is referred to as a ROI (Region of Interest) and might include cracked areas in the proximity of the specimen surface, usually damaged by a drilling tool. The study included 3 ROIs 9303 (804,000,000) voxels each, representing 4x4x4=mm cubes and virtually extracted from the analysed specimens.
In some circumstances, the digital data representing a local level of radiation absorption of scanned volume allows to automatically detect large volume defects (cracks). The procedure involves comparing the brightness of adjacent voxels to find the low density areas with a size exceeding the fibre dimensions. The process is referred to as the determination of voxel connectivity and is described in.10–13 The authors developed special software to examine the voxel’s interconnection in datasets obtained through micro-CT scanning. At the beginning, a certain number of ‘walkers’ was distributed randomly across the processed ROI. The ‘walkers’ occupied one voxel of space and could be understood as a marked point in the dataset representing the analysed volume of the specimen (compare small circles depicted in (Figure 3)). The walkers would migrate into the adjacent voxels following the information on voxels brightness (i.e. material density). The walkers would jump in random directions, provided that the adjacent voxel belonged to a permitted low-absorption phase, otherwise the jumps were discarded. After refreshing the position of all walkers, one epoch of their action was completed by the algorithm. Figure 4 shows the image of the FCB specimen coded ‘C’ including a large crack. Graphical visualization of the walker’s movements in the bulk of the specimen depicting the crack is presented in Figure 3. To visualize the faults of the fabricating technology resulting in the non-uniform distribution of fibers as it has occurred in the specimen coded ‘D’ the three-dimensional projection joining the all cross-sections was applied as it was presented in Figure 5.
The micro-CT technique was presented in the paper as a sole method for determining of the distribution of fibers of small diameter and cracks inside of bulk of composite objects such as FCB. The microtomograph applied in the research delivered the large amount of digital data enabling for its processing applying different techniques, depending on the type of the visualization required. The presented method can be then recommended as the efficient means for testing the FCB quality.
None.
The author declares no conflict of interest.

©2017 Ranachowski, et al. This is an open access article distributed under the terms of the, which permits unrestricted use, distribution, and build upon your work non-commercially.