eISSN: 2574-9927


Research Article Volume 2 Issue 5
Kielce University of Technology, Poland
Correspondence: Stanisław Borkowski, Kielce University of Technology, Poland
Received: October 08, 2018 | Published: November 7, 2018
Citation: Borkowski S. The improvement of processes in car industry with the usage of 14 principle of Toyota’s management. Material Sci & Eng. 2018;2(5):171-177. DOI: 10.15406/mseij.2018.02.00052
The article is presenting the results of research conducted in company which produces car parts. It was introduced an analysis of results obtained on the base of the BOST questionnaire survey and it was made a statistical analysis concerning fourteenth Toyota management principle.
Keywords: BOST method, toyotarity, car parts, improvement
The researched enterprise produces hubcaps of high-quality plastics and covers them with weather resistant paint. The company produces hubcaps for cars of various makes, but their purpose is the same. They only differ in appearance, colour and design. A hubcap fits all the steel rims, they have a reliable fastening – a steel ring.
The fourteenth principle teaches us continual reflection (hansei) and continuous improvement.1 According to this principle it is crucial to determine the causes of a problem by solving technical issues. Continuous improvement of the process and production is extremely significant for a company which has been functioning on the market for many years. Constant improvement helps to satisfy customers’ expectations. Respondents were asked to provide answers to the following question.2
Decide with the use of the scale 1-10 (10 the most important factor) which area can bring the best effects after being improved? The set of factors was selected for description of the fourteenth Toyota management principle.
ZT Employment of workers
SM Incentive system
PT Portfolio of technology
JK Quality
RE Employee – Superior relationship
DA Documentation
PN Flow of information
WS Cooperation with customers
UM Machine maintenance
WD Cooperation with suppliers, partners
Table 1 presents a numerical list of significance rates for factors belonging to area E8. Data from Table 1 shows the number of employees’ rates for a particular answer.2
Evaluation |
|
|
|
|
Indicating the factors |
|
|
|
||
ZT |
SM |
PT |
JK |
UM |
RE |
DA |
PN |
WS |
WD |
|
1 |
0 |
0 |
1 |
0 |
1 |
4 |
1 |
0 |
9 |
21 |
2 |
1 |
5 |
3 |
0 |
0 |
5 |
2 |
4 |
12 |
5 |
3 |
9 |
5 |
0 |
0 |
1 |
13 |
0 |
2 |
5 |
2 |
4 |
9 |
7 |
2 |
0 |
3 |
7 |
0 |
4 |
4 |
1 |
5 |
5 |
5 |
0 |
1 |
9 |
7 |
3 |
4 |
2 |
1 |
6 |
2 |
2 |
10 |
3 |
2 |
0 |
6 |
9 |
3 |
0 |
7 |
2 |
0 |
2 |
14 |
3 |
0 |
12 |
3 |
0 |
1 |
8 |
0 |
3 |
4 |
10 |
9 |
0 |
6 |
5 |
0 |
0 |
9 |
7 |
3 |
8 |
7 |
1 |
1 |
4 |
4 |
0 |
2 |
10 |
2 |
7 |
7 |
2 |
8 |
0 |
3 |
2 |
2 |
4 |
Table 1 Principle 14. Numerical summary of importance ratings of E8 area factors. Applies to the production of car hubcaps
Source: own study, in cooperation with the test object
They allowed for determining a percentage structure of significance rates for particular factors. The results have been listed in Table 2 . The following work has been used in the scope of results' analysis, especially their graphic interpretation.3
Evaluation |
|
|
|
Indicating the factors |
|
|
|
|
||
ZT |
SM |
PT |
JK |
UM |
RE |
DA |
PN |
WS |
WD |
|
1 |
0,0 |
0,0 |
2,7 |
0,0 |
2,7 |
10,8 |
2,7 |
0,0 |
24,3 |
56,8 |
2 |
2,7 |
13,5 |
8,1 |
0,0 |
0,0 |
13,5 |
5,4 |
10,8 |
32,4 |
13,5 |
3 |
24,3 |
13,5 |
0,0 |
0,0 |
2,7 |
35,1 |
0,0 |
5,4 |
13,5 |
5,4 |
4 |
24,3 |
18,9 |
5,4 |
0,d0 |
8,1 |
18,9 |
0,0 |
10,8 |
10,8 |
2,7 |
5 |
13,5 |
13,5 |
0,0 |
2,7 |
24,3 |
18,9 |
8,1 |
10,8 |
5,4 |
2,7 |
6 |
5,4 |
5,4 |
27,0 |
8,1 |
5,4 |
0,0 |
16,2 |
24,3 |
8,1 |
0,0 |
7 |
5,4 |
0,0 |
5,4 |
37,8 |
8,1 |
0,0 |
32,4 |
8,1 |
0,0 |
2,7 |
8 |
0,0 |
8,1 |
10,8 |
27,0 |
24,3 |
0,0 |
16,2 |
13,5 |
0,0 |
0,0 |
9 |
18,9 |
8,1 |
21,6 |
18,9 |
2,7 |
2,7 |
10,8 |
10,8 |
0,0 |
5,4 |
10 |
5,4 |
18,9 |
18,9 |
5,4 |
21,6 |
0,0 |
8,1 |
5,4 |
5,4 |
10,8 |
Table 2 Principle 14. Rating structure [%] of E8 area factors. Applies to the production of a car wheel cowl
Source: own study
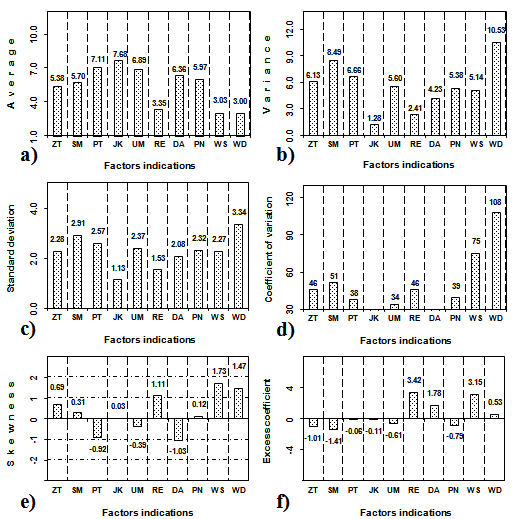
Figure 1 presents a list of these descriptions. Superficial analysis of the Figure 1 notes that there is a great difference between the average values. The highest average rate was granted to the quality factor (JK), in the case of the average rate the minimum of 3.0 was recorded for the cooperation with suppliers and partners (WD). The range amounts to 4.68, which means that it is almost in the middle of the rating scale. Variances (Figure 1) and standard deviation (Figure 1) of rates for the above mentioned factors have extreme values. The range for the variation coefficient of acquired distribution rates (Figure 1) amounts to 93%. It is a result of distribution of importance rates of the already characteristic factors: quality (JK) and cooperation with suppliers and partners (WD). Using the data sheet,4 we have found that the dispersion force of a statistical group of importance rates from the E8 area comprises all the four ranges and thus in the range: variation weak features (group of rates for one factor), variation moderate features (group of rates for four factors), variation strong features (group of rates for three factors), variation very strong features (group of rates of two factors). It should be underlined that for the group of rates for the factor cooperation with suppliers and partners (WD) the coefficient of variation is higher than 10%, which occurs only occasionally.

Figure 1 Principle 14. Comparison: a) average, b) standard deviation, c) variance, d) coefficient of variation, e) skewness, f) kurtosis for E14 area factors. Applies to the production of a car wheel cowl.
Source: own study
The analysis of skewness of the factor importance rates distribution describing the fourteenth Toyota management principle comes down to the following facts:
In the scope of distributions of significance rates for the factors from the E8 area we have found that in four cases (for group of rates for the factor employee – superior relationship – RE, documentation – DA, cooperation with customers – WS, cooperation with suppliers and partners WD) there is higher than usual peakedness.
Importance quantification of the analysed factors for separate rates
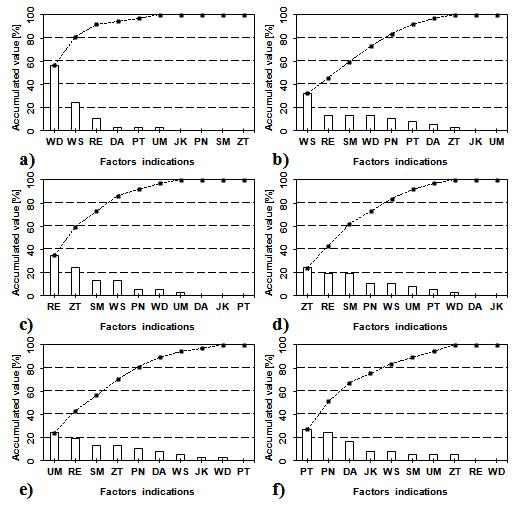
Data from Table 1 & Table 2 has been used to construct Pareto diagrams, which describe the hierarchy of factors and demonstrate the relations between them. Figure 2 presents Pareto diagrams for assessment of separate factors from the area E8.
The interpretation of data in the Figure 2 comes down to a conclusion that there are five levels of percentage share for importance of discussed factors for the rate “1”. The levels are as follows:
The above approach to analysis of the data on Figure 2 allowed at the same time to reveal the maximum value – percentage share of the factor's significance, which is the cooperation with suppliers, partners (WD). The significance sequence of factors belonging to area E8 for the rate “1” is as follows:
WD > WS > RE > (DA; PT; UM) > (JK; PN; SM; ZT) (1)
Abbreviations for the factors which have the same percentage share in a given rate have been presented in brackets. The analysis of Figure 2 allows the author to state that the significance sequence of discussed factors for a given rate is as follows:
WS > (RE; SM; WD) > PN > PT > DA > DA > ZT > (JK; UM) (2)
In this case we deal with seven levels of percentage shares of factors describing the fourteenth Toyota management principle. The maximum percentage share of the rate “2” has the factor of cooperation with customers (WS).6
The superficial analysis of the description of the X axis in Figure 2 draws our attention to the fact that there is a shift of indications in comparison with the previous Figure 2. This fact is confirmed by inequity:
RE > ZT > (SM; WS) > (PN; WD) > UM > (DA; JK; PT) (3)
The outer places were taken by factors other than in formulas 1-2. It can be stated that according to respondent’s rate “3” should be granted to factors different than it was previously (for rates “1” and “2”). It should be underlined that three factors were not granted rate “3”.


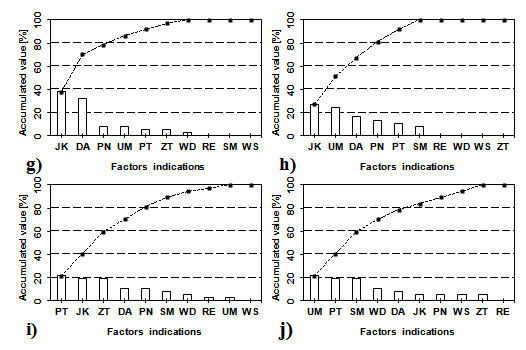
Figure 2 Principle 14. Pareto-Lorenz diagrams of the factors’ importance E8 area for evaluations: a) „1”, b) „2”, c) „3”, d) „4”, e) „5”, f) „6”, g) „7”, h) „8”, i) „9”, j) „10”.
Source: own study
Rate “4”, Figure 2. We can notice peakedness of histograms, in other words, we observe levelling out with previous assessments of percentage shares of significance for factors belonging to the area E8. The factor employment of workers has gained recognition among respondents (ZT) and takes the first place in the description of the X axis. For this rate we can observe seven levels of percentage share of the factors' significance, as it arises from inequity (4).
ZT > (RE; SM) > (PN; WS) > UM > PT > WD > (DA; JK) (4)
During the analysis of the last rate “5” below the average rate (Figure 2 we also found a significant peakedness of percentage shares (positive as in the Figure 2), the number of percentage shares levels of factors' significance is eight (model 5).
UM > RE > (SM; ZT) > PN > DA > WS > (JK; WD) > PT (5)
The maintenance of machines factor (UM) takes the first place in the significance sequence for the rate “5”, whereas this rate was not used when it comes to assessment of the factor: portfolio of technology (PT). Taking first places in significance sequences by factors, starting from the scale “6” results in taking leading places in the significance sequence of factors for average rates. These chances grow together with the increase of the scale of rates.
For particular rates within the scope “6” – “10” we acquire the following significance sequences for factors describing the fourteenth Toyota management principle:
Rate „6”
PT > PN > DA > (JK; WS) > (SM; UM; ZT) > (RE > WD) (6)
Rate „7”
JK > DA > (PN; UM) > (PT; ZT) > WD > (RE; SM; WS) (7)
Rate „8”
JK > UM > DA > PN > PT > SM > (RE; WD; WS; ZT) (8)
Rate „9”
PT > (JK; ZT) > (DA; PN) > SM > WD > (RE; UM) > (9)
Rate a „10”
UM > (PT; SM) > WD > DA > (JK; PN; WS; ZT) > RE (10)
From the analysis of the significance sequences for factors belonging to area E8 and for rates “6” – “10” it arises that:
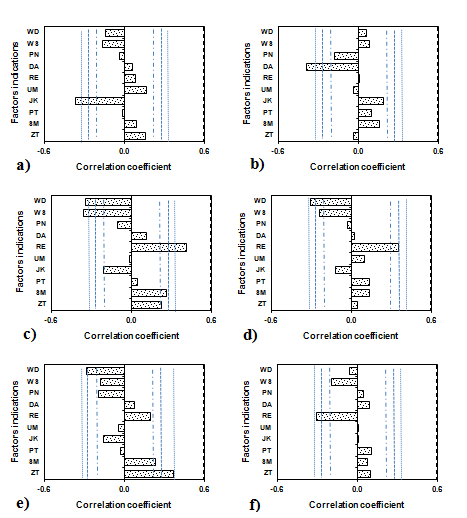
Figure 3 presents correlation graphs for factors of the area E8 depending on respondents' features: gender, education, age, seniority, mobility and type of employment.

Figure 3 Principle 14. Correlation graphs for E8 area factors depending on the characteristics of the respondents: a) gender, b) education, c) age, d) work experience, e) mobility, f) mode of employment. α = 0.2 (internal lines), α = 0.1 (middle line), α = 0.05 (external lines).
Source: own study
The chapter presents the results concerning the assessment of functioning of the enterprise producing car hubcaps with the use of\ a set of factors describing the fourteenth Toyota management principle. Statistical analysis of acquired distributions of factors' significance according to respondents was carried out. High diversity of these distributions was demonstrated in terms of average, variance, and standard deviation, coefficient of variation, skewness and kurtosis. In the case of the coefficient of variation and skewness, the collectivity of rates was distributed among all the possible groups due to the force of dispersion and asymmetry. Significance sequences were created for each of the ten rate scales and for the average rate based on properties of the Pareto diagram. It was proved that the factor, which may bring the greatest benefit after its improvement (with use of knowledge), is quality. Quality may be improved by appropriate technologies. This fact was underlined by respondents and the portfolio of technology factor took the second place in a sequence.
Respondents differ in terms of their personal features: gender, age, education, seniority, mobility, type of employment. In order to determine the influence of these features, correlation coefficients were calculated and presented in the form of graphs in Figure 3. Each of these pictures also contains three characteristic lines on each side of the 0 axis. It should be noted that their distance from the 0 axis is the same in all the Figures, because they represent the value of a critical coefficient for various levels α (0,05; 0,10; 0,2).
The analysis of Figure 3 allows for drawing the following conclusions:
BOST survey is successfully used in manufacturing enterprises as well as in service enterprises (e.g. banks, hospitals, schools, shops). It is worth mentioning that for each trade a different questionnaire, containing specific vocabulary characteristics for that trade, should be used. Ranges: of fixed time and without time limits.
None.
None.

©2018 Borkowski. This is an open access article distributed under the terms of the, which permits unrestricted use, distribution, and build upon your work non-commercially.