eISSN: 2574-9927


Research Article Volume 2 Issue 6
Kielce University of Technology, Poland
Correspondence: Stanislaw Borkowski, Kielce University of Technology, Faculty of Management and Computer Modelling, Poland
Received: October 08, 2018 | Published: December 5, 2018
Citation: Borkowski S. The importance of factors which describe the 3 Toyota principle in the bost method during the functioning of special processes. Material Sci & Eng. 2018;2(6):206–210. DOI: 10.15406/mseij.2018.02.00058
The article shows an analysis of results obtained on the base of the BOST questionnaire survey. It was made a correlation analysis connected with third Toyota management principle. Evaluation structure was presented in a graphic form.
Keywords: BOST method, toyotarity, special processes, Toyota principles
Using a pull system refers to on time production that provides a customer with what he expects in requested amounts and in a specific period. This thought was formulated as a set of factors, the significance of which was assessed by respondents. They were asked to answer the following question: Organization of the production system guarantees: Please fill the blanks with 1; 2; 3; 4 (4 the most significant factor) (Table 1). The set of factors describing the third Toyota management principle shall be referred to as factors belonging to the E4 area. The research was carried out in a sheltered workshop. The production process in this workshop consists of producing elements of clothes: shirts, trousers and a carrying bag which, combined with butyl gloves and soles, creates the final product. The results of the conducted survey were presented in Table 2, which contains, a numerical list of significance rates for factors belonging to area E4.1 The data from Table 2 served as a basis for calculation of the significance rates structure for factors belonging to area E4, which were presented in Table 3. The data placed in Tables 2 & 3 served as a basis for graphic presentation of results. For significance rates of factors belonging to the E4 area there were prepared radar charts presenting the percentage distribution of rates for separate factors. The data was also interpreted in the form of correlation graphs and used for preparation of Pareto diagrams, presenting the significance of factors describing the third Toyota principle for particular rates.2
DZ |
Production on customer's request |
MM |
Maximum usage of machines, people |
PZ |
Creation of product reserves |
BS |
Quick order processing |
Table 1 Organization of the production system guarantees
Evaluation |
Factors indications |
|||
DZ |
MM |
PZ |
BS |
|
1 |
0 |
2 |
16 |
2 |
2 |
2 |
6 |
4 |
5 |
3 |
4 |
6 |
0 |
10 |
4 |
14 |
6 |
0 |
0 |
Table 2 Principle 3 numerical summary of importance ratings of E4 area factors. Applies to company producing protective equipment Source own study
Evaluation |
Factors indications |
|||
DZ |
MM |
PZ |
BS |
|
1 |
0,0 |
10,0 |
80,0 |
10,0 |
2 |
10,0 |
30,0 |
20,0 |
40,0 |
3 |
20,0 |
30,0 |
0,0 |
50,0 |
4 |
70,0 |
30,0 |
0,0 |
0,0 |
Table 3 Principle 3 structure rating [%] of importance ratings of E4 area factors. Applies to company producing protective equipment Source own study
Figure 1 contains a graphic interpretation of the structure of respondents' rates for each factor belonging to area E4. After analysis of the rates structure for production on customer's request (DZ) it may be stated that the percentage share of the significance rate “4” amounts to 70% (Figure 1A). This way almost at the beginning of the survey the most important factor emerges in the process of elimination of waste caused by overproduction. Only 10% of respondents have granted rate “2” to this factor, the other 20% - rate “3”. In the case of the factor of rational use of machines and people (MM), each of the 30% of respondents have granted rates “2”, “3” and “4”, and only 10% of respondents have regarded this factor as irrelevant due to proper organization of the system. Taking into account the creation of product reserves (PZ) it can be observed that it was not granted a rate higher than “2”. In 80% of cases respondents regarded creation of product reserves (PZ) as an irrelevant factor, while the remaining 20% of respondents claimed that this factor is barely significant. The factor of quick order processing (BS) has not acquired any rate on the level “4”. Half of the respondents have granted this factor rate “3”, 40% - rate “2”, and 10% have considered this factor as irrelevant.3‒7
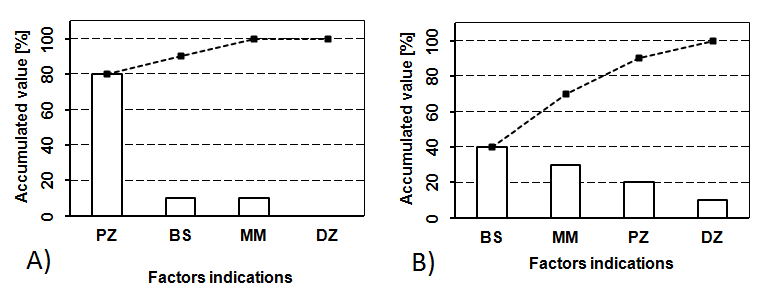
Figure 2 presents significance sequences describing the third Toyota' management principle for particular rates. The following significance sequences of factors have been obtained (order of description of the X axis):


Figure 2 Principle 3. Pareto-Lorenz diagrams of factor importance of the E4 area for rates: A) "1", B) "2", C) "3", D) "4". Applies to company producing protective equipment. Source own study.
Rate “1”
PZ > (BS, MM) > DZ (10.1)
Rate “2”
BS > MM > PZ > DZ (10.2)
Rate “3”
BS > MM > DZ > PZ (10.3)
Rate “4”
DZ > MM > (PZ; BS) (10.4)
For average value (based on Figure 1E)
DZ > MM > BS > PZ (5)
As far as places taken by factors in significance sequences are concerned, the factors which take the first place in significance sequences for low rates take the last place in significance sequences for average rates. Nevertheless, the rotation of places indicates a correct construction of the list of factors describing Toyota's management principles. In this case in relation to the set of factors describing the third Toyota management principle and its functioning in the enterprise producing light insulation protective clothes, the respondents decided that the most important factor is production on customer's request (DZ), the percentage share of an average significance rate for this factor is very high and amounts to 38% (the average for 4 factors amounts to 25%). One of the conditions of completing production on customer's request (DZ) is promptness and quality, which is equivalent to rational use of machines and people (MM). For this reason that factor has taken the second place in the significance sequence (percentage share of average significance rate amounts to 28%).
Another stage of results analysis includes the interpretation of maps of rates numbers presenting the dependence of the factor belonging to E4 area on a particular respondent's features. Figure 3 presents the interpretation of the significance rate for the factor of quick order processing (BS) from the E4 area depending on respondents' features. This factor, as it arises from the correlation (5), has taken the next to last place in the significance sequence. For this reason, regardless of the respondent's feature, no rate higher than “4” has been granted. In relation to descriptions of respondents it can be stated that 20 people have participated in the test, with an almost equal number of women and men. Half of them had higher education, the other half had secondary education. Their age varied between 31 and 60, seniority between 6–30, half of the respondents had earlier worked in two enterprises, more than half of them were employed for financial reasons. While analyzing the chart of significance assessment of the factor of quick order processing (BS) in relation to respondents' gender, it should be noted that most men have assessed this factor on the level “2” (5). In the case of women the most often selected answer was rate “3” (4). The distribution of rates given by respondents with secondary education is as follows: rates “1” and “2” were selected by 4 people each and rate “3” - by 1 person. Four employees with higher education have chosen rates “3” and another four of them have chosen rate “2”, whereas the lowest rate was chosen only by two people. The analysis of answers in terms of respondents' age allows for observation that the factor of quick order processing has been assessed with the lowest rate (BS) by one person from each age group 31-40years and 41-50years and 4 people of age between 51-55. While analyzing the answers with regard to respondents' seniority it can be observed that the most often selected rate was “2”, 3 answers were given by people with seniority between 6 - 10, 2 people with seniority 15-20, 2 people with seniority 21-25 and 1 person with seniority between 26-30.


Figure 3 Principle 3 area E4. Severity rating of BS factor according to the characteristics of respondents: A) gender, B) education, C) age, D) work experience, E) mobility, F) mode of employment. Applies to company producing protective equipment. Source own study.
The highest rate acquired by the factor of creation of product reserves PZ was “5” and it was granted by 2 people with seniority between 21 – 25 and 2 people with seniority between 26–30. According to the chart presenting the relationship between the rates and the respondents’ seniority it can be noticed that the lowest rate for the factor of quick order processing (BS) was granted by 4 people, for whom the tested enterprise is the first job and 2, for whom it is the third place of work. The rate “2” was granted by 4 people from each of the groups of people employed for the first and for the third time. In the case of relationship between the type of employment in the group of people employed on normal basis and those who took up the job due to better financial conditions, the most often rate was “2” (4 answers in the group). The workers employed on the basis of transfer have most often assessed the factor of quick order processing (BS) on the lowest level (5 answers).
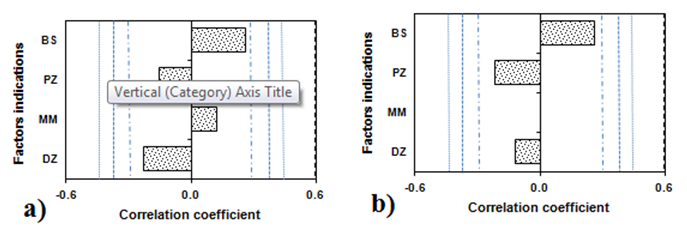
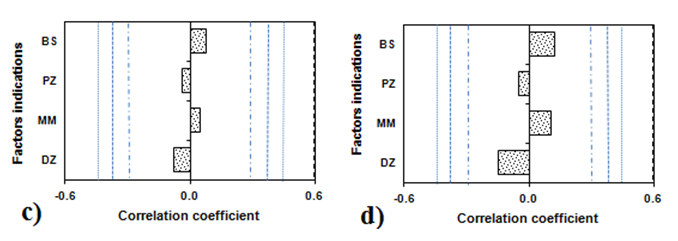
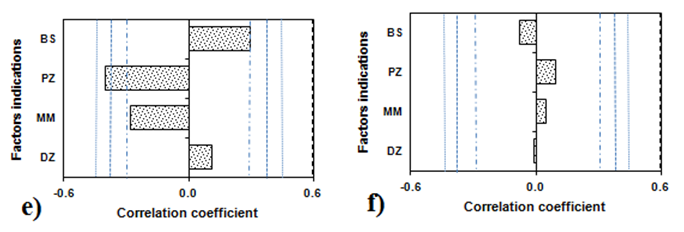
The acquired significance rates of the factors describing the third Toyota management principle and the description of respondents served as a basis for defining the relations between these groups of results. These relationships were presented in forms of graphs (Figure 4). Each graph characterizes the occurrence and type of correlation between a given answer and gender, education, age, seniority, mobility and type of employment. Three levels of significance a (0,05; 0,1; 0,2) have been adopted. Such approach is conditioned by the fact that in this type of test the problem of correlation is not raised. Justification for a=0,2 may be the fact that the tests involved participation of people whose opinions are diversified (turbulent) and in order to capture correlations the adopted level of probability is acceptable. From the layout of characteristic lines and height of histograms in Figure 4 we can notice that only for mobility (Figure 4E) the height of the histogram representing correlation coefficient between the rates of the factor product reserves creation (protective clothes) – (DZ) and mobility of respondents is bigger than the distance of line for the critical value of the correlation coefficient for a=0,1 and 0,2. One the other hand, for the factor of quick order processing (BS) the correlation takes place only for a=0,2. Lack of influence of individual features of respondents is clearly a result of forming enterprise culture, great dispersion of rates or a small test sample (in this specific case the last condition cannot be corrected because almost the whole crew took part in the survey). Significance sequences of factors describing the third Toyota management principle are an interesting element. They contain a logical order conditioned by organization of production of a specific article. Acquired results and their multidimensional analysis confirm the accuracy of factors choice describing the third Toyota management principle. High “sensitivity” of the presented results has been proved in the scope of assessment of an existing condition in the enterprise producing protective clothes (sheltered workshop).


Figure 4 Principle 3 Correlation graphs for E4 area factors according to the characteristics of respondents: A) gender, B) education, C) age, D) work experience, E) mobility, F) mode of employment. α=0.2 (internal lines), α=0.1 (middle lines), α=0.05 (external lines). Applies to company producing protective equipment. Source own study.
None.
Authors declare that there is no conflict of interest.

©2018 Borkowski. This is an open access article distributed under the terms of the, which permits unrestricted use, distribution, and build upon your work non-commercially.